User login
Leadership & Professional Development: Cultivating Microcultures of Well-being
“As we work to create light for others, we naturally light our own way.”
– Mary Anne Radmacher
Perhaps unknowingly, hospitalists establish microcultures in their everyday work. Hospitalists’ interactions with colleagues often occur in the context of shared workspaces. The nature of these seemingly minor exchanges shapes the microculture, often described as the culture shared by a small group based on location within an organization. Hospitalists have an opportunity to cultivate well-being within these microcultures through gracious and thoughtful acknowledgments of their peers. Collegial support at the micro level influences wellness at the organizational level. A larger shared culture of wellness is necessary to nurture physicians’ personal fulfillment and professional development.1
We propose the CARE framework for cultivating well-being within the microcultures of hospital medicine shared workspaces. CARE consists of Capitalization, Active listening, Recognition, and Empathy. This framework is based on positive psychology research and inspired by lessons from The Happiness Advantage by Shawn Achor.2
Capitalization. Capitalization is defined as sharing upbeat news and receiving a positive reaction. Emotional support during good times, more so than during bad times, strengthens relationships. When a peer shares good news, show enthusiasm and counter with an active, constructive response to maximize the validation she perceives.2
For example, Alex sits at her desk and says to Kristen: “
My workshop proposal was accepted for medical education day!” “
Congratulations, Alex! Tell me more about the workshop.”
Active listening. Active listening requires concentration and observation of body language. Show engagement by maintaining an open posture, using positive facial expressions, and providing occasional cues that you’re paying attention. Paraphrasing and asking targeted questions to dive deeper demonstrates genuine interest.
“Katie, I could use your advice. Do you have a minute?”
Katie turns to face John and smiles. “Of course. How can I help?”
“My team seems drained after a code this morning. I planned a lecture for later, but I’m not sure this is the right time.”
Katie nods. “I think you’re right, John. How have you thought about handling the situation?”
Recognition. Acts of recognition and encouragement are catalysts for boosting morale. Even brief expressions of gratitude can have a significant emotional impact. Recognition is most meaningful when delivered deliberately and with warmth.
Kevin walks into the hospitalist workroom. “Diane, congratulations on your publication! I plan to make a medication interaction review part of my discharge workflow.”
Leah turns to Diane. “Diane, that’s great news! Can you send me the link to your article?”
Empathy. Burnout is prevalent in medicine, and our fellow hospitalists deserve empathy. Showing empathy reduces stress and promotes connectedness. Sense when your colleagues are in distress and take time to share in their feelings and emotions. Draw on your own clinical experience to find common ground and convey understanding.
“I transferred another patient with COVID-19 to the ICU. I spent the last hour talking to family.”
“Ashwin, you’ve had a tough week. I know how you must feel—I had to transfer a patient yesterday. Want to take a quick walk outside?”
Hospitalists are inherently busy while on service, but these four interventions are brief, requiring only several minutes. Each small investment of your time will pay significant emotional dividends. These practices will not only enhance your colleagues’ sense of well-being, but will also bolster your happiness and productivity. A positive mindset fosters creative thinking and enhances complex problem solving. Recharging the microcultures of hospitalist workspaces with positivity will spark a larger transformation at the organizational level. That’s because positive actions are contagious.2 One hospitalist’s commitment to CARE will encourage other hospitalists to adopt these behaviors, establishing a virtuous cycle that sustains an organization’s culture of wellness.
1. Bohman B, Dyrbye L, Sinsky CA, et al. Physician well-being: the reciprocity of practice efficiency, culture of wellness, and personal resilience. NEJM Catalyst. August 7, 2017. Accessed June 24, 2021. https://catalyst.nejm.org/doi/full/10.1056/CAT.17.0429
2. Achor S. The Happiness Advantage: How a Positive Brain Fuels Success in Work and Life. Currency; 2010.
“As we work to create light for others, we naturally light our own way.”
– Mary Anne Radmacher
Perhaps unknowingly, hospitalists establish microcultures in their everyday work. Hospitalists’ interactions with colleagues often occur in the context of shared workspaces. The nature of these seemingly minor exchanges shapes the microculture, often described as the culture shared by a small group based on location within an organization. Hospitalists have an opportunity to cultivate well-being within these microcultures through gracious and thoughtful acknowledgments of their peers. Collegial support at the micro level influences wellness at the organizational level. A larger shared culture of wellness is necessary to nurture physicians’ personal fulfillment and professional development.1
We propose the CARE framework for cultivating well-being within the microcultures of hospital medicine shared workspaces. CARE consists of Capitalization, Active listening, Recognition, and Empathy. This framework is based on positive psychology research and inspired by lessons from The Happiness Advantage by Shawn Achor.2
Capitalization. Capitalization is defined as sharing upbeat news and receiving a positive reaction. Emotional support during good times, more so than during bad times, strengthens relationships. When a peer shares good news, show enthusiasm and counter with an active, constructive response to maximize the validation she perceives.2
For example, Alex sits at her desk and says to Kristen: “
My workshop proposal was accepted for medical education day!” “
Congratulations, Alex! Tell me more about the workshop.”
Active listening. Active listening requires concentration and observation of body language. Show engagement by maintaining an open posture, using positive facial expressions, and providing occasional cues that you’re paying attention. Paraphrasing and asking targeted questions to dive deeper demonstrates genuine interest.
“Katie, I could use your advice. Do you have a minute?”
Katie turns to face John and smiles. “Of course. How can I help?”
“My team seems drained after a code this morning. I planned a lecture for later, but I’m not sure this is the right time.”
Katie nods. “I think you’re right, John. How have you thought about handling the situation?”
Recognition. Acts of recognition and encouragement are catalysts for boosting morale. Even brief expressions of gratitude can have a significant emotional impact. Recognition is most meaningful when delivered deliberately and with warmth.
Kevin walks into the hospitalist workroom. “Diane, congratulations on your publication! I plan to make a medication interaction review part of my discharge workflow.”
Leah turns to Diane. “Diane, that’s great news! Can you send me the link to your article?”
Empathy. Burnout is prevalent in medicine, and our fellow hospitalists deserve empathy. Showing empathy reduces stress and promotes connectedness. Sense when your colleagues are in distress and take time to share in their feelings and emotions. Draw on your own clinical experience to find common ground and convey understanding.
“I transferred another patient with COVID-19 to the ICU. I spent the last hour talking to family.”
“Ashwin, you’ve had a tough week. I know how you must feel—I had to transfer a patient yesterday. Want to take a quick walk outside?”
Hospitalists are inherently busy while on service, but these four interventions are brief, requiring only several minutes. Each small investment of your time will pay significant emotional dividends. These practices will not only enhance your colleagues’ sense of well-being, but will also bolster your happiness and productivity. A positive mindset fosters creative thinking and enhances complex problem solving. Recharging the microcultures of hospitalist workspaces with positivity will spark a larger transformation at the organizational level. That’s because positive actions are contagious.2 One hospitalist’s commitment to CARE will encourage other hospitalists to adopt these behaviors, establishing a virtuous cycle that sustains an organization’s culture of wellness.
1. Bohman B, Dyrbye L, Sinsky CA, et al. Physician well-being: the reciprocity of practice efficiency, culture of wellness, and personal resilience. NEJM Catalyst. August 7, 2017. Accessed June 24, 2021. https://catalyst.nejm.org/doi/full/10.1056/CAT.17.0429
2. Achor S. The Happiness Advantage: How a Positive Brain Fuels Success in Work and Life. Currency; 2010.
© 2021 Society of Hospital Medicine
Algorithms for Prediction of Clinical Deterioration on the General Wards: A Scoping Review
The early identification of clinical deterioration among adult hospitalized patients remains a challenge.1 Delayed identification is associated with increased morbidity and mortality, unplanned intensive care unit (ICU) admissions, prolonged hospitalization, and higher costs.2,3 Earlier detection of deterioration using predictive algorithms of vital sign monitoring might avoid these negative outcomes.4 In this scoping review, we summarize current algorithms and their evidence.
Vital signs provide the backbone for detecting clinical deterioration. Early warning scores (EWS) and outreach protocols were developed to bring structure to the assessment of vital signs. Most EWS claim to predict clinical end points such as unplanned ICU admission up to 24 hours in advance.5,6 Reviews of EWS showed a positive trend toward reduced length of stay and mortality. However, conclusions about general efficacy could not be generated because of case heterogeneity and methodologic shortcomings.4,7 Continuous automated vital sign monitoring of patients on the general ward can now be accomplished with wearable devices.8 The first reports on continuous monitoring showed earlier detection of deterioration but not improved clinical end points.4,9 Since then, different reports on continuous monitoring have shown positive effects but concluded that unprocessed monitoring data per se falls short of generating actionable alarms.4,10,11
Predictive algorithms, which often use artificial intelligence (AI), are increasingly employed to recognize complex patterns or abnormalities and support predictions of events in big data sets.12,13 Especially when combined with continuous vital sign monitoring, predictive algorithms have the potential to expedite detection of clinical deterioration and improve patient outcomes. Predictive algorithms using vital signs in the ICU have shown promising results.14 The impact of predictive algorithms on the general wards, however, is unclear.
The aims of our scoping review were to explore the extent and range of and evidence for predictive vital signs–based algorithms on the adult general ward; to describe the variety of these algorithms; and to categorize effects, facilitators, and barriers of their implementation.15
MATERIALS AND METHODS
We performed a scoping review to create a summary of the current state of research. We used the five-step method of Levac and followed the Preferred Reporting Items for Systematic reviews and Meta-Analyses Extension for Scoping Reviews guidelines (Appendix 1).16,17
PubMed, Embase, and CINAHL databases were searched for English-language articles written between January 1, 2010, and November 20, 2020. We developed the search queries with an experienced information scientist, and we used database-specific terms and strategies for input, clinical outcome, method, predictive capability, and population (Appendix 2). Additionally, we searched the references of the selected articles, as well as publications citing these articles.
All studies identified were screened by title and abstract by two researchers (RP and YE). The selected studies were read in their entirety and checked for eligibility using the following inclusion criteria: automated algorithm; vital signs-based; real-time prediction; of clinical deterioration; in an adult, general ward population. In cases where there were successive publications with the same algorithm and population, we selected the most recent study.
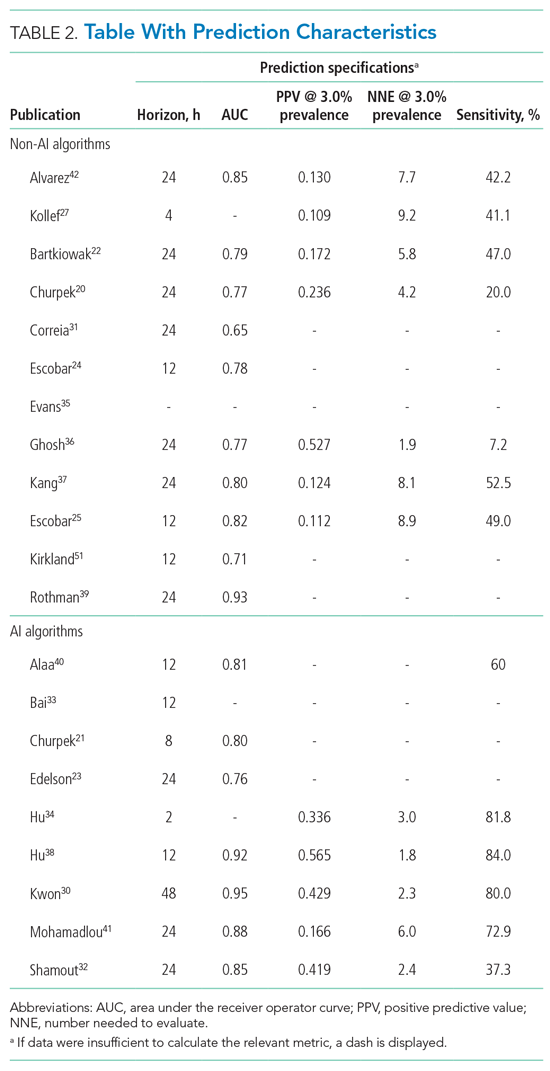
For screening and selection, we used the Rayyan QCRI online tool (Qatar Computing Research Institute) and Endnote X9 (Clarivate Analytics). We extracted information using a data extraction form and organized it into descriptive characteristics of the selected studies (Table 1): an input data table showing number of admissions, intermittent or continuous measurements, vital signs measured, laboratory results (Appendix Table 1), a table summarizing study designs and settings (Appendix Table 2), and a prediction performance table (Table 2). We report characteristics of the populations and algorithms, prediction specifications such as area under the receiver operating curve (AUROC), and predictive values. Predictive values are affected by prevalence, which may differ among populations. To compare the algorithms, we calculated an indexed positive predictive value (PPV) and a number needed to evaluate (NNE) using a weighted average prevalence of clinical deterioration of 3.0%.

We defined clinical deterioration as end points, including rapid response team activation, cardiopulmonary resuscitation, transfer to an ICU, or death.
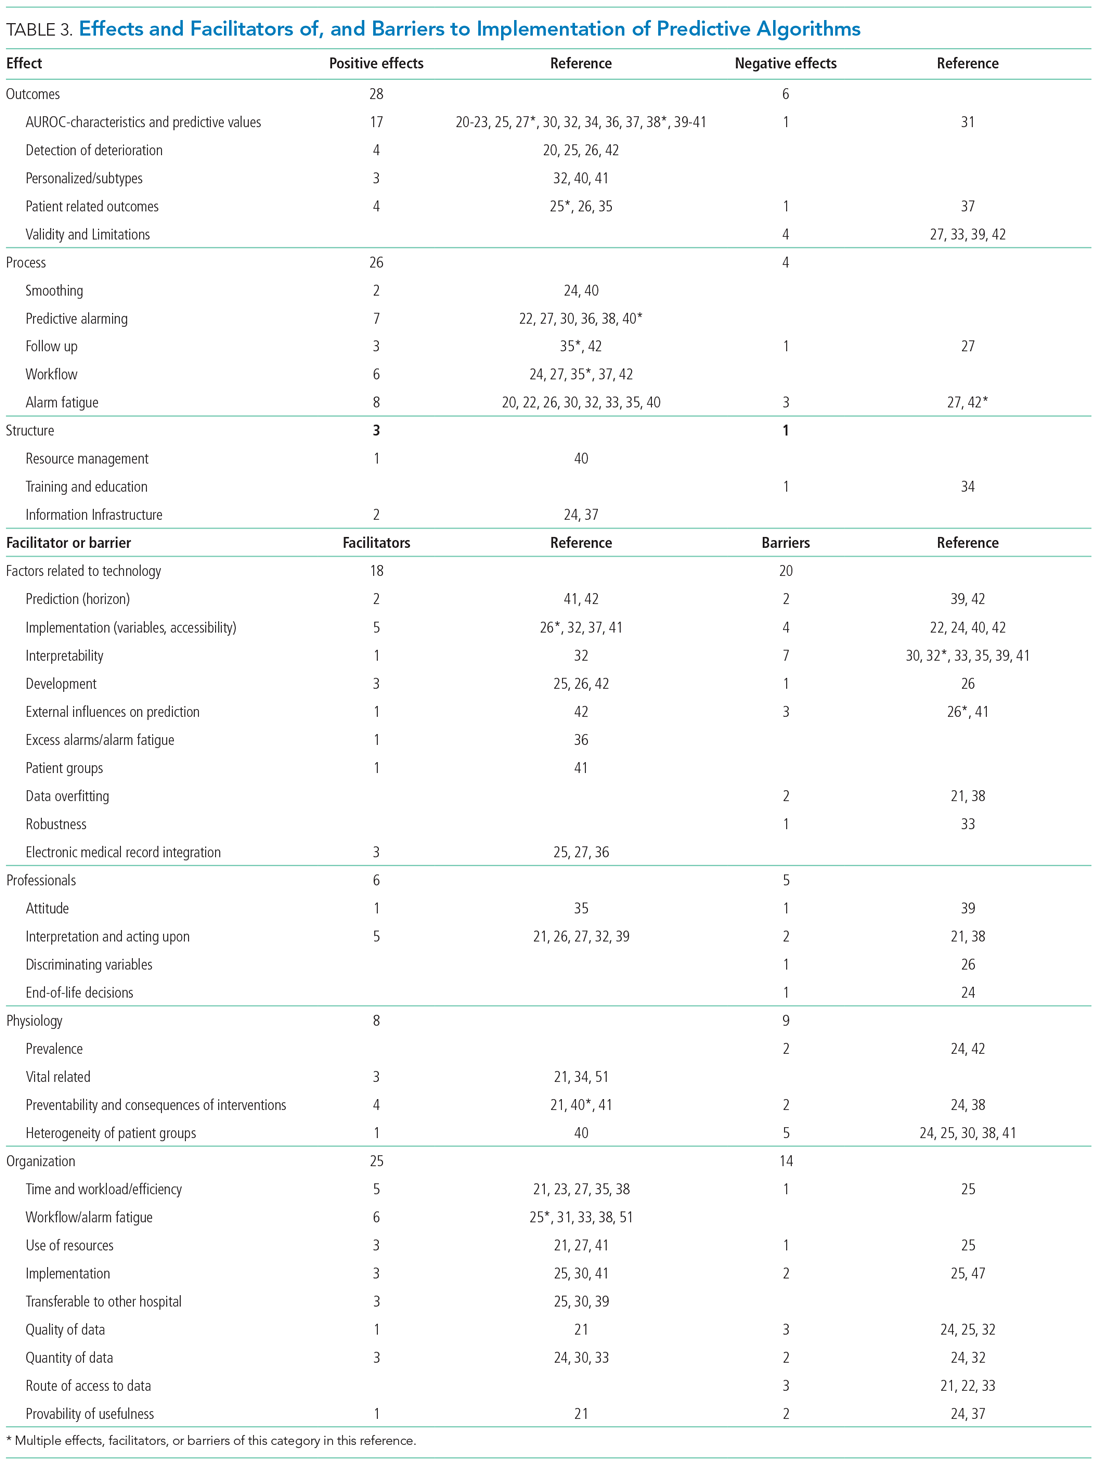
Effects, facilitators, and barriers were identified and categorized using ATLAS.ti 8 software (ATLAS.ti) and evaluated by three researchers (RP, MK, and THvdB). These were categorized using the adapted frameworks of Gagnon et al18 for the barriers and facilitators and of Donabedian19 for the effects (Appendix 3).
The Gagnon et al framework was adapted by changing two of four domains—that is, “Individual” was changed to “Professional” and “Human” to “Physiology.” The domains of “Technology” and “Organization” remained unchanged. The Donabedian domains of “Outcome,” “Process,” and “Structure” also remained unchanged (Table 3).
We divided the studies into two groups: studies on predictive algorithms with and without AI when reporting on characteristics and performance. For the secondary aim of exploring implementation impact, we reported facilitators and barriers in a narrative way, highlighting the most frequent and notable findings.
RESULTS
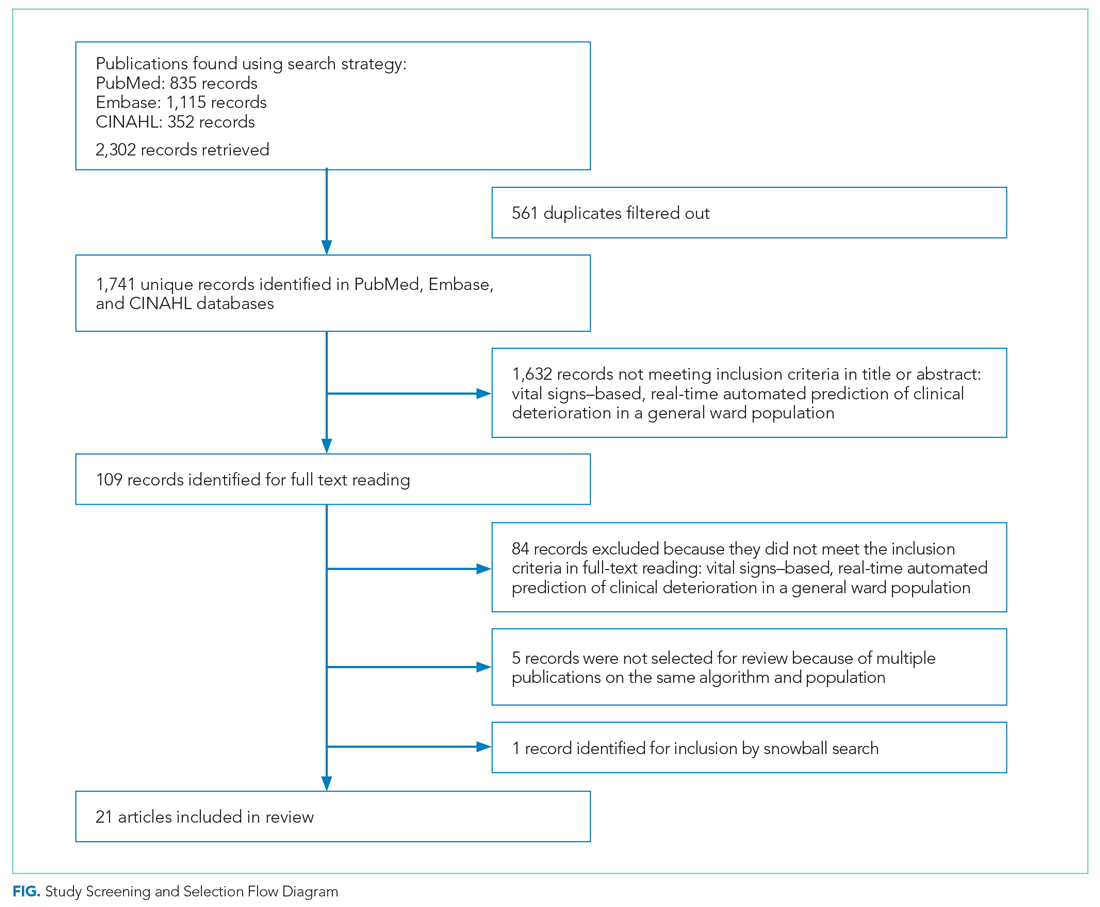
As shown in the Figure, we found 1741 publications, of which we read the full-text of 109. There were 1632 publications that did not meet the inclusion criteria. The publications by Churpek et al,20,21 Bartkiowak et al,22 Edelson et al,23 Escobar et al,24,25 and Kipnis et al26 reported on the same algorithms or databases but had significantly different approaches. For multiple publications using the same algorithm and population, the most recent was named with inclusion of the earlier findings.20,21,27-29 The resulting 21 papers are included in this review.
Descriptive characteristics of the studies are summarized in Table 1. Nineteen of the publications were full papers and two were conference abstracts. Most of the studies (n = 18) were from the United States; there was one study from South Korea,30 one study from Portugal,31 and one study from the United Kingdom.32 In 15 of the studies, there was a strict focus on general or specific wards; 6 studies also included the ICU and/or emergency departments.
Two of the studies were clinical trials, 2 were prospective observational studies, and 17 were retrospective studies. Five studies reported on an active predictive model during admission. Of these, 3 reported that the model was clinically implemented, using the predictions in their clinical workflow. None of the implemented studies used AI.
All input variables are presented in Appendix Table 1.
The non-AI algorithm prediction horizons ranged from 4 to 24 hours, with a median of 24 hours (interquartile range [IQR], 12-24 hours). The AI algorithms ranged from 2 to 48 hours and had a median horizon of 14 hours (IQR, 12-24 hours).
We found three studies reporting patient outcomes. The most recent of these was a large multicenter implementation study by Escobar et al25 that included an extensive follow-up response. This study reported a significantly decreased 30-day mortality in the intervention cohort. A smaller randomized controlled trial reported no significant differences in patient outcomes with earlier warning alarms.27 A third study reported more appropriate rapid response team deployment and decreased mortality in a subgroup analysis.35
Effects, Facilitators, and Barriers
As shown in the Appendix Figure and further detailed in Table 3, the described effects were predominantly positive—57 positive effects vs 11 negative effects. These positive effects sorted primarily into the outcome and process domains.
All of the studies that compared their proposed model with one of various warning systems (eg, EWS, National Early Warning Score [NEWS], Modified Early Warning Score [MEWS]) showed superior performance (based on AUROC and reported predictive values). In 17 studies, the authors reported their model as more useful or superior to the EWS.20-23,26-28,34,36-41 Four studies reported real-time detection of deterioration before regular EWS,20,26,42 and three studies reported positive effects on patient-related outcomes.26,35 Four negative effects were noted on the controllability, validity, and potential limitations.27,42
Of the 38 remarks in the Technology domain, difficulty with implementation in daily practice was a commonly cited barrier.22,24,40,42 Difficulties included creating real-time data feeds out of the EMR, though there were mentions of some successful examples.25,27,36 Difficulty in the interpretability of AI was also considered a potential barrier.30,32,33,35,39,41 There were remarks as to the applicability of the prolonged prediction horizon because of the associated decoupling from the clinical view.39,42
Conservative attitudes toward new technologies and inadequate knowledge were mentioned as barriers.39 Repeated remarks were made on the difficulty of interpreting and responding to a predicted escalation, as the clinical pattern might not be recognizable at such an early stage. On the other hand, it is expected that less invasive countermeasures would be adequate to avert further escalation. Earlier recognition of possible escalations also raised potential ethical questions, such as when to discuss palliative care.24
The heterogeneity of the general ward population and the relatively low prevalence of deterioration were mentioned as barriers.24,30,38,41 There were also concerns that not all escalations are preventable and that some patient outcomes may not be modifiable.24,38
Many investigators expected reductions in false alarms and associated alarm fatigue (reflected as higher PPVs). Furthermore, they expected workflow to improve and workload to decrease.21,23,27,31,33,35,38,41 Despite the capacity of modern EMRs to store large amounts of patient data, some investigators felt improvements to real-time access, data quality and validity, and data density are needed to ensure valid associated predictions.21,22,24,32,37
DISCUSSION
As the complexity and comorbidity of hospitalized adults grow, predicting clinical deterioration is becoming more important. With an ever-increasing amount of available
There are several important limitations across these studies. In a clinical setting, these models would function as a screening test. Almost all studies report an AUROC; however, sensitivity and PPV or NNE (defined as 1/PPV) may be more useful than AUROC when predicting low-frequency events with high-potential clinical impact.44 Assessing the NNE is especially relevant because of its relation to alarm fatigue and responsiveness of clinicians.43 Alarm fatigue and lack of adequate response to alarms were repeatedly cited as potential barriers for application of automated scores.
Although the results of our scoping review are promising, there are limited data on clinical outcomes using these algorithms. Only three of five algorithms were used to guide clinical decision-making.25,27,35 Kollef et al27 showed shorter hospitalizations and Evans et al35 found decreased mortality rates in a multimorbid subgroup. Escobar et al25 found an overall and consistent decrease in mortality in a large, heterogenic population of inpatients across 21 hospitals. While Escobar et al’s findings provide strong evidence that predictive algorithms and structured follow-up on alarms can improve patient outcomes, it recognizes that not all facilities will have the resources to implement them.25 Dedicated round-the-clock follow-up of alarms has yet to be proven feasible for smaller institutions, and leaner solutions must be explored. The example set by Escobar et al25 should be translated into various settings to prove its reproducibility and to substantiate the clinical impact of predictive models and structured follow-up.
According to expert opinion, the use of high-frequency or continuous monitoring at low-acuity wards and AI algorithms to detect trends and patterns will reduce failure-to-rescue rates.4,9,43 However, most studies in our review focused on periodic spot-checked vital signs, and none of the AI algorithms were implemented in clinical care (Appendix Table 1
STRENGTHS AND LIMITATIONS
We performed a comprehensive review of the current literature using a clear and reproducible methodology to minimize the risk of missing relevant publications. The identified research is mainly limited to large US centers and consists of mostly retrospective studies. Heterogeneity among inputs, endpoints, time horizons, and evaluation metrics make comparisons challenging. Comments on facilitators, barriers, and effects were limited.
RECOMMENDATIONS FOR FUTURE RESEARCH
Artificial intelligence and the use of continuous monitoring hold great promise in creating optimal predictive algorithms. Future studies should directly compare AI- and non-AI-based algorithms using continuous monitoring to determine predictive accuracy, feasibility, costs, and outcomes. A consensus on endpoint definitions, input variables, methodology, and reporting is needed to enhance reproducibility, comparability, and generalizability of future research.
CONCLUSION
- van Galen LS, Struik PW, Driesen BEJM, et al. Delayed recognition of deterioration of patients in general wards is mostly caused by human related monitoring failures: a root cause analysis of unplanned ICU admissions. PLoS One. 2016;11(8):e0161393. https://doi.org/10.1371/journal. pone.0161393
- Mardini L, Lipes J, Jayaraman D. Adverse outcomes associated with delayed intensive care consultation in medical and surgical inpatients. J Crit Care. 2012;27(6):688-693. https://doi.org/10.1016/j.jcrc.2012.04.011
- Young MP, Gooder VJ, McBride K, James B, Fisher ES. Inpatient transfers to the intensive care unit: delays are associated with increased mortality and morbidity. J Gen Intern Med. 2003;18(2):77-83. https://doi.org/10.1046/ j.1525-1497.2003.20441.x
- Khanna AK, Hoppe P, Saugel B. Automated continuous noninvasive ward monitoring: future directions and challenges. Crit Care. 2019;23(1):194. https://doi.org/10.1186/s13054-019-2485-7
- Ludikhuize J, Hamming A, de Jonge E, Fikkers BG. Rapid response systems in The Netherlands. Jt Comm J Qual Patient Saf. 2011;37(3):138-197. https:// doi.org/10.1016/s1553-7250(11)37017-1
- Cuthbertson BH, Boroujerdi M, McKie L, Aucott L, Prescott G. Can physiological variables and early warning scoring systems allow early recognition of the deteriorating surgical patient? Crit Care Med. 2007;35(2):402-409. https://doi.org/10.1097/01.ccm.0000254826.10520.87
- Alam N, Hobbelink EL, van Tienhoven AJ, van de Ven PM, Jansma EP, Nanayakkara PWB. The impact of the use of the Early Warning Score (EWS) on patient outcomes: a systematic review. Resuscitation. 2014;85(5):587-594. https://doi.org/10.1016/j.resuscitation.2014.01.013
- Weenk M, Koeneman M, van de Belt TH, Engelen LJLPG, van Goor H, Bredie SJH. Wireless and continuous monitoring of vital signs in patients at the general ward. Resuscitation. 2019;136:47-53. https://doi.org/10.1016/j.resuscitation.2019.01.017
- Cardona-Morrell M, Prgomet M, Turner RM, Nicholson M, Hillman K. Effectiveness of continuous or intermittent vital signs monitoring in preventing adverse events on general wards: a systematic review and meta-analysis. Int J Clin Pract. 2016;70(10):806-824. https://doi.org/10.1111/ijcp.12846
- Brown H, Terrence J, Vasquez P, Bates DW, Zimlichman E. Continuous monitoring in an inpatient medical-surgical unit: a controlled clinical trial. Am J Med. 2014;127(3):226-232. https://doi.org/10.1016/j.amjmed.2013.12.004
- Mestrom E, De Bie A, van de Steeg M, Driessen M, Atallah L, Bezemer R. Implementation of an automated early warning scoring system in a E8 Journal of Hospital Medicine® Published Online June 2021 An Official Publication of the Society of Hospital Medicine Peelen et al | Predicting Deterioration: A Scoping Review surgical ward: practical use and effects on patient outcomes. PLoS One. 2019;14(5):e0213402. https://doi.org/10.1371/journal.pone.0213402
- Jiang F, Jiang Y, Zhi H, et al. Artificial intelligence in healthcare: past, present and future. Stroke Vasc Neurol. 2017;2(4):230-243. https://doi.org/10.1136/ svn-2017-000101
- Iwashyna TJ, Liu V. What’s so different about big data? A primer for clinicians trained to think epidemiologically. Ann Am Thorac Soc. 2014;11(7):1130- 1135. https://doi.org/10.1513/annalsats.201405-185as
- Jalali A, Bender D, Rehman M, Nadkanri V, Nataraj C. Advanced analytics for outcome prediction in intensive care units. Conf Proc IEEE Eng Med Biol Soc. 2016;2016:2520-2524. https://doi.org/10.1109/embc.2016.7591243
- Munn Z, Peters MDJ, Stern C, Tufanaru C, McArthur A, Aromataris E. Systematic review or scoping review? Guidance for authors when choosing between a systematic or scoping review approach. BMC Med Res Methodol. 2018;18(1):143. https://doi.org/10.1186/s12874-018-0611-x
- Arksey H, O’Malley L. Scoping studies: towards a methodological framework. Int J Soc Res Methodol. 2005;8(1):19-32. https://doi.org/10.1080/13645 57032000119616
- Tricco AC, Lillie E, Zarin W, et al. PRISMA extension for scoping reviews (PRISMAScR): checklist and explanation. Ann Intern Med. 2018;169(7):467- 473. https://doi.org/10.7326/m18-0850
- Gagnon MP, Desmartis M, Gagnon J, et al. Framework for user involvement in health technology assessment at the local level: views of health managers, user representatives, and clinicians. Int J Technol Assess Health Care. 2015;31(1-2):68-77. https://doi.org/10.1017/s0266462315000070
- Donabedian A. The quality of care. How can it be assessed? JAMA. 1988;260(12):1743-1748. https://doi.org/10.1001/jama.260.12.1743
- Churpek MM, Yuen TC, Winslow C, et al. Multicenter development and validation of a risk stratification tool for ward patients. Am J Respir Crit Care Med. 2014;190(6):649-655. https://doi.org/10.1164/rccm.201406-1022oc
- Churpek MM, Yuen TC, Winslow C, Meltzer DO, Kattan MW, Edelson DP. Multicenter comparison of machine learning methods and conventional regression for predicting clinical deterioration on the wards. Crit Care Med. 2016;44(2):368-374. https://doi.org/10.1097/ccm.0000000000001571
- Bartkowiak B, Snyder AM, Benjamin A, et al. Validating the electronic cardiac arrest risk triage (eCART) score for risk stratification of surgical inpatients in the postoperative setting: retrospective cohort study. Ann Surg. 2019;269(6):1059-1063. https://doi.org/10.1097/sla.0000000000002665
- Edelson DP, Carey K, Winslow CJ, Churpek MM. Less is more: detecting clinical deterioration in the hospital with machine learning using only age, heart rate and respiratory rate. Abstract presented at: American Thoracic Society International Conference; May 22, 2018; San Diego, California. Am J Resp Crit Care Med. 2018;197:A4444.
- Escobar GJ, LaGuardia JC, Turk BJ, Ragins A, Kipnis P, Draper D. Early detection of impending physiologic deterioration among patients who are not in intensive care: development of predictive models using data from an automated electronic medical record. J Hosp Med. 2012;7(5):388-395. https:// doi.org/10.1002/jhm.1929
- Escobar GJ, Liu VX, Schuler A, Lawson B, Greene JD, Kipnis P. Automated identification of adults at risk for in-hospital clinical deterioration. N Engl J Med. 2020;383(20):1951-1960. https://doi.org/10.1056/nejmsa2001090
- Kipnis P, Turk BJ, Wulf DA, et al. Development and validation of an electronic medical record-based alert score for detection of inpatient deterioration outside the ICU. J Biomed Inform. 2016;64:10-19. https://doi.org/10.1016/j. jbi.2016.09.013
- Kollef MH, Chen Y, Heard K, et al. A randomized trial of real-time automated clinical deterioration alerts sent to a rapid response team. J Hosp Med. 2014;9(7):424-429. https://doi.org/10.1002/jhm.2193
- Hackmann G, Chen M, Chipara O, et al. Toward a two-tier clinical warning system for hospitalized patients. AMIA Annu Symp Proc. 2011;2011:511-519.
- Bailey TC, Chen Y, Mao Y, Lu, C, Hackmann G, Micek ST. A trial of a real-time alert for clinical deterioration in patients hospitalized on general medical wards. J Hosp Med. 2013;8(5):236-242. https://doi.org/10.1002/jhm.2009
- Kwon JM, Lee Y, Lee Y, Lee S, Park J. An algorithm based on deep learning for predicting in-hospital cardiac arrest. J Am Heart Assoc. 2018;7(13):e008678. https://doi.org/10.1161/jaha.118.008678
- Correia S, Gomes A, Shahriari S, Almeida JP, Severo M, Azevedo A. Performance of the early warning system vital to predict unanticipated higher-level of care admission and in-hospital death of ward patients. Value Health. 2018;21(S3):S360. https://doi.org/10.1016/j.jval.2018.09.2152
- Shamout FE, Zhu T, Sharma P, Watkinson PJ, Clifton DA. Deep interpretable early warning system for the detection of clinical deterioration. IEEE J Biomed Health Inform. 2020;24(2):437-446. https://doi.org/10.1109/ jbhi.2019.2937803
- Bai Y, Do DH, Harris PRE, et al. Integrating monitor alarms with laboratory test results to enhance patient deterioration prediction. J Biomed Inform. 2015;53:81-92. https://doi.org/10.1016/j.jbi.2014.09.006
- Hu X, Sapo M, Nenov V, et al. Predictive combinations of monitor alarms preceding in-hospital code blue events. J Biomed Inform. 2012;45(5):913-921. https://doi.org/10.1016/j.jbi.2012.03.001
- Evans RS, Kuttler KG, Simpson KJ, et al. Automated detection of physiologic deterioration in hospitalized patients. J Am Med Inform Assoc. 2015;22(2):350-360. https://doi.org/10.1136/amiajnl-2014-002816
- Ghosh E, Eshelman L, Yang L, Carlson E, Lord B. Early deterioration indicator: data-driven approach to detecting deterioration in general ward. Resuscitation. 2018;122:99-105. https://doi.org/10.1016/j.resuscitation. 2017.10.026
- Kang MA, Churpek MM, Zadravecz FJ, Adhikari R, Twu NM, Edelson DP: Real-time risk prediction on the wards: a feasibility study. Crit Care Med. 2016;44(8):1468-1473. https://doi.org/10.1097/ccm.0000000000001716
- Hu SB, Wong DJL, Correa A, Li N, Deng JC. Prediction of clinical deterioration in hospitalized adult patients with hematologic malignancies using a neural network model. PLoS One. 2016;11(8):e0161401. https://doi. org/10.1371/journal.pone.0161401
- Rothman MJ, Rothman SI, Beals J 4th. Development and validation of a continuous measure of patient condition using the electronic medical record. J Biomed Inform. 2013;46(5):837-848. https://doi.org/10.1016/j. jbi.2013.06.011
- Alaa AM, Yoon J, Hu S, van der Schaar M. Personalized risk scoring for critical care prognosis using mixtures of Gaussian processes. IEEE Trans Biomed Eng. 2018;65(1):207-218. https://doi.org/10.1109/tbme.2017.2698602
- Mohamadlou H, Panchavati S, Calvert J, et al. Multicenter validation of a machine-learning algorithm for 48-h all-cause mortality prediction. Health Informatics J. 2020;26(3):1912-1925. https://doi.org/10.1177/1460458219894494
- Alvarez CA, Clark CA, Zhang S, et al. Predicting out of intensive care unit cardiopulmonary arrest or death using electronic medical record data. BMC Med Inform Decis Mak. 2013;13:28. https://doi.org/10.1186/1472-6947-13-28
- Vincent JL, Einav S, Pearse R, et al. Improving detection of patient deterioration in the general hospital ward environment. Eur J Anaesthesiol. 2018;35(5):325-333. https://doi.org/10.1097/eja.0000000000000798
- Romero-Brufau S, Huddleston JM, Escobar GJ, Liebow M. Why the C-statistic is not informative to evaluate early warning scores and what metrics to use. Crit Care. 2015;19(1):285. https://doi.org/10.1186/s13054-015-0999-1
- Weenk M, Bredie SJ, Koeneman M, Hesselink G, van Goor H, van de Belt TH. Continuous monitoring of the vital signs in the general ward using wearable devices: randomized controlled trial. J Med Internet Res. 2020;22(6):e15471. https://doi.org/10.2196/15471
- Wellner B, Grand J, Canzone E, et al. Predicting unplanned transfers to the intensive care unit: a machine learning approach leveraging diverse clinical elements. JMIR Med Inform. 2017;5(4):e45. https://doi.org/10.2196/medinform.8680
- Elliott M, Baird J. Pulse oximetry and the enduring neglect of respiratory rate assessment: a commentary on patient surveillance. Br J Nurs. 2019;28(19):1256-1259. https://doi.org/10.12968/bjon.2019.28.19.1256
- Blackwell JN, Keim-Malpass J, Clark MT, et al. Early detection of in-patient deterioration: one prediction model does not fit all. Crit Care Explor. 2020;2(5):e0116. https://doi.org/10.1097/cce.0000000000000116
- Johnson AEW, Pollard TJ, Shen L, et al. MIMIC-III, a freely accessible critical care database. Sci Data. 2016;3:160035. https://doi.org/10.1038/sdata.2016.35
- Bodenheimer T, Sinsky C. From triple to quadruple aim: care of the patient requires care of the provider. Ann Fam Med. 2014;12(6):573-576. https://doi. org/10.1370/afm.1713
- Kirkland LL, Malinchoc M, O’Byrne M, et al. A clinical deterioration prediction tool for internal medicine patients. Am J Med Qual. 2013;28(2):135-142 https://doi.org/10.1177/1062860612450459
The early identification of clinical deterioration among adult hospitalized patients remains a challenge.1 Delayed identification is associated with increased morbidity and mortality, unplanned intensive care unit (ICU) admissions, prolonged hospitalization, and higher costs.2,3 Earlier detection of deterioration using predictive algorithms of vital sign monitoring might avoid these negative outcomes.4 In this scoping review, we summarize current algorithms and their evidence.
Vital signs provide the backbone for detecting clinical deterioration. Early warning scores (EWS) and outreach protocols were developed to bring structure to the assessment of vital signs. Most EWS claim to predict clinical end points such as unplanned ICU admission up to 24 hours in advance.5,6 Reviews of EWS showed a positive trend toward reduced length of stay and mortality. However, conclusions about general efficacy could not be generated because of case heterogeneity and methodologic shortcomings.4,7 Continuous automated vital sign monitoring of patients on the general ward can now be accomplished with wearable devices.8 The first reports on continuous monitoring showed earlier detection of deterioration but not improved clinical end points.4,9 Since then, different reports on continuous monitoring have shown positive effects but concluded that unprocessed monitoring data per se falls short of generating actionable alarms.4,10,11
Predictive algorithms, which often use artificial intelligence (AI), are increasingly employed to recognize complex patterns or abnormalities and support predictions of events in big data sets.12,13 Especially when combined with continuous vital sign monitoring, predictive algorithms have the potential to expedite detection of clinical deterioration and improve patient outcomes. Predictive algorithms using vital signs in the ICU have shown promising results.14 The impact of predictive algorithms on the general wards, however, is unclear.
The aims of our scoping review were to explore the extent and range of and evidence for predictive vital signs–based algorithms on the adult general ward; to describe the variety of these algorithms; and to categorize effects, facilitators, and barriers of their implementation.15
MATERIALS AND METHODS
We performed a scoping review to create a summary of the current state of research. We used the five-step method of Levac and followed the Preferred Reporting Items for Systematic reviews and Meta-Analyses Extension for Scoping Reviews guidelines (Appendix 1).16,17
PubMed, Embase, and CINAHL databases were searched for English-language articles written between January 1, 2010, and November 20, 2020. We developed the search queries with an experienced information scientist, and we used database-specific terms and strategies for input, clinical outcome, method, predictive capability, and population (Appendix 2). Additionally, we searched the references of the selected articles, as well as publications citing these articles.
All studies identified were screened by title and abstract by two researchers (RP and YE). The selected studies were read in their entirety and checked for eligibility using the following inclusion criteria: automated algorithm; vital signs-based; real-time prediction; of clinical deterioration; in an adult, general ward population. In cases where there were successive publications with the same algorithm and population, we selected the most recent study.
For screening and selection, we used the Rayyan QCRI online tool (Qatar Computing Research Institute) and Endnote X9 (Clarivate Analytics). We extracted information using a data extraction form and organized it into descriptive characteristics of the selected studies (Table 1): an input data table showing number of admissions, intermittent or continuous measurements, vital signs measured, laboratory results (Appendix Table 1), a table summarizing study designs and settings (Appendix Table 2), and a prediction performance table (Table 2). We report characteristics of the populations and algorithms, prediction specifications such as area under the receiver operating curve (AUROC), and predictive values. Predictive values are affected by prevalence, which may differ among populations. To compare the algorithms, we calculated an indexed positive predictive value (PPV) and a number needed to evaluate (NNE) using a weighted average prevalence of clinical deterioration of 3.0%.
We defined clinical deterioration as end points, including rapid response team activation, cardiopulmonary resuscitation, transfer to an ICU, or death.
Effects, facilitators, and barriers were identified and categorized using ATLAS.ti 8 software (ATLAS.ti) and evaluated by three researchers (RP, MK, and THvdB). These were categorized using the adapted frameworks of Gagnon et al18 for the barriers and facilitators and of Donabedian19 for the effects (Appendix 3).
The Gagnon et al framework was adapted by changing two of four domains—that is, “Individual” was changed to “Professional” and “Human” to “Physiology.” The domains of “Technology” and “Organization” remained unchanged. The Donabedian domains of “Outcome,” “Process,” and “Structure” also remained unchanged (Table 3).
We divided the studies into two groups: studies on predictive algorithms with and without AI when reporting on characteristics and performance. For the secondary aim of exploring implementation impact, we reported facilitators and barriers in a narrative way, highlighting the most frequent and notable findings.
RESULTS
As shown in the Figure, we found 1741 publications, of which we read the full-text of 109. There were 1632 publications that did not meet the inclusion criteria. The publications by Churpek et al,20,21 Bartkiowak et al,22 Edelson et al,23 Escobar et al,24,25 and Kipnis et al26 reported on the same algorithms or databases but had significantly different approaches. For multiple publications using the same algorithm and population, the most recent was named with inclusion of the earlier findings.20,21,27-29 The resulting 21 papers are included in this review.
Descriptive characteristics of the studies are summarized in Table 1. Nineteen of the publications were full papers and two were conference abstracts. Most of the studies (n = 18) were from the United States; there was one study from South Korea,30 one study from Portugal,31 and one study from the United Kingdom.32 In 15 of the studies, there was a strict focus on general or specific wards; 6 studies also included the ICU and/or emergency departments.
Two of the studies were clinical trials, 2 were prospective observational studies, and 17 were retrospective studies. Five studies reported on an active predictive model during admission. Of these, 3 reported that the model was clinically implemented, using the predictions in their clinical workflow. None of the implemented studies used AI.
All input variables are presented in Appendix Table 1.
The non-AI algorithm prediction horizons ranged from 4 to 24 hours, with a median of 24 hours (interquartile range [IQR], 12-24 hours). The AI algorithms ranged from 2 to 48 hours and had a median horizon of 14 hours (IQR, 12-24 hours).
We found three studies reporting patient outcomes. The most recent of these was a large multicenter implementation study by Escobar et al25 that included an extensive follow-up response. This study reported a significantly decreased 30-day mortality in the intervention cohort. A smaller randomized controlled trial reported no significant differences in patient outcomes with earlier warning alarms.27 A third study reported more appropriate rapid response team deployment and decreased mortality in a subgroup analysis.35
Effects, Facilitators, and Barriers
As shown in the Appendix Figure and further detailed in Table 3, the described effects were predominantly positive—57 positive effects vs 11 negative effects. These positive effects sorted primarily into the outcome and process domains.
All of the studies that compared their proposed model with one of various warning systems (eg, EWS, National Early Warning Score [NEWS], Modified Early Warning Score [MEWS]) showed superior performance (based on AUROC and reported predictive values). In 17 studies, the authors reported their model as more useful or superior to the EWS.20-23,26-28,34,36-41 Four studies reported real-time detection of deterioration before regular EWS,20,26,42 and three studies reported positive effects on patient-related outcomes.26,35 Four negative effects were noted on the controllability, validity, and potential limitations.27,42
Of the 38 remarks in the Technology domain, difficulty with implementation in daily practice was a commonly cited barrier.22,24,40,42 Difficulties included creating real-time data feeds out of the EMR, though there were mentions of some successful examples.25,27,36 Difficulty in the interpretability of AI was also considered a potential barrier.30,32,33,35,39,41 There were remarks as to the applicability of the prolonged prediction horizon because of the associated decoupling from the clinical view.39,42
Conservative attitudes toward new technologies and inadequate knowledge were mentioned as barriers.39 Repeated remarks were made on the difficulty of interpreting and responding to a predicted escalation, as the clinical pattern might not be recognizable at such an early stage. On the other hand, it is expected that less invasive countermeasures would be adequate to avert further escalation. Earlier recognition of possible escalations also raised potential ethical questions, such as when to discuss palliative care.24
The heterogeneity of the general ward population and the relatively low prevalence of deterioration were mentioned as barriers.24,30,38,41 There were also concerns that not all escalations are preventable and that some patient outcomes may not be modifiable.24,38
Many investigators expected reductions in false alarms and associated alarm fatigue (reflected as higher PPVs). Furthermore, they expected workflow to improve and workload to decrease.21,23,27,31,33,35,38,41 Despite the capacity of modern EMRs to store large amounts of patient data, some investigators felt improvements to real-time access, data quality and validity, and data density are needed to ensure valid associated predictions.21,22,24,32,37
DISCUSSION
As the complexity and comorbidity of hospitalized adults grow, predicting clinical deterioration is becoming more important. With an ever-increasing amount of available
There are several important limitations across these studies. In a clinical setting, these models would function as a screening test. Almost all studies report an AUROC; however, sensitivity and PPV or NNE (defined as 1/PPV) may be more useful than AUROC when predicting low-frequency events with high-potential clinical impact.44 Assessing the NNE is especially relevant because of its relation to alarm fatigue and responsiveness of clinicians.43 Alarm fatigue and lack of adequate response to alarms were repeatedly cited as potential barriers for application of automated scores.
Although the results of our scoping review are promising, there are limited data on clinical outcomes using these algorithms. Only three of five algorithms were used to guide clinical decision-making.25,27,35 Kollef et al27 showed shorter hospitalizations and Evans et al35 found decreased mortality rates in a multimorbid subgroup. Escobar et al25 found an overall and consistent decrease in mortality in a large, heterogenic population of inpatients across 21 hospitals. While Escobar et al’s findings provide strong evidence that predictive algorithms and structured follow-up on alarms can improve patient outcomes, it recognizes that not all facilities will have the resources to implement them.25 Dedicated round-the-clock follow-up of alarms has yet to be proven feasible for smaller institutions, and leaner solutions must be explored. The example set by Escobar et al25 should be translated into various settings to prove its reproducibility and to substantiate the clinical impact of predictive models and structured follow-up.
According to expert opinion, the use of high-frequency or continuous monitoring at low-acuity wards and AI algorithms to detect trends and patterns will reduce failure-to-rescue rates.4,9,43 However, most studies in our review focused on periodic spot-checked vital signs, and none of the AI algorithms were implemented in clinical care (Appendix Table 1
STRENGTHS AND LIMITATIONS
We performed a comprehensive review of the current literature using a clear and reproducible methodology to minimize the risk of missing relevant publications. The identified research is mainly limited to large US centers and consists of mostly retrospective studies. Heterogeneity among inputs, endpoints, time horizons, and evaluation metrics make comparisons challenging. Comments on facilitators, barriers, and effects were limited.
RECOMMENDATIONS FOR FUTURE RESEARCH
Artificial intelligence and the use of continuous monitoring hold great promise in creating optimal predictive algorithms. Future studies should directly compare AI- and non-AI-based algorithms using continuous monitoring to determine predictive accuracy, feasibility, costs, and outcomes. A consensus on endpoint definitions, input variables, methodology, and reporting is needed to enhance reproducibility, comparability, and generalizability of future research.
CONCLUSION
- van Galen LS, Struik PW, Driesen BEJM, et al. Delayed recognition of deterioration of patients in general wards is mostly caused by human related monitoring failures: a root cause analysis of unplanned ICU admissions. PLoS One. 2016;11(8):e0161393. https://doi.org/10.1371/journal. pone.0161393
- Mardini L, Lipes J, Jayaraman D. Adverse outcomes associated with delayed intensive care consultation in medical and surgical inpatients. J Crit Care. 2012;27(6):688-693. https://doi.org/10.1016/j.jcrc.2012.04.011
- Young MP, Gooder VJ, McBride K, James B, Fisher ES. Inpatient transfers to the intensive care unit: delays are associated with increased mortality and morbidity. J Gen Intern Med. 2003;18(2):77-83. https://doi.org/10.1046/ j.1525-1497.2003.20441.x
- Khanna AK, Hoppe P, Saugel B. Automated continuous noninvasive ward monitoring: future directions and challenges. Crit Care. 2019;23(1):194. https://doi.org/10.1186/s13054-019-2485-7
- Ludikhuize J, Hamming A, de Jonge E, Fikkers BG. Rapid response systems in The Netherlands. Jt Comm J Qual Patient Saf. 2011;37(3):138-197. https:// doi.org/10.1016/s1553-7250(11)37017-1
- Cuthbertson BH, Boroujerdi M, McKie L, Aucott L, Prescott G. Can physiological variables and early warning scoring systems allow early recognition of the deteriorating surgical patient? Crit Care Med. 2007;35(2):402-409. https://doi.org/10.1097/01.ccm.0000254826.10520.87
- Alam N, Hobbelink EL, van Tienhoven AJ, van de Ven PM, Jansma EP, Nanayakkara PWB. The impact of the use of the Early Warning Score (EWS) on patient outcomes: a systematic review. Resuscitation. 2014;85(5):587-594. https://doi.org/10.1016/j.resuscitation.2014.01.013
- Weenk M, Koeneman M, van de Belt TH, Engelen LJLPG, van Goor H, Bredie SJH. Wireless and continuous monitoring of vital signs in patients at the general ward. Resuscitation. 2019;136:47-53. https://doi.org/10.1016/j.resuscitation.2019.01.017
- Cardona-Morrell M, Prgomet M, Turner RM, Nicholson M, Hillman K. Effectiveness of continuous or intermittent vital signs monitoring in preventing adverse events on general wards: a systematic review and meta-analysis. Int J Clin Pract. 2016;70(10):806-824. https://doi.org/10.1111/ijcp.12846
- Brown H, Terrence J, Vasquez P, Bates DW, Zimlichman E. Continuous monitoring in an inpatient medical-surgical unit: a controlled clinical trial. Am J Med. 2014;127(3):226-232. https://doi.org/10.1016/j.amjmed.2013.12.004
- Mestrom E, De Bie A, van de Steeg M, Driessen M, Atallah L, Bezemer R. Implementation of an automated early warning scoring system in a E8 Journal of Hospital Medicine® Published Online June 2021 An Official Publication of the Society of Hospital Medicine Peelen et al | Predicting Deterioration: A Scoping Review surgical ward: practical use and effects on patient outcomes. PLoS One. 2019;14(5):e0213402. https://doi.org/10.1371/journal.pone.0213402
- Jiang F, Jiang Y, Zhi H, et al. Artificial intelligence in healthcare: past, present and future. Stroke Vasc Neurol. 2017;2(4):230-243. https://doi.org/10.1136/ svn-2017-000101
- Iwashyna TJ, Liu V. What’s so different about big data? A primer for clinicians trained to think epidemiologically. Ann Am Thorac Soc. 2014;11(7):1130- 1135. https://doi.org/10.1513/annalsats.201405-185as
- Jalali A, Bender D, Rehman M, Nadkanri V, Nataraj C. Advanced analytics for outcome prediction in intensive care units. Conf Proc IEEE Eng Med Biol Soc. 2016;2016:2520-2524. https://doi.org/10.1109/embc.2016.7591243
- Munn Z, Peters MDJ, Stern C, Tufanaru C, McArthur A, Aromataris E. Systematic review or scoping review? Guidance for authors when choosing between a systematic or scoping review approach. BMC Med Res Methodol. 2018;18(1):143. https://doi.org/10.1186/s12874-018-0611-x
- Arksey H, O’Malley L. Scoping studies: towards a methodological framework. Int J Soc Res Methodol. 2005;8(1):19-32. https://doi.org/10.1080/13645 57032000119616
- Tricco AC, Lillie E, Zarin W, et al. PRISMA extension for scoping reviews (PRISMAScR): checklist and explanation. Ann Intern Med. 2018;169(7):467- 473. https://doi.org/10.7326/m18-0850
- Gagnon MP, Desmartis M, Gagnon J, et al. Framework for user involvement in health technology assessment at the local level: views of health managers, user representatives, and clinicians. Int J Technol Assess Health Care. 2015;31(1-2):68-77. https://doi.org/10.1017/s0266462315000070
- Donabedian A. The quality of care. How can it be assessed? JAMA. 1988;260(12):1743-1748. https://doi.org/10.1001/jama.260.12.1743
- Churpek MM, Yuen TC, Winslow C, et al. Multicenter development and validation of a risk stratification tool for ward patients. Am J Respir Crit Care Med. 2014;190(6):649-655. https://doi.org/10.1164/rccm.201406-1022oc
- Churpek MM, Yuen TC, Winslow C, Meltzer DO, Kattan MW, Edelson DP. Multicenter comparison of machine learning methods and conventional regression for predicting clinical deterioration on the wards. Crit Care Med. 2016;44(2):368-374. https://doi.org/10.1097/ccm.0000000000001571
- Bartkowiak B, Snyder AM, Benjamin A, et al. Validating the electronic cardiac arrest risk triage (eCART) score for risk stratification of surgical inpatients in the postoperative setting: retrospective cohort study. Ann Surg. 2019;269(6):1059-1063. https://doi.org/10.1097/sla.0000000000002665
- Edelson DP, Carey K, Winslow CJ, Churpek MM. Less is more: detecting clinical deterioration in the hospital with machine learning using only age, heart rate and respiratory rate. Abstract presented at: American Thoracic Society International Conference; May 22, 2018; San Diego, California. Am J Resp Crit Care Med. 2018;197:A4444.
- Escobar GJ, LaGuardia JC, Turk BJ, Ragins A, Kipnis P, Draper D. Early detection of impending physiologic deterioration among patients who are not in intensive care: development of predictive models using data from an automated electronic medical record. J Hosp Med. 2012;7(5):388-395. https:// doi.org/10.1002/jhm.1929
- Escobar GJ, Liu VX, Schuler A, Lawson B, Greene JD, Kipnis P. Automated identification of adults at risk for in-hospital clinical deterioration. N Engl J Med. 2020;383(20):1951-1960. https://doi.org/10.1056/nejmsa2001090
- Kipnis P, Turk BJ, Wulf DA, et al. Development and validation of an electronic medical record-based alert score for detection of inpatient deterioration outside the ICU. J Biomed Inform. 2016;64:10-19. https://doi.org/10.1016/j. jbi.2016.09.013
- Kollef MH, Chen Y, Heard K, et al. A randomized trial of real-time automated clinical deterioration alerts sent to a rapid response team. J Hosp Med. 2014;9(7):424-429. https://doi.org/10.1002/jhm.2193
- Hackmann G, Chen M, Chipara O, et al. Toward a two-tier clinical warning system for hospitalized patients. AMIA Annu Symp Proc. 2011;2011:511-519.
- Bailey TC, Chen Y, Mao Y, Lu, C, Hackmann G, Micek ST. A trial of a real-time alert for clinical deterioration in patients hospitalized on general medical wards. J Hosp Med. 2013;8(5):236-242. https://doi.org/10.1002/jhm.2009
- Kwon JM, Lee Y, Lee Y, Lee S, Park J. An algorithm based on deep learning for predicting in-hospital cardiac arrest. J Am Heart Assoc. 2018;7(13):e008678. https://doi.org/10.1161/jaha.118.008678
- Correia S, Gomes A, Shahriari S, Almeida JP, Severo M, Azevedo A. Performance of the early warning system vital to predict unanticipated higher-level of care admission and in-hospital death of ward patients. Value Health. 2018;21(S3):S360. https://doi.org/10.1016/j.jval.2018.09.2152
- Shamout FE, Zhu T, Sharma P, Watkinson PJ, Clifton DA. Deep interpretable early warning system for the detection of clinical deterioration. IEEE J Biomed Health Inform. 2020;24(2):437-446. https://doi.org/10.1109/ jbhi.2019.2937803
- Bai Y, Do DH, Harris PRE, et al. Integrating monitor alarms with laboratory test results to enhance patient deterioration prediction. J Biomed Inform. 2015;53:81-92. https://doi.org/10.1016/j.jbi.2014.09.006
- Hu X, Sapo M, Nenov V, et al. Predictive combinations of monitor alarms preceding in-hospital code blue events. J Biomed Inform. 2012;45(5):913-921. https://doi.org/10.1016/j.jbi.2012.03.001
- Evans RS, Kuttler KG, Simpson KJ, et al. Automated detection of physiologic deterioration in hospitalized patients. J Am Med Inform Assoc. 2015;22(2):350-360. https://doi.org/10.1136/amiajnl-2014-002816
- Ghosh E, Eshelman L, Yang L, Carlson E, Lord B. Early deterioration indicator: data-driven approach to detecting deterioration in general ward. Resuscitation. 2018;122:99-105. https://doi.org/10.1016/j.resuscitation. 2017.10.026
- Kang MA, Churpek MM, Zadravecz FJ, Adhikari R, Twu NM, Edelson DP: Real-time risk prediction on the wards: a feasibility study. Crit Care Med. 2016;44(8):1468-1473. https://doi.org/10.1097/ccm.0000000000001716
- Hu SB, Wong DJL, Correa A, Li N, Deng JC. Prediction of clinical deterioration in hospitalized adult patients with hematologic malignancies using a neural network model. PLoS One. 2016;11(8):e0161401. https://doi. org/10.1371/journal.pone.0161401
- Rothman MJ, Rothman SI, Beals J 4th. Development and validation of a continuous measure of patient condition using the electronic medical record. J Biomed Inform. 2013;46(5):837-848. https://doi.org/10.1016/j. jbi.2013.06.011
- Alaa AM, Yoon J, Hu S, van der Schaar M. Personalized risk scoring for critical care prognosis using mixtures of Gaussian processes. IEEE Trans Biomed Eng. 2018;65(1):207-218. https://doi.org/10.1109/tbme.2017.2698602
- Mohamadlou H, Panchavati S, Calvert J, et al. Multicenter validation of a machine-learning algorithm for 48-h all-cause mortality prediction. Health Informatics J. 2020;26(3):1912-1925. https://doi.org/10.1177/1460458219894494
- Alvarez CA, Clark CA, Zhang S, et al. Predicting out of intensive care unit cardiopulmonary arrest or death using electronic medical record data. BMC Med Inform Decis Mak. 2013;13:28. https://doi.org/10.1186/1472-6947-13-28
- Vincent JL, Einav S, Pearse R, et al. Improving detection of patient deterioration in the general hospital ward environment. Eur J Anaesthesiol. 2018;35(5):325-333. https://doi.org/10.1097/eja.0000000000000798
- Romero-Brufau S, Huddleston JM, Escobar GJ, Liebow M. Why the C-statistic is not informative to evaluate early warning scores and what metrics to use. Crit Care. 2015;19(1):285. https://doi.org/10.1186/s13054-015-0999-1
- Weenk M, Bredie SJ, Koeneman M, Hesselink G, van Goor H, van de Belt TH. Continuous monitoring of the vital signs in the general ward using wearable devices: randomized controlled trial. J Med Internet Res. 2020;22(6):e15471. https://doi.org/10.2196/15471
- Wellner B, Grand J, Canzone E, et al. Predicting unplanned transfers to the intensive care unit: a machine learning approach leveraging diverse clinical elements. JMIR Med Inform. 2017;5(4):e45. https://doi.org/10.2196/medinform.8680
- Elliott M, Baird J. Pulse oximetry and the enduring neglect of respiratory rate assessment: a commentary on patient surveillance. Br J Nurs. 2019;28(19):1256-1259. https://doi.org/10.12968/bjon.2019.28.19.1256
- Blackwell JN, Keim-Malpass J, Clark MT, et al. Early detection of in-patient deterioration: one prediction model does not fit all. Crit Care Explor. 2020;2(5):e0116. https://doi.org/10.1097/cce.0000000000000116
- Johnson AEW, Pollard TJ, Shen L, et al. MIMIC-III, a freely accessible critical care database. Sci Data. 2016;3:160035. https://doi.org/10.1038/sdata.2016.35
- Bodenheimer T, Sinsky C. From triple to quadruple aim: care of the patient requires care of the provider. Ann Fam Med. 2014;12(6):573-576. https://doi. org/10.1370/afm.1713
- Kirkland LL, Malinchoc M, O’Byrne M, et al. A clinical deterioration prediction tool for internal medicine patients. Am J Med Qual. 2013;28(2):135-142 https://doi.org/10.1177/1062860612450459
Reducing Overuse of Proton Pump Inhibitors for Stress Ulcer Prophylaxis and Nonvariceal Gastrointestinal Bleeding in the Hospital: A Narrative Review and Implementation Guide
Proton pump inhibitors (PPIs) are among the most commonly used drugs worldwide to treat dyspepsia and prevent gastrointestinal bleeding (GIB).1 Between 40% and 70% of hospitalized patients receive acid-suppressive therapy (AST; defined as PPIs or histamine-receptor antagonists), and nearly half of these are initiated during the inpatient stay.2,3 While up to 50% of inpatients who received a new AST were discharged on these medications,2 there were no evidence-based indications for a majority of the prescriptions.2,3
Growing evidence shows that PPIs are overutilized and may be associated with wide-ranging adverse events, such as acute and chronic kidney disease,4Clostridium difficile infection,5 hypomagnesemia,6 and fractures.7 Because of the widespread overuse and the potential harm associated with PPIs, a concerted effort to promote their appropriate use in the inpatient setting is necessary. It is important to note that reducing the use of PPIs does not increase the risks of GIB or worsening dyspepsia. Rather, reducing overuse of PPIs lowers the risk of harm to patients. The efforts to reduce overuse, however, are complex and difficult.
This article summarizes evidence regarding interventions to reduce overuse and offers an implementation guide based on this evidence. This guide promotes value-based quality improvement and provides a blueprint for implementing an institution-wide program to reduce PPI overuse in the inpatient setting. We begin with a discussion about quality initiatives to reduce PPI overuse, followed by a review of the safety outcomes associated with reduced use of PPIs.
METHODS
A focused search of the US National Library of Medicine’s PubMed database was performed to identify English-language articles published between 2000 and 2018 that addressed strategies to reduce PPI overuse for stress ulcer prophylaxis (SUP) and nonvariceal GIB. The following search terms were used: PPI and inappropriate use; acid-suppressive therapy and inappropriate use; PPI and discontinuation; acid-suppressive (or suppressant) therapy and discontinuation; SUP and cost; and histamine receptor antagonist and PPI. Inpatient or outpatient studies of patients aged 18 years or older were considered for inclusion in this narrative review, and all study types were included. The primary exclusion criterion was patients aged younger than 18 years. A manual review of the full text of the retrieved articles was performed and references were reviewed for missed citations.
RESULTS
We identified a total of 1,497 unique citations through our initial search. After performing a manual review, we excluded 1,483 of the references and added an additional 2, resulting in 16 articles selected for inclusion. The selected articles addressed interventions falling into three main groupings: implementation of institutional guidelines with or without electronic health record (EHR)–based decision support, educational interventions alone, and multifaceted interventions. Each of these interventions is discussed in the sections that follow. Table 1, Table 2, and Table 3 summarize the results of the studies included in our narrative review.
QUALITY INITIATIVES TO REDUCE PPI OVERUSE
Institutional Guidelines With or Without EHR-Based Decision Support
Table 1 summarizes institutional guidelines, with or without EHR-based decision support, to reduce inappropriate PPI use. The implementation of institutional guidelines for the appropriate reduction of PPI use has had some success. Coursol and Sanzari evaluated the impact of a treatment algorithm on the appropriateness of prescriptions for SUP in the intensive care unit (ICU).8 Risk factors of patients in this study included mechanical ventilation for 48 hours, coagulopathy for 24 hours, postoperative transplant, severe burns, active gastrointestinal (GI) disease, multiple trauma, multiple organ failure, and septicemia. The three treatment options chosen for the algorithm were intravenous (IV) famotidine (if the oral route was unavailable or impractical), omeprazole tablets (if oral access was available), and omeprazole suspension (in cases of dysphagia and presence of nasogastric or orogastric tube). After implementation of the treatment algorithm, the proportion of inappropriate prophylaxis decreased from 95.7% to 88.2% (P = .033), and the cost per patient decreased from $11.11 to $8.49 Canadian dollars (P = .003).

Van Vliet et al implemented a clinical practice guideline listing specific criteria for prescribing a PPI.9 Their criteria included the presence of gastric or duodenal ulcer and use of a nonsteroidal anti-inflammatory drug (NSAID) or aspirin, plus at least one additional risk factor (eg, history of gastroduodenal hemorrhage or age >70 years). The proportion of patients started on PPIs during hospitalization decreased from 21% to 13% (odds ratio, 0.56; 95% CI, 0.33-0.97).
Michal et al utilized an institutional pharmacist-driven protocol that stipulated criteria for appropriate PPI use (eg, upper GIB, mechanical ventilation, peptic ulcer disease, gastroesophageal reflux disease, coagulopathy).10 Pharmacists in the study evaluated patients for PPI appropriateness and recommended changes in medication or discontinuation of use. This institutional intervention decreased PPI use in non-ICU hospitalized adults. Discontinuation of PPIs increased from 41% of patients in the preintervention group to 66% of patients in the postintervention group (P = .001).
In addition to implementing guidelines and intervention strategies, institutions have also adopted changes to the EHR to reduce inappropriate PPI use. Herzig et al utilized a computerized clinical decision support intervention to decrease SUP in non-ICU hospitalized patients.11 Of the available response options for acid-suppressive medication, when SUP was chosen as the only indication for PPI use a prompt alerted the clinician that “[SUP] is not recommended for patients outside the [ICU]”; the alert resulted in a significant reduction in AST for the sole purpose of SUP. With this intervention, the percentage of patients who had any inappropriate acid-suppressive exposure decreased from 4.0% to 0.6% (P < .001).
EDUCATION
Table 2 summarizes educational interventions to reduce inappropriate PPI use.

Agee et al employed a pharmacist-led educational seminar that described SUP indications, risks, and costs.12 Inappropriate SUP prescriptions decreased from 55.5% to 30.5% after the intervention (P < .0001). However, there was no reduction in the percentage of patients discharged on inappropriate AST.
Chui et al performed an intervention with academic detailing wherein a one-on-one visit with a physician took place, providing education to improve physician prescribing behavior.13 In this study, academic detailing focused on the most common instances for which PPIs were inappropriately utilized at that hospital (eg, surgical prophylaxis, anemia). Inappropriate use of double-dose PPIs was also targeted. Despite these efforts, no significant difference in inappropriate PPI prescribing was observed post intervention.
Hamzat et al implemented an educational strategy to reduce inappropriate PPI prescribing during hospital stays, which included dissemination of fliers, posters, emails, and presentations over a 4-week period.14 Educational efforts targeted clinical pharmacists, nurses, physicians, and patients. Appropriate indications for PPI use in this study included peptic ulcer disease (current or previous), H pylori infection, and treatment or prevention of an NSAID-induced ulcer. The primary outcome was a reduction in PPI dose or discontinuation of PPI during the hospital admission, which increased from 9% in the preintervention (pre-education) phase to 43% during the intervention (education) phase and to 46% in the postintervention (posteducation) phase (P = .006).
Liberman and Whelan also implemented an educational intervention among internal medicine residents to reduce inappropriate use of SUP; this intervention was based on practice-based learning and improvement methodology.15 They noted that the rate of inappropriate prophylaxis with AST decreased from 59% preintervention to 33% post intervention (P < .007).
MULTIFACETED APPROACHES
Table 3 summarizes several multifaceted approaches aimed at reducing inappropriate PPI use. Belfield et al utilized an intervention consisting of an institutional guideline review, education, and monitoring of AST by clinical pharmacists to reduce inappropriate use of PPI for SUP.16 With this intervention, the primary outcome of total inappropriate days of AST during hospitalization decreased from 279 to 116 (48% relative reduction in risk, P < .01, across 142 patients studied). Furthermore, inappropriate AST prescriptions at discharge decreased from 32% to 8% (P = .006). The one case of GIB noted in this study occurred in the control group.

Del Giorno et al combined audit and feedback with education to reduce new PPI prescriptions at the time of discharge from the hospital.17 The educational component of this intervention included guidance regarding potentially inappropriate PPI use and associated side effects and targeted multiple departments in the hospital. This intervention led to a sustained reduction in new PPI prescriptions at discharge during the 3-year study period. The annual rate of new PPI prescriptions was 19%, 19%, 18%, and 16% in years 2014, 2015, 2016, and 2017, respectively, in the internal medicine department (postintervention group), compared with rates of 30%, 29%, 36%, 36% (P < .001) for the same years in the surgery department (control group).
Education and the use of medication reconciliation forms on admission and discharge were utilized by Gupta et al to reduce inappropriate AST in hospitalized patients from 51% prior to intervention to 22% post intervention (P < .001).18 Furthermore, the proportion of patients discharged on inappropriate AST decreased from 69% to 20% (P < .001).
Hatch et al also used educational resources and pharmacist-led medication reconciliation to reduce use of SUP.19 Before the intervention, 24.4% of patients were continued on SUP after hospital discharge in the absence of a clear indication for use; post intervention, 11% of patients were continued on SUP after hospital discharge (of these patients, 8.7% had no clear indication for use). This represented a 64.4% decrease in inappropriately prescribed SUP after discharge (P < .0001).
Khalili et al combined an educational intervention with an institutional guideline in an infectious disease ward to reduce inappropriate use of SUP.20 This intervention reduced the inappropriate use of AST from 80.9% before the intervention to 47.1% post intervention (P < .001).
Masood et al implemented two interventions wherein pharmacists reviewed SUP indications for each patient during daily team rounds, and ICU residents and fellows received education about indications for SUP and the implemented initiative on a bimonthly basis.21 Inappropriate AST decreased from 26.75 to 7.14 prescriptions per 100 patient-days of care (P < .001).
McDonald et al combined education with a web-based quality improvement tool to reduce inappropriate exit prescriptions for PPIs.22 The proportion of PPIs discontinued at hospital discharge increased from 7.7% per month to 18.5% per month (P = .03).
Finally, the initiative implemented by Tasaka et al to reduce overutilization of SUP included an institutional guideline, a pharmacist-led intervention, and an institutional education and awareness campaign.23 Their initiative led to a reduction in inappropriate SUP both at the time of transfer out of the ICU (8% before intervention, 4% post intervention, P = .54) and at the time of discharge from the hospital (7% before intervention, 0% post intervention, P = .22).
REDUCING PPI USE AND SAFETY OUTCOMES
Proton pump inhibitors are often initiated in the hospital setting, with up to half of these new prescriptions continued at discharge.2,24,25 Inappropriate prescriptions for PPIs expose patients to excess risk of long-term adverse events.26 De-escalating PPIs, however, raises concern among clinicians and patients for potential recurrence of dyspepsia and GIB. There is limited evidence regarding long-term safety outcomes (including GIB) following the discontinuation of PPIs deemed to have been inappropriately initiated in the hospital. In view of this, clinicians should educate and monitor individual patients for symptom relapse to ensure timely and appropriate resumption of AST.
LIMITATIONS
Our literature search for this narrative review and implementation guide has limitations. First, the time frame we included (2000-2018) may have excluded relevant articles published before our starting year. We did not include articles published before 2000 based on concerns these might contain outdated information. Also, there may have been incomplete retrieval of relevant studies/articles due to the labor-intensive nature involved in determining whether PPI prescriptions are appropriate or inappropriate.
We noted that interventional studies aimed at reducing overuse of PPIs were often limited by a low number of participants; these studies were also more likely to be single-center interventions, which limits generalizability. In addition, the studies often had low methodological rigor and lacked randomization or controls. Moreover, to fully evaluate the sustainability of interventions, some of the studies had a limited postimplementation period. For multifaceted interventions, the efficacy of individual components of the interventions was not clearly evaluated. Moreover, there was a high risk of bias in many of the included studies. Some of the larger studies used overall AST prescriptions as a surrogate for more appropriate use. It would be advantageous for a site to perform a pilot study that provides well-defined parameters for appropriate prescribing, and then correlate with the total number of prescriptions (automated and much easier) thereafter. Further, although the evidence regarding appropriate PPI use for SUP and GIB has shifted rapidly in recent years, society guidelines have not been updated to reflect this change. As such, quality improvement interventions have predominantly focused on reducing PPI use for the indications reflected by these guidelines.
IMPLEMENTATION BLUEPRINT
The following are our recommendations for successfully implementing an evidence-based, institution-wide initiative to promote the appropriate use of PPIs during hospitalization. These recommendations are informed by the evidence review and reflect the consensus of the combined committees coauthoring this review.
For an initiative to succeed, participation from multiple disciplines is necessary to formulate local guidelines and design and implement interventions. Such an interdisciplinary approach requires advocates to closely monitor and evaluate the program; sustainability will be greatly facilitated by the active engagement of key stakeholders, including the hospital’s executive administration, supply chain, pharmacists, and gastroenterologists. Lack of adequate buy-in on the part of key stakeholders is a barrier to the success of any intervention. Accordingly, before selecting a particular intervention, it is important to understand local factors driving the overuse of PPI.
1. Develop evidence-based institutional guidelines for both SUP and nonvariceal upper GIB through an interdisciplinary workgroup.
- Establish an interdisciplinary group including, but not limited to, pharmacists, hospitalists, gastroenterologists, and intensivists so that changes in practice will be widely adopted as institutional policy.
- Incorporate the best evidence and clearly convey appropriate and inappropriate uses.
2. Integrate changes to the EHR.
- If possible, the EHR should be leveraged to implement changes in PPI ordering practices.
- While integrating changes to the EHR, it is important to consider informatics and implementation science, since the utility of hard stops and best practice alerts has been questioned in the setting of operational inefficiencies and alert fatigue.
- Options for integrating changes to the EHR include the following:
- Create an ordering pathway that provides clinical decision support for PPI use.
- Incorporate a best practice alert in the EMR to notify clinicians of institutional guidelines when they initiate an order for PPI outside of the pathway.
- Consider restricting the authority to order IV PPIs by requiring a code or password or implement another means of using the EHR to limit the supply of PPI.
- Limit the duration of IV PPI by requiring daily renewal of IV PPI dosing or by altering the period of time that use of IV PPI is permitted (eg, 48 to 72 hours).
- PPIs should be removed from any current order sets that include medications for SUP.
3. Foster pharmacy-driven interventions.
- Consider requiring pharmacist approval for IV PPIs.
- Pharmacist-led review and feedback to clinicians for discontinuation of inappropriate PPIs can be effective in decreasing inappropriate utilization.
4. Provide education, audit data, and obtain feedback.
- Data auditing is needed to measure the efficacy of interventions. Outcome measures may include the number of non-ICU and ICU patients who are started on a PPI during an admission; the audit should be continued through discharge. A process measure may be the number of pharmacist calls for inappropriate PPIs. A balancing measure would be ulcer-specific upper GIB in patients who do not receive SUP during their admission. (Upper GIB from other etiologies, such as varices, portal hypertensive gastropathy, and Mallory-Weiss tear would not be affected by PPI SUP.)
- Run or control charts should be utilized, and data should be shared with project champions and ordering clinicians—in real time if possible.
- Project champions should provide feedback to colleagues; they should also work with hospital leadership to develop new strategies to improve adherence.
- Provide ongoing education about appropriate indications for PPIs and potential adverse effects associated with their use. Whenever possible, point-of-care or just-in-time teaching is the preferred format.
CONCLUSION
Excessive use of PPIs during hospitalization is prevalent; however, quality improvement interventions can be effective in achieving sustainable reductions in overuse. There is a need for the American College of Gastroenterology to revisit and update their guidelines for management of patients with ulcer bleeding to include stronger evidence-based recommendations on the proper use of PPIs.27 These updated guidelines could be used to update the implementation blueprint.
Quality improvement teams have an opportunity to use the principles of value-based healthcare to reduce inappropriate PPI use. By following the blueprint outlined in this article, institutions can safely and effectively tailor the use of PPIs to suitable patients in the appropriate settings. Reduction of PPI overuse can be employed as an institutional catalyst to promote implementation of further value-based measures to improve efficiency and quality of patient care.
1. Savarino V, Marabotto E, Zentilin P, et al. Proton pump inhibitors: use and misuse in the clinical setting. Exp Rev Clin Pharmacol. 2018;11(11):1123-1134. https://doi.org/10.1080/17512433.2018.1531703
2. Nardino RJ, Vender RJ, Herbert PN. Overuse of acid-suppressive therapy in hospitalized patients. Am J Gastroenterol. 2000;95(11):3118-3122. https://doi.org/10.1111/j.1572-0241.2000.03259.x
3. Ahrens D, Behrens G, Himmel W, Kochen MM, Chenot JF. Appropriateness of proton pump inhibitor recommendations at hospital discharge and continuation in primary care. Int J Clin Pract. 2012;66(8):767-773. https://doi.org/10.1111/j.1742-1241.2012.02973.x
4. Moledina DG, Perazella MA. PPIs and kidney disease: from AIN to CKD. J Nephrol. 2016;29(5):611-616. https://doi.org/10.1007/s40620-016-0309-2
5. Kwok CS, Arthur AK, Anibueze CI, Singh S, Cavallazzi R, Loke YK. Risk of Clostridium difficile infection with acid suppressing drugs and antibiotics: meta-analysis. Am J Gastroenterol. 2012;107(7):1011-1019. https://doi.org/10.1038/ajg.2012.108
6. Cheungpasitporn W, Thongprayoon C, Kittanamongkolchai W, et al. Proton pump inhibitors linked to hypomagnesemia: a systematic review and meta-analysis of observational studies. Ren Fail. 2015;37(7):1237-1241. https://doi.org/10.3109/0886022x.2015.1057800
7. Yang YX, Lewis JD, Epstein S, Metz DC. Long-term proton pump inhibitor therapy and risk of hip fracture. JAMA. 2006;296(24):2947-2953. https://doi.org/10.1001/jama.296.24.2947
8. Coursol CJ, Sanzari SE. Impact of stress ulcer prophylaxis algorithm study. Ann Pharmacother. 2005;39(5):810-816. https://doi.org/10.1345/aph.1d129
9. van Vliet EPM, Steyerberg EW, Otten HJ, et al. The effects of guideline implementation for proton pump inhibitor prescription on two pulmonary medicine wards. Aliment Pharmacol Ther. 2009;29(2):213-221. https://doi.org/10.1111/j.1365-2036.2008.03875.x
10. Michal J, Henry T, Street C. Impact of a pharmacist-driven protocol to decrease proton pump inhibitor use in non-intensive care hospitalized adults. Am J Health Syst Pharm. 2016;73(17 Suppl 4):S126-S132. https://doi.org/10.2146/ajhp150519
11. Herzig SJ, Guess JR, Feinbloom DB, et al. Improving appropriateness of acid-suppressive medication use via computerized clinical decision support. J Hosp Med. 2015;10(1):41-45. https://doi.org/10.1002/jhm.2260
12. Agee C, Coulter L, Hudson J. Effects of pharmacy resident led education on resident physician prescribing habits associated with stress ulcer prophylaxis in non-intensive care unit patients. Am J Health Syst Pharm. 2015;72(11 Suppl 1):S48-S52. https://doi.org/10.2146/sp150013
13. Chui D, Young F, Tejani AM, Dillon EC. Impact of academic detailing on proton pump inhibitor prescribing behaviour in a community hospital. Can Pharm J (Ott). 2011;144(2):66-71. https://doi.org/10.3821/1913-701X-144.2.66
14. Hamzat H, Sun H, Ford JC, Macleod J, Soiza RL, Mangoni AA. Inappropriate prescribing of proton pump inhibitors in older patients: effects of an educational strategy. Drugs Aging. 2012;29(8):681-690. https://doi.org/10.1007/bf03262283
15. Liberman JD, Whelan CT. Brief report: Reducing inappropriate usage of stress ulcer prophylaxis among internal medicine residents. A practice-based educational intervention. J Gen Intern Med. 2006;21(5):498-500. https://doi.org/10.1111/j.1525-1497.2006.00435.x
16. Belfield KD, Kuyumjian AG, Teran R, Amadi M, Blatt M, Bicking K. Impact of a collaborative strategy to reduce the inappropriate use of acid suppressive therapy in non-intensive care unit patients. Ann Pharmacother. 2017;51(7):577-583. https://doi.org/10.1177/1060028017698797
17. Del Giorno R, Ceschi A, Pironi M, Zasa A, Greco A, Gabutti L. Multifaceted intervention to curb in-hospital over-prescription of proton pump inhibitors: a longitudinal multicenter quasi-experimental before-and-after study. Eur J Intern Med. 2018;50:52-59. https://doi.org/10.1016/j.ejim.2017.11.002
18. Gupta R, Marshall J, Munoz JC, Kottoor R, Jamal MM, Vega KJ. Decreased acid suppression therapy overuse after education and medication reconciliation. Int J Clin Pract. 2013;67(1):60-65. https://doi.org/10.1111/ijcp.12046
19. Hatch JB, Schulz L, Fish JT. Stress ulcer prophylaxis: reducing non-indicated prescribing after hospital discharge. Ann Pharmacother. 2010;44(10):1565-1571. https://doi.org/10.1345/aph.1p167
20. Khalili H, Dashti-Khavidaki S, Hossein Talasaz AH, Tabeefar H, Hendoiee N. Descriptive analysis of a clinical pharmacy intervention to improve the appropriate use of stress ulcer prophylaxis in a hospital infectious disease ward. J Manag Care Pharm. 2010;16(2):114-121. https://doi.org/10.18553/jmcp.2010.16.2.114
21. Masood U, Sharma A, Bhatti Z, et al. A successful pharmacist-based quality initiative to reduce inappropriate stress ulcer prophylaxis use in an academic medical intensive care unit. Inquiry. 2018;55:46958018759116. https://doi.org/10.1177/0046958018759116
22. McDonald EG, Jones J, Green L, Jayaraman D, Lee TC. Reduction of inappropriate exit prescriptions for proton pump inhibitors: a before-after study using education paired with a web-based quality-improvement tool. J Hosp Med. 2015;10(5):281-286. https://doi.org/10.1002/jhm.2330
23. Tasaka CL, Burg C, VanOsdol SJ, et al. An interprofessional approach to reducing the overutilization of stress ulcer prophylaxis in adult medical and surgical intensive care units. Ann Pharmacother. 2014;48(4):462-469. https://doi.org/10.1177/1060028013517088
24. Zink DA, Pohlman M, Barnes M, Cannon ME. Long-term use of acid suppression started inappropriately during hospitalization. Aliment Pharmacol Ther. 2005;21(10):1203-1209. https://doi.org/10.1111/j.1365-2036.2005.02454.x
25. Pham CQ, Regal RE, Bostwick TR, Knauf KS. Acid suppressive therapy use on an inpatient internal medicine service. Ann Pharmacother. 2006;40(7-8):1261-1266. https://doi.org/10.1345/aph.1g703
26. Schoenfeld AJ, Grady D. Adverse effects associated with proton pump inhibitors [editorial]. JAMA Intern Med. 2016;176(2):172-174. https://doi.org/10.1001/jamainternmed.2015.7927
27. Laine L, Jensen DM. Management of patients with ulcer bleeding. Am J Gastroenterol. 2012;107(3):345-360; quiz 361. https://doi.org/10.1038/ajg.2011.480
Proton pump inhibitors (PPIs) are among the most commonly used drugs worldwide to treat dyspepsia and prevent gastrointestinal bleeding (GIB).1 Between 40% and 70% of hospitalized patients receive acid-suppressive therapy (AST; defined as PPIs or histamine-receptor antagonists), and nearly half of these are initiated during the inpatient stay.2,3 While up to 50% of inpatients who received a new AST were discharged on these medications,2 there were no evidence-based indications for a majority of the prescriptions.2,3
Growing evidence shows that PPIs are overutilized and may be associated with wide-ranging adverse events, such as acute and chronic kidney disease,4Clostridium difficile infection,5 hypomagnesemia,6 and fractures.7 Because of the widespread overuse and the potential harm associated with PPIs, a concerted effort to promote their appropriate use in the inpatient setting is necessary. It is important to note that reducing the use of PPIs does not increase the risks of GIB or worsening dyspepsia. Rather, reducing overuse of PPIs lowers the risk of harm to patients. The efforts to reduce overuse, however, are complex and difficult.
This article summarizes evidence regarding interventions to reduce overuse and offers an implementation guide based on this evidence. This guide promotes value-based quality improvement and provides a blueprint for implementing an institution-wide program to reduce PPI overuse in the inpatient setting. We begin with a discussion about quality initiatives to reduce PPI overuse, followed by a review of the safety outcomes associated with reduced use of PPIs.
METHODS
A focused search of the US National Library of Medicine’s PubMed database was performed to identify English-language articles published between 2000 and 2018 that addressed strategies to reduce PPI overuse for stress ulcer prophylaxis (SUP) and nonvariceal GIB. The following search terms were used: PPI and inappropriate use; acid-suppressive therapy and inappropriate use; PPI and discontinuation; acid-suppressive (or suppressant) therapy and discontinuation; SUP and cost; and histamine receptor antagonist and PPI. Inpatient or outpatient studies of patients aged 18 years or older were considered for inclusion in this narrative review, and all study types were included. The primary exclusion criterion was patients aged younger than 18 years. A manual review of the full text of the retrieved articles was performed and references were reviewed for missed citations.
RESULTS
We identified a total of 1,497 unique citations through our initial search. After performing a manual review, we excluded 1,483 of the references and added an additional 2, resulting in 16 articles selected for inclusion. The selected articles addressed interventions falling into three main groupings: implementation of institutional guidelines with or without electronic health record (EHR)–based decision support, educational interventions alone, and multifaceted interventions. Each of these interventions is discussed in the sections that follow. Table 1, Table 2, and Table 3 summarize the results of the studies included in our narrative review.
QUALITY INITIATIVES TO REDUCE PPI OVERUSE
Institutional Guidelines With or Without EHR-Based Decision Support
Table 1 summarizes institutional guidelines, with or without EHR-based decision support, to reduce inappropriate PPI use. The implementation of institutional guidelines for the appropriate reduction of PPI use has had some success. Coursol and Sanzari evaluated the impact of a treatment algorithm on the appropriateness of prescriptions for SUP in the intensive care unit (ICU).8 Risk factors of patients in this study included mechanical ventilation for 48 hours, coagulopathy for 24 hours, postoperative transplant, severe burns, active gastrointestinal (GI) disease, multiple trauma, multiple organ failure, and septicemia. The three treatment options chosen for the algorithm were intravenous (IV) famotidine (if the oral route was unavailable or impractical), omeprazole tablets (if oral access was available), and omeprazole suspension (in cases of dysphagia and presence of nasogastric or orogastric tube). After implementation of the treatment algorithm, the proportion of inappropriate prophylaxis decreased from 95.7% to 88.2% (P = .033), and the cost per patient decreased from $11.11 to $8.49 Canadian dollars (P = .003).
Van Vliet et al implemented a clinical practice guideline listing specific criteria for prescribing a PPI.9 Their criteria included the presence of gastric or duodenal ulcer and use of a nonsteroidal anti-inflammatory drug (NSAID) or aspirin, plus at least one additional risk factor (eg, history of gastroduodenal hemorrhage or age >70 years). The proportion of patients started on PPIs during hospitalization decreased from 21% to 13% (odds ratio, 0.56; 95% CI, 0.33-0.97).
Michal et al utilized an institutional pharmacist-driven protocol that stipulated criteria for appropriate PPI use (eg, upper GIB, mechanical ventilation, peptic ulcer disease, gastroesophageal reflux disease, coagulopathy).10 Pharmacists in the study evaluated patients for PPI appropriateness and recommended changes in medication or discontinuation of use. This institutional intervention decreased PPI use in non-ICU hospitalized adults. Discontinuation of PPIs increased from 41% of patients in the preintervention group to 66% of patients in the postintervention group (P = .001).
In addition to implementing guidelines and intervention strategies, institutions have also adopted changes to the EHR to reduce inappropriate PPI use. Herzig et al utilized a computerized clinical decision support intervention to decrease SUP in non-ICU hospitalized patients.11 Of the available response options for acid-suppressive medication, when SUP was chosen as the only indication for PPI use a prompt alerted the clinician that “[SUP] is not recommended for patients outside the [ICU]”; the alert resulted in a significant reduction in AST for the sole purpose of SUP. With this intervention, the percentage of patients who had any inappropriate acid-suppressive exposure decreased from 4.0% to 0.6% (P < .001).
EDUCATION
Table 2 summarizes educational interventions to reduce inappropriate PPI use.
Agee et al employed a pharmacist-led educational seminar that described SUP indications, risks, and costs.12 Inappropriate SUP prescriptions decreased from 55.5% to 30.5% after the intervention (P < .0001). However, there was no reduction in the percentage of patients discharged on inappropriate AST.
Chui et al performed an intervention with academic detailing wherein a one-on-one visit with a physician took place, providing education to improve physician prescribing behavior.13 In this study, academic detailing focused on the most common instances for which PPIs were inappropriately utilized at that hospital (eg, surgical prophylaxis, anemia). Inappropriate use of double-dose PPIs was also targeted. Despite these efforts, no significant difference in inappropriate PPI prescribing was observed post intervention.
Hamzat et al implemented an educational strategy to reduce inappropriate PPI prescribing during hospital stays, which included dissemination of fliers, posters, emails, and presentations over a 4-week period.14 Educational efforts targeted clinical pharmacists, nurses, physicians, and patients. Appropriate indications for PPI use in this study included peptic ulcer disease (current or previous), H pylori infection, and treatment or prevention of an NSAID-induced ulcer. The primary outcome was a reduction in PPI dose or discontinuation of PPI during the hospital admission, which increased from 9% in the preintervention (pre-education) phase to 43% during the intervention (education) phase and to 46% in the postintervention (posteducation) phase (P = .006).
Liberman and Whelan also implemented an educational intervention among internal medicine residents to reduce inappropriate use of SUP; this intervention was based on practice-based learning and improvement methodology.15 They noted that the rate of inappropriate prophylaxis with AST decreased from 59% preintervention to 33% post intervention (P < .007).
MULTIFACETED APPROACHES
Table 3 summarizes several multifaceted approaches aimed at reducing inappropriate PPI use. Belfield et al utilized an intervention consisting of an institutional guideline review, education, and monitoring of AST by clinical pharmacists to reduce inappropriate use of PPI for SUP.16 With this intervention, the primary outcome of total inappropriate days of AST during hospitalization decreased from 279 to 116 (48% relative reduction in risk, P < .01, across 142 patients studied). Furthermore, inappropriate AST prescriptions at discharge decreased from 32% to 8% (P = .006). The one case of GIB noted in this study occurred in the control group.
Del Giorno et al combined audit and feedback with education to reduce new PPI prescriptions at the time of discharge from the hospital.17 The educational component of this intervention included guidance regarding potentially inappropriate PPI use and associated side effects and targeted multiple departments in the hospital. This intervention led to a sustained reduction in new PPI prescriptions at discharge during the 3-year study period. The annual rate of new PPI prescriptions was 19%, 19%, 18%, and 16% in years 2014, 2015, 2016, and 2017, respectively, in the internal medicine department (postintervention group), compared with rates of 30%, 29%, 36%, 36% (P < .001) for the same years in the surgery department (control group).
Education and the use of medication reconciliation forms on admission and discharge were utilized by Gupta et al to reduce inappropriate AST in hospitalized patients from 51% prior to intervention to 22% post intervention (P < .001).18 Furthermore, the proportion of patients discharged on inappropriate AST decreased from 69% to 20% (P < .001).
Hatch et al also used educational resources and pharmacist-led medication reconciliation to reduce use of SUP.19 Before the intervention, 24.4% of patients were continued on SUP after hospital discharge in the absence of a clear indication for use; post intervention, 11% of patients were continued on SUP after hospital discharge (of these patients, 8.7% had no clear indication for use). This represented a 64.4% decrease in inappropriately prescribed SUP after discharge (P < .0001).
Khalili et al combined an educational intervention with an institutional guideline in an infectious disease ward to reduce inappropriate use of SUP.20 This intervention reduced the inappropriate use of AST from 80.9% before the intervention to 47.1% post intervention (P < .001).
Masood et al implemented two interventions wherein pharmacists reviewed SUP indications for each patient during daily team rounds, and ICU residents and fellows received education about indications for SUP and the implemented initiative on a bimonthly basis.21 Inappropriate AST decreased from 26.75 to 7.14 prescriptions per 100 patient-days of care (P < .001).
McDonald et al combined education with a web-based quality improvement tool to reduce inappropriate exit prescriptions for PPIs.22 The proportion of PPIs discontinued at hospital discharge increased from 7.7% per month to 18.5% per month (P = .03).
Finally, the initiative implemented by Tasaka et al to reduce overutilization of SUP included an institutional guideline, a pharmacist-led intervention, and an institutional education and awareness campaign.23 Their initiative led to a reduction in inappropriate SUP both at the time of transfer out of the ICU (8% before intervention, 4% post intervention, P = .54) and at the time of discharge from the hospital (7% before intervention, 0% post intervention, P = .22).
REDUCING PPI USE AND SAFETY OUTCOMES
Proton pump inhibitors are often initiated in the hospital setting, with up to half of these new prescriptions continued at discharge.2,24,25 Inappropriate prescriptions for PPIs expose patients to excess risk of long-term adverse events.26 De-escalating PPIs, however, raises concern among clinicians and patients for potential recurrence of dyspepsia and GIB. There is limited evidence regarding long-term safety outcomes (including GIB) following the discontinuation of PPIs deemed to have been inappropriately initiated in the hospital. In view of this, clinicians should educate and monitor individual patients for symptom relapse to ensure timely and appropriate resumption of AST.
LIMITATIONS
Our literature search for this narrative review and implementation guide has limitations. First, the time frame we included (2000-2018) may have excluded relevant articles published before our starting year. We did not include articles published before 2000 based on concerns these might contain outdated information. Also, there may have been incomplete retrieval of relevant studies/articles due to the labor-intensive nature involved in determining whether PPI prescriptions are appropriate or inappropriate.
We noted that interventional studies aimed at reducing overuse of PPIs were often limited by a low number of participants; these studies were also more likely to be single-center interventions, which limits generalizability. In addition, the studies often had low methodological rigor and lacked randomization or controls. Moreover, to fully evaluate the sustainability of interventions, some of the studies had a limited postimplementation period. For multifaceted interventions, the efficacy of individual components of the interventions was not clearly evaluated. Moreover, there was a high risk of bias in many of the included studies. Some of the larger studies used overall AST prescriptions as a surrogate for more appropriate use. It would be advantageous for a site to perform a pilot study that provides well-defined parameters for appropriate prescribing, and then correlate with the total number of prescriptions (automated and much easier) thereafter. Further, although the evidence regarding appropriate PPI use for SUP and GIB has shifted rapidly in recent years, society guidelines have not been updated to reflect this change. As such, quality improvement interventions have predominantly focused on reducing PPI use for the indications reflected by these guidelines.
IMPLEMENTATION BLUEPRINT
The following are our recommendations for successfully implementing an evidence-based, institution-wide initiative to promote the appropriate use of PPIs during hospitalization. These recommendations are informed by the evidence review and reflect the consensus of the combined committees coauthoring this review.
For an initiative to succeed, participation from multiple disciplines is necessary to formulate local guidelines and design and implement interventions. Such an interdisciplinary approach requires advocates to closely monitor and evaluate the program; sustainability will be greatly facilitated by the active engagement of key stakeholders, including the hospital’s executive administration, supply chain, pharmacists, and gastroenterologists. Lack of adequate buy-in on the part of key stakeholders is a barrier to the success of any intervention. Accordingly, before selecting a particular intervention, it is important to understand local factors driving the overuse of PPI.
1. Develop evidence-based institutional guidelines for both SUP and nonvariceal upper GIB through an interdisciplinary workgroup.
- Establish an interdisciplinary group including, but not limited to, pharmacists, hospitalists, gastroenterologists, and intensivists so that changes in practice will be widely adopted as institutional policy.
- Incorporate the best evidence and clearly convey appropriate and inappropriate uses.
2. Integrate changes to the EHR.
- If possible, the EHR should be leveraged to implement changes in PPI ordering practices.
- While integrating changes to the EHR, it is important to consider informatics and implementation science, since the utility of hard stops and best practice alerts has been questioned in the setting of operational inefficiencies and alert fatigue.
- Options for integrating changes to the EHR include the following:
- Create an ordering pathway that provides clinical decision support for PPI use.
- Incorporate a best practice alert in the EMR to notify clinicians of institutional guidelines when they initiate an order for PPI outside of the pathway.
- Consider restricting the authority to order IV PPIs by requiring a code or password or implement another means of using the EHR to limit the supply of PPI.
- Limit the duration of IV PPI by requiring daily renewal of IV PPI dosing or by altering the period of time that use of IV PPI is permitted (eg, 48 to 72 hours).
- PPIs should be removed from any current order sets that include medications for SUP.
3. Foster pharmacy-driven interventions.
- Consider requiring pharmacist approval for IV PPIs.
- Pharmacist-led review and feedback to clinicians for discontinuation of inappropriate PPIs can be effective in decreasing inappropriate utilization.
4. Provide education, audit data, and obtain feedback.
- Data auditing is needed to measure the efficacy of interventions. Outcome measures may include the number of non-ICU and ICU patients who are started on a PPI during an admission; the audit should be continued through discharge. A process measure may be the number of pharmacist calls for inappropriate PPIs. A balancing measure would be ulcer-specific upper GIB in patients who do not receive SUP during their admission. (Upper GIB from other etiologies, such as varices, portal hypertensive gastropathy, and Mallory-Weiss tear would not be affected by PPI SUP.)
- Run or control charts should be utilized, and data should be shared with project champions and ordering clinicians—in real time if possible.
- Project champions should provide feedback to colleagues; they should also work with hospital leadership to develop new strategies to improve adherence.
- Provide ongoing education about appropriate indications for PPIs and potential adverse effects associated with their use. Whenever possible, point-of-care or just-in-time teaching is the preferred format.
CONCLUSION
Excessive use of PPIs during hospitalization is prevalent; however, quality improvement interventions can be effective in achieving sustainable reductions in overuse. There is a need for the American College of Gastroenterology to revisit and update their guidelines for management of patients with ulcer bleeding to include stronger evidence-based recommendations on the proper use of PPIs.27 These updated guidelines could be used to update the implementation blueprint.
Quality improvement teams have an opportunity to use the principles of value-based healthcare to reduce inappropriate PPI use. By following the blueprint outlined in this article, institutions can safely and effectively tailor the use of PPIs to suitable patients in the appropriate settings. Reduction of PPI overuse can be employed as an institutional catalyst to promote implementation of further value-based measures to improve efficiency and quality of patient care.
1. Savarino V, Marabotto E, Zentilin P, et al. Proton pump inhibitors: use and misuse in the clinical setting. Exp Rev Clin Pharmacol. 2018;11(11):1123-1134. https://doi.org/10.1080/17512433.2018.1531703
2. Nardino RJ, Vender RJ, Herbert PN. Overuse of acid-suppressive therapy in hospitalized patients. Am J Gastroenterol. 2000;95(11):3118-3122. https://doi.org/10.1111/j.1572-0241.2000.03259.x
3. Ahrens D, Behrens G, Himmel W, Kochen MM, Chenot JF. Appropriateness of proton pump inhibitor recommendations at hospital discharge and continuation in primary care. Int J Clin Pract. 2012;66(8):767-773. https://doi.org/10.1111/j.1742-1241.2012.02973.x
4. Moledina DG, Perazella MA. PPIs and kidney disease: from AIN to CKD. J Nephrol. 2016;29(5):611-616. https://doi.org/10.1007/s40620-016-0309-2
5. Kwok CS, Arthur AK, Anibueze CI, Singh S, Cavallazzi R, Loke YK. Risk of Clostridium difficile infection with acid suppressing drugs and antibiotics: meta-analysis. Am J Gastroenterol. 2012;107(7):1011-1019. https://doi.org/10.1038/ajg.2012.108
6. Cheungpasitporn W, Thongprayoon C, Kittanamongkolchai W, et al. Proton pump inhibitors linked to hypomagnesemia: a systematic review and meta-analysis of observational studies. Ren Fail. 2015;37(7):1237-1241. https://doi.org/10.3109/0886022x.2015.1057800
7. Yang YX, Lewis JD, Epstein S, Metz DC. Long-term proton pump inhibitor therapy and risk of hip fracture. JAMA. 2006;296(24):2947-2953. https://doi.org/10.1001/jama.296.24.2947
8. Coursol CJ, Sanzari SE. Impact of stress ulcer prophylaxis algorithm study. Ann Pharmacother. 2005;39(5):810-816. https://doi.org/10.1345/aph.1d129
9. van Vliet EPM, Steyerberg EW, Otten HJ, et al. The effects of guideline implementation for proton pump inhibitor prescription on two pulmonary medicine wards. Aliment Pharmacol Ther. 2009;29(2):213-221. https://doi.org/10.1111/j.1365-2036.2008.03875.x
10. Michal J, Henry T, Street C. Impact of a pharmacist-driven protocol to decrease proton pump inhibitor use in non-intensive care hospitalized adults. Am J Health Syst Pharm. 2016;73(17 Suppl 4):S126-S132. https://doi.org/10.2146/ajhp150519
11. Herzig SJ, Guess JR, Feinbloom DB, et al. Improving appropriateness of acid-suppressive medication use via computerized clinical decision support. J Hosp Med. 2015;10(1):41-45. https://doi.org/10.1002/jhm.2260
12. Agee C, Coulter L, Hudson J. Effects of pharmacy resident led education on resident physician prescribing habits associated with stress ulcer prophylaxis in non-intensive care unit patients. Am J Health Syst Pharm. 2015;72(11 Suppl 1):S48-S52. https://doi.org/10.2146/sp150013
13. Chui D, Young F, Tejani AM, Dillon EC. Impact of academic detailing on proton pump inhibitor prescribing behaviour in a community hospital. Can Pharm J (Ott). 2011;144(2):66-71. https://doi.org/10.3821/1913-701X-144.2.66
14. Hamzat H, Sun H, Ford JC, Macleod J, Soiza RL, Mangoni AA. Inappropriate prescribing of proton pump inhibitors in older patients: effects of an educational strategy. Drugs Aging. 2012;29(8):681-690. https://doi.org/10.1007/bf03262283
15. Liberman JD, Whelan CT. Brief report: Reducing inappropriate usage of stress ulcer prophylaxis among internal medicine residents. A practice-based educational intervention. J Gen Intern Med. 2006;21(5):498-500. https://doi.org/10.1111/j.1525-1497.2006.00435.x
16. Belfield KD, Kuyumjian AG, Teran R, Amadi M, Blatt M, Bicking K. Impact of a collaborative strategy to reduce the inappropriate use of acid suppressive therapy in non-intensive care unit patients. Ann Pharmacother. 2017;51(7):577-583. https://doi.org/10.1177/1060028017698797
17. Del Giorno R, Ceschi A, Pironi M, Zasa A, Greco A, Gabutti L. Multifaceted intervention to curb in-hospital over-prescription of proton pump inhibitors: a longitudinal multicenter quasi-experimental before-and-after study. Eur J Intern Med. 2018;50:52-59. https://doi.org/10.1016/j.ejim.2017.11.002
18. Gupta R, Marshall J, Munoz JC, Kottoor R, Jamal MM, Vega KJ. Decreased acid suppression therapy overuse after education and medication reconciliation. Int J Clin Pract. 2013;67(1):60-65. https://doi.org/10.1111/ijcp.12046
19. Hatch JB, Schulz L, Fish JT. Stress ulcer prophylaxis: reducing non-indicated prescribing after hospital discharge. Ann Pharmacother. 2010;44(10):1565-1571. https://doi.org/10.1345/aph.1p167
20. Khalili H, Dashti-Khavidaki S, Hossein Talasaz AH, Tabeefar H, Hendoiee N. Descriptive analysis of a clinical pharmacy intervention to improve the appropriate use of stress ulcer prophylaxis in a hospital infectious disease ward. J Manag Care Pharm. 2010;16(2):114-121. https://doi.org/10.18553/jmcp.2010.16.2.114
21. Masood U, Sharma A, Bhatti Z, et al. A successful pharmacist-based quality initiative to reduce inappropriate stress ulcer prophylaxis use in an academic medical intensive care unit. Inquiry. 2018;55:46958018759116. https://doi.org/10.1177/0046958018759116
22. McDonald EG, Jones J, Green L, Jayaraman D, Lee TC. Reduction of inappropriate exit prescriptions for proton pump inhibitors: a before-after study using education paired with a web-based quality-improvement tool. J Hosp Med. 2015;10(5):281-286. https://doi.org/10.1002/jhm.2330
23. Tasaka CL, Burg C, VanOsdol SJ, et al. An interprofessional approach to reducing the overutilization of stress ulcer prophylaxis in adult medical and surgical intensive care units. Ann Pharmacother. 2014;48(4):462-469. https://doi.org/10.1177/1060028013517088
24. Zink DA, Pohlman M, Barnes M, Cannon ME. Long-term use of acid suppression started inappropriately during hospitalization. Aliment Pharmacol Ther. 2005;21(10):1203-1209. https://doi.org/10.1111/j.1365-2036.2005.02454.x
25. Pham CQ, Regal RE, Bostwick TR, Knauf KS. Acid suppressive therapy use on an inpatient internal medicine service. Ann Pharmacother. 2006;40(7-8):1261-1266. https://doi.org/10.1345/aph.1g703
26. Schoenfeld AJ, Grady D. Adverse effects associated with proton pump inhibitors [editorial]. JAMA Intern Med. 2016;176(2):172-174. https://doi.org/10.1001/jamainternmed.2015.7927
27. Laine L, Jensen DM. Management of patients with ulcer bleeding. Am J Gastroenterol. 2012;107(3):345-360; quiz 361. https://doi.org/10.1038/ajg.2011.480
© 2021 Society of Hospital Medicine
Things We Do For No Reason™: Rasburicase for Adult Patients With Tumor Lysis Syndrome
Inspired by the ABIM Foundation’s Choosing Wisely ® campaign, the “Things We Do for No Reason™” (TWDFNR) series reviews practices that have become common parts of hospital care but may provide little value to our patients. Practices reviewed in the TWDFNR series do not represent clear-cut conclusions or clinical practice standards but are meant as a starting place for research and active discussions among hospitalists and patients. We invite you to be part of that discussion.
A 35-year-old man with a history of diffuse large B-cell lymphoma (DLBCL), who most recently received treatment 12 months earlier, presents to the emergency department with abdominal pain and constipation. A computed tomography scan of the abdomen reveals retroperitoneal and mesenteric lymphadenopathy causing small bowel obstruction. The basic metabolic panel reveals a creatinine of 1.1 mg/dL, calcium of 8.5 mg/dL, phosphorus of 4 mg/dL, potassium of 4.5 mEq/L, and uric acid of 7.3 mg/dL. The admitting team contemplates using allopurinol or rasburicase for tumor lysis syndrome (TLS) prevention in the setting of recurrent DLBCL.
BACKGROUND
Tumor lysis syndrome is characterized by metabolic derangement and end-organ damage in the setting of cytotoxic chemotherapy, chemosensitive malignancy, and/or increased tumor burden.1 Risk stratification for TLS takes into account patient and disease characteristics (Table 1). Other risk factors include tumor bulk, elevated baseline serum lactate dehydrogenase, and certain types of chemotherapy (eg, cisplatin, cytarabine, etoposide, paclitaxel, cytotoxic therapies), immunotherapy, or targeted therapy.2 Elevated serum levels of uric acid, potassium, and phosphorus, as well as preexisting renal dysfunction, predispose patients to clinical TLS.3

The Cairo-Bishop classification system is most frequently used to diagnose TLS (Table 2).3 Laboratory features include hyperkalemia, hyperphosphatemia, hyperuricemia, and hypocalcemia secondary to lysis of proliferating tumor cells and their nuclei. Clinical features include arrhythmias, seizures, and acute kidney injury (AKI).1 Acute kidney injury, the most common clinical complication of TLS, results from crystallization of markedly elevated plasma uric acid, leading to tubular obstruction.1,4 The development of AKI can predict morbidity (namely, the need for renal replacement therapy [RRT]) and mortality in this patient population.1

Stratifying a patient’s baseline risk of developing TLS often dictates the prevention and management plan. Therapeutic prophylaxis and management strategies for TLS include aggressive fluid resuscitation, diuresis, plasma uric acid (PUA) levels, monitoring electrolyte levels, and, in certain life-threatening situations, dialysis. Oncologists presume reducing uric acid levels prevents and treats TLS.
Current methods to reduce PUA as a means of preventing or treating TLS include xanthine oxidase inhibitors (eg, allopurinol) or urate oxidase (eg, rasburicase). Before the US Food and Drug Administration’s (FDA) approval of rasburicase to manage TLS, providers combined allopurinol (a purine analog that inhibits the enzyme xanthine oxidase, decreasing uric acid level) with aggressive fluid resuscitation. Approved by the FDA in 2002, rasburicase offers an alternative treatment for hyperuricemia by directly decreasing levels of uric acid instead of merely preventing the increased formation of uric acid. As a urate oxidase, rasburicase converts uric acid to the non-nephrotoxic, water-soluble, and freely excreted allantoin.
WHY YOU MIGHT THINK YOU SHOULD USE URATE OXIDASE IN TUMOR LYSIS SYNDROME FOR THE PREVENTION AND MANAGEMENT OF ACUTE KIDNEY INJURY
Rasburicase is often considered the standard-of-care treatment for hyperuricemia due to its ability to reduce circulating uric acid levels rapidly. The primary goal of uric acid reduction is to prevent the occurrence of AKI.
Based upon bioplausible relevance to clinically meaningful endpoints, researchers selected PUA reduction as the primary outcome in randomized controlled trials (RCTs) and observational studies to justify treatment with rasburicase. In RCTs, compassionate trials, and systematic reviews and meta-analyses, rasburicase demonstrated a more rapid reduction in uric acid levels compared to allopurinol.5 Specifically, in one study by Goldman et al,6 rasburicase decreased baseline uric acid levels in pediatric oncology patients by 86% (statistically significant) 4 hours after administration, compared to allopurinol, which only reduced baseline uric acid by 12%. According to a study by Cairo et al, allopurinol may take up to 1 day to reduce PUA.3
WHY URATE OXIDASE MAY NOT IMPROVE CLINICAL OUTCOMES IN PATIENTS AT RISK FOR OR WITH TUMOR LYSIS SYNDROME
Randomized controlled trials examining the safety, efficacy, and cost-effectiveness of rasburicase in adult patients remain sparse. Both RCTs and systematic reviews and meta-analyses rely on PUA levels as a surrogate endpoint and fail to include clinically meaningful primary endpoints (eg, change in baseline creatinine or need for RRT), raising the question as to whether rasburicase improves patient-centered outcomes.5 Since previous studies in the oncology literature show low or modest correlations between PUA reduction and patient-oriented outcomes, we must question whether PUA reduction serves as a meaningful surrogate endpoint.
Treatment of Tumor Lysis Syndrome
Two meta-analyses focusing on the treatment of TLS by Dinnel et al5 and Lopez-Olivo et al8 each included only three unique RCTs (two of the three RCTs were referenced in both meta-analyses). Moreover, both studies included only one RCT comparing rasburicase directly to allopurinol (a 2010 RCT by Cortes et al9) while the other RCTs compared the impact of different rasburicase dosing regimens. Researchers powered the head-to-head RCT by Cortes et al9 to detect a difference in PUA levels across three different arms: rasburicase, rasburicase plus allopurinol, or allopurinol alone. All three treatment arms resulted in a statistically significant reduction in serum PUA levels (87%, 78%, 66%, respectively; P = .001) without a change in the secondary, underpowered clinical outcomes such as clinical TLS or reduced renal function (defined in this study as increased creatinine, renal failure/impairment, or acute renal failure).
More recently, retrospective analyses of patients with AKI secondary to TLS found no difference in creatinine improvement, renal recovery, or prevention of RRT based on whether the patients received either rasburicase or allopurinol.10,11 While rasburicase is associated with greater PUA reduction compared to allopurinol, according to meaningful RCT and observational data as discussed previously and described further in the following section, this does not translate to clinically important risk reduction.
Prevention of Tumor Lysis Syndrome
Furthermore, there exists little compelling evidence to support the use of rasburicase for preventing AKI secondary to TLS. Even among patients at high-risk for TLS (the only group for whom rasburicase is currently recommended),5 rasburicase does not definitively prevent AKI. Data suggest that despite lowering uric acid levels, rasburicase does not consistently prevent renal injury11 or decrease the total number of subsequent inpatient days.12 The only phase 3 trial that compared the efficacy of rasburicase to allopurinol for the prevention of TLS and included clinically meaningful endpoints (eg, renal failure) found that, while rasburicase reduced uric acid levels faster than allopurinol, it did not decrease rates of clinical TLS.9
The published literature offers limited efficacy data of rasburicase in preventing TLS in low-risk patients; however, the absence of benefit of rasburicase in preventing renal failure in high-risk patients warrants skepticism as to its potential efficacy in low-risk patients.8,10
Costs-Effectiveness and Other Ethical Considerations
Rasburicase is an expensive treatment. The estimated cost of the FDA-recommended dosing is around $37,500.13 Moreover, studies comparing the cost-effectiveness of rasburicase to allopurinol focus primarily on patients at high-risk for TLS, which overestimates the cost-effectiveness of rasburicase in patients at low-to-intermediate risk for TLS.14,15 Unfortunately, some providers inappropriately prescribe rasburicase regularly to patients at low or intermediate risk for TLS. Based on observational studies of rasburicase in various clinical scenarios, including inpatient and emergency department settings, inappropriate use of rasburicase (eg, in the setting of hyperuricemia without evidence of a high-risk TLS tumor, no prior trial of allopurinol, preserved renal function, no laboratory evaluation) ranges from 32% to 70%.14,15
Finally, while <1% of patients experience rasburicase-induced anaphylaxis, 20% to 50% of patients develop gastrointestinal symptoms and viral-syndrome-like symptoms.16 Meanwhile, major side effects from allopurinol that occur with 1% to 10% frequency include maculopapular rash, pruritis, gout, nausea, vomiting, and renal failure syndrome.17 Even if the cost for rasburicase and allopurinol were similar, the lack of improved efficacy and the side-effect profiles of the two medications should make us question whether to prescribe rasburicase preferentially over allopurinol.
WHEN MIGHT URATE OXIDASE BE HELPFUL IN TUMOR LYSIS SYNDROME
While some experts recommend rasburicase prophylaxis in patients at high risk for developing TLS, such recommendations rely on low-quality evidence.2 When prescribing rasburicase, the hospitalist must ensure correct dosing. The FDA approved rasburicase for weight-based dosing at 0.2 mg/kg, though current evidence favors a single, fixed dose of 3 mg.16,17 Compared to weight-based dosing, which has an estimated cost-effectiveness ratio ranging from $27,982.77 to $119,643.59 per quality-adjusted life-year, single dosing has equivalent efficacy at approximately 50% lower cost per dose.11,17,18
WHAT YOU SHOULD DO INSTEAD
As a preventive treatment for TLS, clinicians should only consider prescribing rasburicase as a single fixed dose of 3 mg to high-risk patients.17 In the event of AKI secondary to TLS, clinicians should proceed with the mainstay treatment of resuscitation with aggressive fluid resuscitation, with a goal urine output of at least 2 mL/kg/h.1 Fluid resuscitation should be used cautiously in patients with oliguric or anuric AKI, pulmonary hypertension, congestive heart failure, and hemodynamically significant valvular disease. Clinicians should provide continuous cardiac monitoring during the initial presentation to monitor for electrocardiographic changes in the setting of hyperkalemia and hypocalcemia, and they should consult nephrology, oncology, and critical care services early in the disease course to maximize coordination of care.
RECOMMENDATIONS
Prevention
- Identify patients at high-risk of TLS (Table 1) and consider a single 3-mg dose of rasburicase.
- Manage low- and intermediate-risk patients with allopurinol and hydration.
Treatment
- Identify patients with TLS using the clinical and laboratory findings outlined in the Cairo-Bishop classification system (Table 2).
- Initiate aggressive fluid resuscitation and manage electrolyte abnormalities.
- If urate-lowering therapy is part of local hospital guidelines for TLS management, consider a single dose regimen of rasburicase utilizing shared decision-making.
CONCLUSION
Tumor lysis syndrome remains a metabolic emergency that requires rapid diagnosis and management to prevent morbidity and mortality. Current data show rasburicase rapidly decreases PUA compared to allopurinol. However, the current literature does not provide compelling evidence that rapidly lowering uric acid with rasburicase to prevent TLS or to treat AKI secondary to TLS improves patient-oriented outcomes.
Do you think this is a low-value practice? Is this truly a “Thing We Do for No Reason™”? Share what you do in your practice and join in the conversation online by retweeting it on Twitter (#TWDFNR) and liking it on Facebook. We invite you to propose ideas for other “Things We Do for No Reason™” topics by emailing TWDFNR@hospitalmedicine.org
1. Howard SC, Jones DP, Pui CH. The tumor lysis syndrome. N Engl J Med.2011;364(19):1844-1854. https://doi.org/10.1056/nejmra0904569
2. Cairo MS, Coiffier B, Reiter A, Younes A; TLS Expert Panel. Recommendations for the evaluation of risk and prophylaxis of tumour lysis syndrome (TLS) in adults and children with malignant diseases: an expert TLS panel consensus. Br J Haematol. 2010;149(4):578-586. https://doi.org/10.1111/j.1365-2141.2010.08143.x
3. Cairo MS, Bishop M. Tumour lysis syndrome: new therapeutic strategies and classification. Br J Haematol.. 2004;127(1):3-11. https://doi.org/10.1111/j.1365-2141.2004.05094.x
4. Durani U, Shah ND, Go RS. In-hospital outcomes of tumor lysis syndrome: a population-based study using the National Inpatient Sample. Oncologist. 2017;22(12):1506-1509. https://doi.org/10.1634/theoncologist.2017-0147
5. Dinnel J, Moore BL, Skiver BM, Bose P. Rasburicase in the management of tumor lysis: an evidence-based review of its place in therapy. Core Evid.. 2015;10:23-38. https://doi.org/10.2147/ce.s54995
6. Goldman SC, Holcenberg JS, Finklestein JZ, et al. A randomized comparison between rasburicase and allopurinol in children with lymphoma or leukemia at high risk for tumor lysis. Blood. 2001;97(10):2998-3003. https://doi.org/10.1182/blood.v97.10.2998
7. Haslam A, Hey SP, Gill J, Prasad V. A systematic review of trial-level meta-analyses measuring the strength of association between surrogate end-points and overall survival in oncology. Eur J Cancer. 1990. 2019;106:196-211. https://doi.org/10.1016/j.ejca.2018.11.012
8. Lopez-Olivo MA, Pratt G, Palla SL, Salahudeen A. Rasburicase in tumor lysis syndrome of the adult: a systematic review and meta-analysis. Am J Kidney Dis. 2013;62(3):481-492. https://doi.org/10.1053/j.ajkd.2013.02.378
9. Cortes J, Moore JO, Maziarz RT, et al. Control of plasma uric acid in adults at risk for tumor lysis syndrome: efficacy and safety of rasburicase alone and rasburicase followed by allopurinol compared with allopurinol alone—results of a multicenter phase III study. J Clin Oncol. 2010;28(27):4207-4213. https://doi.org/10.1200/jco.2009.26.8896
10. Martens KL, Khalighi PR, Li S, et al. Comparative effectiveness of rasburicase versus allopurinol for cancer patients with renal dysfunction and hyperuricemia. Leuk Res. 2020;89:106298. https://doi.org/10.1016/j.leukres.2020.106298
11. Personett HA, Barreto EF, McCullough K, Dierkhising R, Leung N, Habermann TM. Impact of early rasburicase on incidence and outcomes of clinical tumor lysis syndrome in lymphoma. Blood. 2019;60(9)2271-2277. https://doi.org/10.1080/10428194.2019.1574000
12. Howard SC, Cockerham AR, Yvonne Barnes DN, Ryan M, Irish W, Gordan L. Real-world analysis of outpatient rasburicase to prevent and manage tumor lysis syndrome in newly diagnosed adults with leukemia or lymphoma. J Clin Pathways. 2020;6(2):46-51.
13. Abu-Hashyeh AM, Shenouda M, Al-Sharedi M. The efficacy of cost-effective fixed dose of rasburicase compared to weight-based dose in treatment and prevention of tumor lysis syndrome (TLS). J Natl Compr Canc Netw. 2020;18(3.5):QIM20-119. https://doi.org/10.6004/jnccn.2019.7516
14. Patel KK, Brown TJ, Gupta A, et al. Decreasing inappropriate use of rasburicase to promote cost-effective care. J Oncol Pract. 2019;15(2):e178-e186. https://doi.org/10.1200/jop.18.00528
15. Khalighi PR, Martens KL, White AA, et al. Utilization patterns and clinical outcomes of rasburicase administration according to tumor risk stratification. J Oncol Pharm Pract. 2020;26(3):529-535. https://doi.org/10.1177/1078155219851543
16. Elitek. Prescribing information. Sanofi-Aventis U.S., LLC; 2019. Accessed June 1, 2021. https://products.sanofi.us/elitek/Elitek.html
17. Allopurinol. Drugs & Diseases. Medscape. Accessed June 1, 2021. https://reference.medscape.com/drug/zyloprim-aloprim-allopurinol-342811
18. Jones GL, Will A, Jackson GH, Webb NJA, Rule S; British Committee for Standards in Haematology. Guidelines for the management of tumour lysis syndrome in adults and children with haematological malignancies on behalf of the British Committee for Standards in Haematology. Br J Haematol. 2015;169(5):661‐671. https://doi.org/10.1111/bjh.13403
19. Boutin A, Blackman A, O’Sullivan DM, Forcello N. The value of fixed rasburicase dosing versus weight-based dosing in the treatment and prevention of tumor lysis syndrome. J Oncol Pharm Pract. 2019;25(3):577-583. https://doi.org/10.1177/1078155217752075
Inspired by the ABIM Foundation’s Choosing Wisely ® campaign, the “Things We Do for No Reason™” (TWDFNR) series reviews practices that have become common parts of hospital care but may provide little value to our patients. Practices reviewed in the TWDFNR series do not represent clear-cut conclusions or clinical practice standards but are meant as a starting place for research and active discussions among hospitalists and patients. We invite you to be part of that discussion.
A 35-year-old man with a history of diffuse large B-cell lymphoma (DLBCL), who most recently received treatment 12 months earlier, presents to the emergency department with abdominal pain and constipation. A computed tomography scan of the abdomen reveals retroperitoneal and mesenteric lymphadenopathy causing small bowel obstruction. The basic metabolic panel reveals a creatinine of 1.1 mg/dL, calcium of 8.5 mg/dL, phosphorus of 4 mg/dL, potassium of 4.5 mEq/L, and uric acid of 7.3 mg/dL. The admitting team contemplates using allopurinol or rasburicase for tumor lysis syndrome (TLS) prevention in the setting of recurrent DLBCL.
BACKGROUND
Tumor lysis syndrome is characterized by metabolic derangement and end-organ damage in the setting of cytotoxic chemotherapy, chemosensitive malignancy, and/or increased tumor burden.1 Risk stratification for TLS takes into account patient and disease characteristics (Table 1). Other risk factors include tumor bulk, elevated baseline serum lactate dehydrogenase, and certain types of chemotherapy (eg, cisplatin, cytarabine, etoposide, paclitaxel, cytotoxic therapies), immunotherapy, or targeted therapy.2 Elevated serum levels of uric acid, potassium, and phosphorus, as well as preexisting renal dysfunction, predispose patients to clinical TLS.3
The Cairo-Bishop classification system is most frequently used to diagnose TLS (Table 2).3 Laboratory features include hyperkalemia, hyperphosphatemia, hyperuricemia, and hypocalcemia secondary to lysis of proliferating tumor cells and their nuclei. Clinical features include arrhythmias, seizures, and acute kidney injury (AKI).1 Acute kidney injury, the most common clinical complication of TLS, results from crystallization of markedly elevated plasma uric acid, leading to tubular obstruction.1,4 The development of AKI can predict morbidity (namely, the need for renal replacement therapy [RRT]) and mortality in this patient population.1
Stratifying a patient’s baseline risk of developing TLS often dictates the prevention and management plan. Therapeutic prophylaxis and management strategies for TLS include aggressive fluid resuscitation, diuresis, plasma uric acid (PUA) levels, monitoring electrolyte levels, and, in certain life-threatening situations, dialysis. Oncologists presume reducing uric acid levels prevents and treats TLS.
Current methods to reduce PUA as a means of preventing or treating TLS include xanthine oxidase inhibitors (eg, allopurinol) or urate oxidase (eg, rasburicase). Before the US Food and Drug Administration’s (FDA) approval of rasburicase to manage TLS, providers combined allopurinol (a purine analog that inhibits the enzyme xanthine oxidase, decreasing uric acid level) with aggressive fluid resuscitation. Approved by the FDA in 2002, rasburicase offers an alternative treatment for hyperuricemia by directly decreasing levels of uric acid instead of merely preventing the increased formation of uric acid. As a urate oxidase, rasburicase converts uric acid to the non-nephrotoxic, water-soluble, and freely excreted allantoin.
WHY YOU MIGHT THINK YOU SHOULD USE URATE OXIDASE IN TUMOR LYSIS SYNDROME FOR THE PREVENTION AND MANAGEMENT OF ACUTE KIDNEY INJURY
Rasburicase is often considered the standard-of-care treatment for hyperuricemia due to its ability to reduce circulating uric acid levels rapidly. The primary goal of uric acid reduction is to prevent the occurrence of AKI.
Based upon bioplausible relevance to clinically meaningful endpoints, researchers selected PUA reduction as the primary outcome in randomized controlled trials (RCTs) and observational studies to justify treatment with rasburicase. In RCTs, compassionate trials, and systematic reviews and meta-analyses, rasburicase demonstrated a more rapid reduction in uric acid levels compared to allopurinol.5 Specifically, in one study by Goldman et al,6 rasburicase decreased baseline uric acid levels in pediatric oncology patients by 86% (statistically significant) 4 hours after administration, compared to allopurinol, which only reduced baseline uric acid by 12%. According to a study by Cairo et al, allopurinol may take up to 1 day to reduce PUA.3
WHY URATE OXIDASE MAY NOT IMPROVE CLINICAL OUTCOMES IN PATIENTS AT RISK FOR OR WITH TUMOR LYSIS SYNDROME
Randomized controlled trials examining the safety, efficacy, and cost-effectiveness of rasburicase in adult patients remain sparse. Both RCTs and systematic reviews and meta-analyses rely on PUA levels as a surrogate endpoint and fail to include clinically meaningful primary endpoints (eg, change in baseline creatinine or need for RRT), raising the question as to whether rasburicase improves patient-centered outcomes.5 Since previous studies in the oncology literature show low or modest correlations between PUA reduction and patient-oriented outcomes, we must question whether PUA reduction serves as a meaningful surrogate endpoint.
Treatment of Tumor Lysis Syndrome
Two meta-analyses focusing on the treatment of TLS by Dinnel et al5 and Lopez-Olivo et al8 each included only three unique RCTs (two of the three RCTs were referenced in both meta-analyses). Moreover, both studies included only one RCT comparing rasburicase directly to allopurinol (a 2010 RCT by Cortes et al9) while the other RCTs compared the impact of different rasburicase dosing regimens. Researchers powered the head-to-head RCT by Cortes et al9 to detect a difference in PUA levels across three different arms: rasburicase, rasburicase plus allopurinol, or allopurinol alone. All three treatment arms resulted in a statistically significant reduction in serum PUA levels (87%, 78%, 66%, respectively; P = .001) without a change in the secondary, underpowered clinical outcomes such as clinical TLS or reduced renal function (defined in this study as increased creatinine, renal failure/impairment, or acute renal failure).
More recently, retrospective analyses of patients with AKI secondary to TLS found no difference in creatinine improvement, renal recovery, or prevention of RRT based on whether the patients received either rasburicase or allopurinol.10,11 While rasburicase is associated with greater PUA reduction compared to allopurinol, according to meaningful RCT and observational data as discussed previously and described further in the following section, this does not translate to clinically important risk reduction.
Prevention of Tumor Lysis Syndrome
Furthermore, there exists little compelling evidence to support the use of rasburicase for preventing AKI secondary to TLS. Even among patients at high-risk for TLS (the only group for whom rasburicase is currently recommended),5 rasburicase does not definitively prevent AKI. Data suggest that despite lowering uric acid levels, rasburicase does not consistently prevent renal injury11 or decrease the total number of subsequent inpatient days.12 The only phase 3 trial that compared the efficacy of rasburicase to allopurinol for the prevention of TLS and included clinically meaningful endpoints (eg, renal failure) found that, while rasburicase reduced uric acid levels faster than allopurinol, it did not decrease rates of clinical TLS.9
The published literature offers limited efficacy data of rasburicase in preventing TLS in low-risk patients; however, the absence of benefit of rasburicase in preventing renal failure in high-risk patients warrants skepticism as to its potential efficacy in low-risk patients.8,10
Costs-Effectiveness and Other Ethical Considerations
Rasburicase is an expensive treatment. The estimated cost of the FDA-recommended dosing is around $37,500.13 Moreover, studies comparing the cost-effectiveness of rasburicase to allopurinol focus primarily on patients at high-risk for TLS, which overestimates the cost-effectiveness of rasburicase in patients at low-to-intermediate risk for TLS.14,15 Unfortunately, some providers inappropriately prescribe rasburicase regularly to patients at low or intermediate risk for TLS. Based on observational studies of rasburicase in various clinical scenarios, including inpatient and emergency department settings, inappropriate use of rasburicase (eg, in the setting of hyperuricemia without evidence of a high-risk TLS tumor, no prior trial of allopurinol, preserved renal function, no laboratory evaluation) ranges from 32% to 70%.14,15
Finally, while <1% of patients experience rasburicase-induced anaphylaxis, 20% to 50% of patients develop gastrointestinal symptoms and viral-syndrome-like symptoms.16 Meanwhile, major side effects from allopurinol that occur with 1% to 10% frequency include maculopapular rash, pruritis, gout, nausea, vomiting, and renal failure syndrome.17 Even if the cost for rasburicase and allopurinol were similar, the lack of improved efficacy and the side-effect profiles of the two medications should make us question whether to prescribe rasburicase preferentially over allopurinol.
WHEN MIGHT URATE OXIDASE BE HELPFUL IN TUMOR LYSIS SYNDROME
While some experts recommend rasburicase prophylaxis in patients at high risk for developing TLS, such recommendations rely on low-quality evidence.2 When prescribing rasburicase, the hospitalist must ensure correct dosing. The FDA approved rasburicase for weight-based dosing at 0.2 mg/kg, though current evidence favors a single, fixed dose of 3 mg.16,17 Compared to weight-based dosing, which has an estimated cost-effectiveness ratio ranging from $27,982.77 to $119,643.59 per quality-adjusted life-year, single dosing has equivalent efficacy at approximately 50% lower cost per dose.11,17,18
WHAT YOU SHOULD DO INSTEAD
As a preventive treatment for TLS, clinicians should only consider prescribing rasburicase as a single fixed dose of 3 mg to high-risk patients.17 In the event of AKI secondary to TLS, clinicians should proceed with the mainstay treatment of resuscitation with aggressive fluid resuscitation, with a goal urine output of at least 2 mL/kg/h.1 Fluid resuscitation should be used cautiously in patients with oliguric or anuric AKI, pulmonary hypertension, congestive heart failure, and hemodynamically significant valvular disease. Clinicians should provide continuous cardiac monitoring during the initial presentation to monitor for electrocardiographic changes in the setting of hyperkalemia and hypocalcemia, and they should consult nephrology, oncology, and critical care services early in the disease course to maximize coordination of care.
RECOMMENDATIONS
Prevention
- Identify patients at high-risk of TLS (Table 1) and consider a single 3-mg dose of rasburicase.
- Manage low- and intermediate-risk patients with allopurinol and hydration.
Treatment
- Identify patients with TLS using the clinical and laboratory findings outlined in the Cairo-Bishop classification system (Table 2).
- Initiate aggressive fluid resuscitation and manage electrolyte abnormalities.
- If urate-lowering therapy is part of local hospital guidelines for TLS management, consider a single dose regimen of rasburicase utilizing shared decision-making.
CONCLUSION
Tumor lysis syndrome remains a metabolic emergency that requires rapid diagnosis and management to prevent morbidity and mortality. Current data show rasburicase rapidly decreases PUA compared to allopurinol. However, the current literature does not provide compelling evidence that rapidly lowering uric acid with rasburicase to prevent TLS or to treat AKI secondary to TLS improves patient-oriented outcomes.
Do you think this is a low-value practice? Is this truly a “Thing We Do for No Reason™”? Share what you do in your practice and join in the conversation online by retweeting it on Twitter (#TWDFNR) and liking it on Facebook. We invite you to propose ideas for other “Things We Do for No Reason™” topics by emailing TWDFNR@hospitalmedicine.org
1. Howard SC, Jones DP, Pui CH. The tumor lysis syndrome. N Engl J Med.2011;364(19):1844-1854. https://doi.org/10.1056/nejmra0904569
2. Cairo MS, Coiffier B, Reiter A, Younes A; TLS Expert Panel. Recommendations for the evaluation of risk and prophylaxis of tumour lysis syndrome (TLS) in adults and children with malignant diseases: an expert TLS panel consensus. Br J Haematol. 2010;149(4):578-586. https://doi.org/10.1111/j.1365-2141.2010.08143.x
3. Cairo MS, Bishop M. Tumour lysis syndrome: new therapeutic strategies and classification. Br J Haematol.. 2004;127(1):3-11. https://doi.org/10.1111/j.1365-2141.2004.05094.x
4. Durani U, Shah ND, Go RS. In-hospital outcomes of tumor lysis syndrome: a population-based study using the National Inpatient Sample. Oncologist. 2017;22(12):1506-1509. https://doi.org/10.1634/theoncologist.2017-0147
5. Dinnel J, Moore BL, Skiver BM, Bose P. Rasburicase in the management of tumor lysis: an evidence-based review of its place in therapy. Core Evid.. 2015;10:23-38. https://doi.org/10.2147/ce.s54995
6. Goldman SC, Holcenberg JS, Finklestein JZ, et al. A randomized comparison between rasburicase and allopurinol in children with lymphoma or leukemia at high risk for tumor lysis. Blood. 2001;97(10):2998-3003. https://doi.org/10.1182/blood.v97.10.2998
7. Haslam A, Hey SP, Gill J, Prasad V. A systematic review of trial-level meta-analyses measuring the strength of association between surrogate end-points and overall survival in oncology. Eur J Cancer. 1990. 2019;106:196-211. https://doi.org/10.1016/j.ejca.2018.11.012
8. Lopez-Olivo MA, Pratt G, Palla SL, Salahudeen A. Rasburicase in tumor lysis syndrome of the adult: a systematic review and meta-analysis. Am J Kidney Dis. 2013;62(3):481-492. https://doi.org/10.1053/j.ajkd.2013.02.378
9. Cortes J, Moore JO, Maziarz RT, et al. Control of plasma uric acid in adults at risk for tumor lysis syndrome: efficacy and safety of rasburicase alone and rasburicase followed by allopurinol compared with allopurinol alone—results of a multicenter phase III study. J Clin Oncol. 2010;28(27):4207-4213. https://doi.org/10.1200/jco.2009.26.8896
10. Martens KL, Khalighi PR, Li S, et al. Comparative effectiveness of rasburicase versus allopurinol for cancer patients with renal dysfunction and hyperuricemia. Leuk Res. 2020;89:106298. https://doi.org/10.1016/j.leukres.2020.106298
11. Personett HA, Barreto EF, McCullough K, Dierkhising R, Leung N, Habermann TM. Impact of early rasburicase on incidence and outcomes of clinical tumor lysis syndrome in lymphoma. Blood. 2019;60(9)2271-2277. https://doi.org/10.1080/10428194.2019.1574000
12. Howard SC, Cockerham AR, Yvonne Barnes DN, Ryan M, Irish W, Gordan L. Real-world analysis of outpatient rasburicase to prevent and manage tumor lysis syndrome in newly diagnosed adults with leukemia or lymphoma. J Clin Pathways. 2020;6(2):46-51.
13. Abu-Hashyeh AM, Shenouda M, Al-Sharedi M. The efficacy of cost-effective fixed dose of rasburicase compared to weight-based dose in treatment and prevention of tumor lysis syndrome (TLS). J Natl Compr Canc Netw. 2020;18(3.5):QIM20-119. https://doi.org/10.6004/jnccn.2019.7516
14. Patel KK, Brown TJ, Gupta A, et al. Decreasing inappropriate use of rasburicase to promote cost-effective care. J Oncol Pract. 2019;15(2):e178-e186. https://doi.org/10.1200/jop.18.00528
15. Khalighi PR, Martens KL, White AA, et al. Utilization patterns and clinical outcomes of rasburicase administration according to tumor risk stratification. J Oncol Pharm Pract. 2020;26(3):529-535. https://doi.org/10.1177/1078155219851543
16. Elitek. Prescribing information. Sanofi-Aventis U.S., LLC; 2019. Accessed June 1, 2021. https://products.sanofi.us/elitek/Elitek.html
17. Allopurinol. Drugs & Diseases. Medscape. Accessed June 1, 2021. https://reference.medscape.com/drug/zyloprim-aloprim-allopurinol-342811
18. Jones GL, Will A, Jackson GH, Webb NJA, Rule S; British Committee for Standards in Haematology. Guidelines for the management of tumour lysis syndrome in adults and children with haematological malignancies on behalf of the British Committee for Standards in Haematology. Br J Haematol. 2015;169(5):661‐671. https://doi.org/10.1111/bjh.13403
19. Boutin A, Blackman A, O’Sullivan DM, Forcello N. The value of fixed rasburicase dosing versus weight-based dosing in the treatment and prevention of tumor lysis syndrome. J Oncol Pharm Pract. 2019;25(3):577-583. https://doi.org/10.1177/1078155217752075
© 2021 Society of Hospital Medicine
Debriefing During a Mental Health Crisis
In the wake of the COVID-19 pandemic, hospitals across the country face a crisis in identifying resources for the surging needs of patients with mental health conditions. Compared with 2019, survey and utilization data from 2020 suggest an increase in suicidal ideation and other symptoms among adults,1 and an escalation in mental health-related visits to pediatric emergency departments, respectively.2 Unfortunately, mental health resources have dwindled during this period. Available inpatient psychiatric beds and 24-hour residential treatment beds—already on the decline over the past 5 years—have been massively affected by the pandemic due to capacity constraints and facility closures.3
These factors have placed general medical hospitals (hospitals) at the front lines of a mental health crisis4 for which most are ill prepared. Indeed, once a patient with acute mental health needs is “medically cleared,” they must wait for an available bed at a psychiatric or residential treatment facility.3 This waiting period often delays necessary patient care, as most consultation-liaison psychiatry models are not designed to provide intensive services.5
This waiting period can also place hospital staff in unfamiliar and potentially unsafe scenarios related to physical and psychological stressors. Staff may encounter patient behaviors that risk harm to patients and staff (ie, behavioral crisis events), which may require seclusion (ie, confinement to a locked room) or restraints (chemical, physical, and mechanical). Even in inpatient psychiatric units, an estimated 70% of nurses have been assaulted at least once during their career.6 Such violent behaviors and the interventions required to subdue them can be traumatizing for both patients and staff.7 In fact, the “cost of caring” may be higher for mental health nurses, who often suffer from secondary posttraumatic stress.8 Staff lacking mental health training may encounter additional stressors from feeling powerless to help their patients.
Facing this crisis, hospitals must develop a strategic response that encompasses the needs of both patients and staff. Beyond intensive interventions (eg, additional staffing resources), this response should include lower-effort interventions. In this perspective, we review two debriefing practices—clinical event debriefing and psychological debriefing—that hospitals can feasibly implement during this crisis. These respective practices can ensure safe and effective care of patients by reducing use of restraints and seclusion while also providing crucial support for staff.
CLINICAL EVENT DEBRIEFING
Broadly defined as a facilitated discussion of significant clinical events, clinical event debriefing (CED) can improve both individual and team performance in resuscitation events and patient outcomes.9-11 While CED is often utilized for clinical deterioration events, it can also apply to behavioral crises in a diversity of settings.6
In recent decades, researchers have developed several frameworks for reducing seclusion and restraint practices in psychiatric care settings.6 A common framework is Huckshorn’s Six Core Strategies,6,12,13 which can reduce seclusion and restraint use14 and is feasible to implement.15 This framework advocates for an immediate CED following behavioral crisis events. A unit supervisor or senior staff member not involved in the event should lead the CED, which has several goals. The first priorities, however, are ensuring the physical safety of all staff and returning the unit to normal operations. More broadly, the CED group should review event documentation and interview staff who were present at the time of the event. These processes can help identify antecedents as well as short- and long-term practices, systems, and environmental modifications to prevent reoccurence.12 However, little is known about this practice outside of inpatient psychiatric units.
Our pediatric hospital implemented a CED process in our medical behavioral unit (MBU), a 10-bed unit designed for patients with comorbid mental health needs requiring a higher level of psychosocial resources. The MBU is not an inpatient psychiatric unit, yet more than 50% of patients admitted to the MBU at any given time are hospitalized with a primary psychiatric diagnosis requiring intensive services due to a lack of resources in the community.
Preventing use of restraints is an institutional priority for all areas of our hospital. To reduce restraint use in the MBU, staff are asked to perform immediate CED following behavioral crisis events. This process involves both clinical (eg, nurses, physicians, psychiatric technicians) and nonclinical staff (eg, unit clerks, security officers). All staff involved in the event are invited to attend. A senior staff member not involved in the event typically organizes and leads the CED. The group uses a facilitative guide to (1) review the patient’s history; (2) identify potential triggers for the event; (3) reflect on areas of strength and weakness in unit response; (4) identify systems issues impacting the patient or the unit response; and (5) generate a strategy to prevent reoccurrence. The process is designed to take 5 to 10 minutes. The guide also serves as a data collection tool that unit leaders use to screen for generalizable learnings and improvement ideas (Appendix). For example, if a behavioral trigger is identified for a patient, unit leaders disseminate this information to create situational awareness and to ensure care plans are updated.
PSYCHOLOGICAL DEBRIEFING
Psychological debriefing is an application of Critical Incident Stress Management, a comprehensive approach that was developed in the 1970s to help emergency service workers process the thoughts and emotions arising from their exposure to trauma in their work.8,16 More recently, it has become a standard practice in many settings, including healthcare. Notably, psychological debriefing and event debriefing are often conflated. While not mutually exclusive, psychological debriefing has the unique aim of providing support to groups who work together in stressful situations.
Strategies for psychological debriefing are less well described in healthcare. However, our hospital has found it to be a useful tool for MBU staff. Operationally, this process takes the form of a weekly multidisciplinary team meeting with unit clinical staff. Typically, a psychologist or social worker initiates this meeting, which is held at a dedicated time and in a protected space. Discussion centers on patients who have been admitted to the unit for more than 30 days. A goal of the meeting is to review and update patient care plans, but there is also an important goal of emotional processing (Appendix).
In this meeting, staff reflect collectively on the unique stressors they encounter in their work, and they generate situational awareness and potential interventions for these stressors. The psychosocial providers often share recommendations, such as strategies to promote effective communication with patients and families. Peer support is a major component of this meeting and is often utilized to navigate stressful situations, such as disagreements with families regarding behavioral management. Staff also review and reinforce the Positive Behavioral Interventions and Supports framework—a preventive framework that can reduce seclusion and restraint use in pediatric psychiatric units, among other positive outcomes.17 This framework includes setting expectations for patients and families regarding behaviors on the unit. In reviewing these guidelines, staff are encouraged to recognize and report inappropriate behaviors (from patients or families) that can be traumatizing, especially over prolonged hospitalizations. This framework also provides a common language for staff to express behavioral expectations in a positive manner (eg, “Let’s use our walking feet” rather than “No running”). Overall, staff view this meeting as a resilience-building activity that empowers them in their routine work.
IMPLEMENTATION CONSIDERATIONS
While the MBU is a specialized unit with dedicated psychosocial resources, the debriefing practices we describe can be translated to multiple care settings. However, successful implementation relies on intentional process design. First, debriefing indications must be made clear to staff (eg, events of restraint). There should be a role or group accountable for organizing and leading debriefings, which should be held at a time that promotes participation from frontline staff,particularly for CED. Debriefings—especially psychological debriefings—should be held in a protected space. They should have a clear organization, such as use of a survey-based debriefing guide that allows for data collection. Importantly, there should be a unit or hospital leader accountable for disseminating learnings and improvement ideas to relevant staff and ensuring action items are completed. Finally, accountable leaders should evaluate the process’ feasibility, efficacy, and sustainability to inform implementation.
Hospitals must also consider how to train debriefing leaders to facilitate difficult conversations. Some hospitals may have formal communication training programs, but it may also be helpful to leverage the skills of social workers and psychosocial staff.
OTHER CONSIDERATIONS
Debriefing relies on a climate in which staff of diverse backgrounds and professional status feel comfortable speaking up. Psychological safety is critical in any crisis, and hospital leaders should consider how to make staff feel comfortable during this mental health crisis.18 Leaders must also be prepared to support staff beyond debriefing if resources are required for secondary posttraumatic stress, burnout, or compassion fatigue.8,19,20 Employee assistance programs may be a useful resource.
CONCLUSION
Debriefing practices can help hospitals contend with the unique challenges facing patients and staff in a mental health crisis. While debriefing may vary based on need and setting, hospitals should consider CED as a strategy for reducing seclusion and restraint use, which adversely impact patients and staff. Psychological debriefing can also help staff mitigate the psychosocial stressors of their work.
1. Czeisler MÉ, Lane RI, Petrosky E, et al. Mental health, substance use, and suicidal ideation during the COVID-19 pandemic—United States, June 24–30, 2020. MMWR Morb Mortal Wkly Rep. 2020;69:1049-1057. https://doi.org/10.15585/mmwr.mm6932a1
2. Leeb RT, Bitsko RH, Radhakrishnan L, et al. Mental health–related emergency department visits among children aged <18 years during the COVID-19 pandemic—United States, January 1–October 17, 2020. MMWR Morb Mortal Wkly Rep. 2020;69:1675-1680. https://doi.org/10.15585/mmwr.mm6945a3
3. Rapoport R. ‘Every day is an emergency’: The pandemic is worsening psychiatric bed shortages nationwide. Stat News. December 23, 2020. Accessed January 22, 2021. https://www.statnews.com/2020/12/23/mental-health-covid19-psychiatric-beds/
4. A step to ease the pandemic mental health crisis. Scientific American. February 1, 2021. Accessed April 14, 2021. https://www.scientificamerican.com/article/a-step-to-ease-the-pandemic-mental-health-crisis/
5. Sharpe M, Toynbee M, Walker J. Proactive Integrated Consultation-Liaison Psychiatry: A new service model for the psychiatric care of general hospital inpatients. Gen Hosp Psych. 2020;66:9-15. https://doi.org/10.1016/j.genhosppsych.2020.06.005
6. Mangaoil RA, Cleverley K, Peter E. Immediate staff debriefing following seclusions or restraint use in inpatient mental health settings: a scoping review. Clin Nurs Res. 2020;29(7):479-495. https://doi.org/10.1177/1054773818791085
7. Needham I, Abderhalden C, Zeller A, et al. The effect of a training course on nursing students’ attitudes toward, perceptions of, and confidence in managing patient aggression. J Nurs Educ. 2005;44:415-420.
8. Missouridou E. Secondary posttraumatic stress and nurses’ emotional responses to patient’s trauma. J Trauma Nurs. 2017;24(2):110-115. https://doi.org/10.1097/JTN.0000000000000274
9. Blankenship BAC, Fernandez RP, Joy BF, et al. Multidisciplinary review of code events in a heart center. Am J Crit Care. 2016;25(4):90-98. https://doi.org/10.4037/ajcc2016302
10. Wolfe H, Zebuhr C, Topjian AA, et al. Interdisciplinary ICU cardiac arrest debriefing improves survival outcomes. Crit Care Med. 2014;42(7):1688-1695. https://doi.org/10.1097/CCM.0000000000000327
11. Tannenbaum SI, Cerasoli CP. Do team and individual debriefs enhance performance? A meta-analysis. Hum Factors. 2013;55(1):231-245. https://doi.org/10.1177/0018720812448394
12. Huckshorn KA. Reducing seclusion restraint in mental health use settings: core strategies for prevention. J Psychosoc Nurs Ment Health Serv. 2004;42:22-33.
13. Goulet MH, Larue C, Dumais A. Evaluation of seclusion and restraint reduction programs in mental health: a systematic review. Agress Violent Behav. 2017;34:139-146. https://doi.org/10.1016/j.avb.2017.01.019
14. Azeem MW, Aujila A, Rammerth M, et al, Effectiveness of six core strategies based on trauma informed care in reducing seclusions and restraints at a child and adolescent psychiatric hospital. J Child Adolesc Psychiatr Nurs. 2011;24:11-15. https://doi.org/10.1111/jcap.12190
15. Wieman DA, Camacho-Gonsalves T, Huckshorn KA, et al. Multisite study of an evidence-based practice to reduce seclusion and restraint in psychiatric inpatient facilities. Psychiatr Serv. 2014;65(3):345-351. https://doi.org/10.1176/appi.ps.201300210
16. Everly GS. A primer on critical incident stress management: what’s really in a name? Int J Emerg Ment Health. 1999;1(2):77-79.
17. Reynolds EK, Grados MA, Praglowski N, et al. Use of modified positive behavioral interventions and supports in a psychiatric inpatient unit for high-risk youths. Psychiatr Serv. 2016;67(5):570-573. https://doi.org/10.1176/appi.ps.201500039
18. Devaraj LR, Cooper C, Begin AS. Creating psychological safety on medical teams in times of crisis. J Hosp Med. 2021;16(1):47-49. https://doi.org/10.12788/jhm.3541
19. Bride BE, Radey M, Figley CR. Measuring compassion fatigue. Clin Soc Work J. 2007;35:155-163. https://doi.org/10.1007/s10615-007-0091-7
20. Figley CR. Compassion fatigue: psychotherapists’ lack of self care. J Clin Psychol. 2002;58(11):1433-1441. https://doi.org/10.1002/jclp.10090
In the wake of the COVID-19 pandemic, hospitals across the country face a crisis in identifying resources for the surging needs of patients with mental health conditions. Compared with 2019, survey and utilization data from 2020 suggest an increase in suicidal ideation and other symptoms among adults,1 and an escalation in mental health-related visits to pediatric emergency departments, respectively.2 Unfortunately, mental health resources have dwindled during this period. Available inpatient psychiatric beds and 24-hour residential treatment beds—already on the decline over the past 5 years—have been massively affected by the pandemic due to capacity constraints and facility closures.3
These factors have placed general medical hospitals (hospitals) at the front lines of a mental health crisis4 for which most are ill prepared. Indeed, once a patient with acute mental health needs is “medically cleared,” they must wait for an available bed at a psychiatric or residential treatment facility.3 This waiting period often delays necessary patient care, as most consultation-liaison psychiatry models are not designed to provide intensive services.5
This waiting period can also place hospital staff in unfamiliar and potentially unsafe scenarios related to physical and psychological stressors. Staff may encounter patient behaviors that risk harm to patients and staff (ie, behavioral crisis events), which may require seclusion (ie, confinement to a locked room) or restraints (chemical, physical, and mechanical). Even in inpatient psychiatric units, an estimated 70% of nurses have been assaulted at least once during their career.6 Such violent behaviors and the interventions required to subdue them can be traumatizing for both patients and staff.7 In fact, the “cost of caring” may be higher for mental health nurses, who often suffer from secondary posttraumatic stress.8 Staff lacking mental health training may encounter additional stressors from feeling powerless to help their patients.
Facing this crisis, hospitals must develop a strategic response that encompasses the needs of both patients and staff. Beyond intensive interventions (eg, additional staffing resources), this response should include lower-effort interventions. In this perspective, we review two debriefing practices—clinical event debriefing and psychological debriefing—that hospitals can feasibly implement during this crisis. These respective practices can ensure safe and effective care of patients by reducing use of restraints and seclusion while also providing crucial support for staff.
CLINICAL EVENT DEBRIEFING
Broadly defined as a facilitated discussion of significant clinical events, clinical event debriefing (CED) can improve both individual and team performance in resuscitation events and patient outcomes.9-11 While CED is often utilized for clinical deterioration events, it can also apply to behavioral crises in a diversity of settings.6
In recent decades, researchers have developed several frameworks for reducing seclusion and restraint practices in psychiatric care settings.6 A common framework is Huckshorn’s Six Core Strategies,6,12,13 which can reduce seclusion and restraint use14 and is feasible to implement.15 This framework advocates for an immediate CED following behavioral crisis events. A unit supervisor or senior staff member not involved in the event should lead the CED, which has several goals. The first priorities, however, are ensuring the physical safety of all staff and returning the unit to normal operations. More broadly, the CED group should review event documentation and interview staff who were present at the time of the event. These processes can help identify antecedents as well as short- and long-term practices, systems, and environmental modifications to prevent reoccurence.12 However, little is known about this practice outside of inpatient psychiatric units.
Our pediatric hospital implemented a CED process in our medical behavioral unit (MBU), a 10-bed unit designed for patients with comorbid mental health needs requiring a higher level of psychosocial resources. The MBU is not an inpatient psychiatric unit, yet more than 50% of patients admitted to the MBU at any given time are hospitalized with a primary psychiatric diagnosis requiring intensive services due to a lack of resources in the community.
Preventing use of restraints is an institutional priority for all areas of our hospital. To reduce restraint use in the MBU, staff are asked to perform immediate CED following behavioral crisis events. This process involves both clinical (eg, nurses, physicians, psychiatric technicians) and nonclinical staff (eg, unit clerks, security officers). All staff involved in the event are invited to attend. A senior staff member not involved in the event typically organizes and leads the CED. The group uses a facilitative guide to (1) review the patient’s history; (2) identify potential triggers for the event; (3) reflect on areas of strength and weakness in unit response; (4) identify systems issues impacting the patient or the unit response; and (5) generate a strategy to prevent reoccurrence. The process is designed to take 5 to 10 minutes. The guide also serves as a data collection tool that unit leaders use to screen for generalizable learnings and improvement ideas (Appendix). For example, if a behavioral trigger is identified for a patient, unit leaders disseminate this information to create situational awareness and to ensure care plans are updated.
PSYCHOLOGICAL DEBRIEFING
Psychological debriefing is an application of Critical Incident Stress Management, a comprehensive approach that was developed in the 1970s to help emergency service workers process the thoughts and emotions arising from their exposure to trauma in their work.8,16 More recently, it has become a standard practice in many settings, including healthcare. Notably, psychological debriefing and event debriefing are often conflated. While not mutually exclusive, psychological debriefing has the unique aim of providing support to groups who work together in stressful situations.
Strategies for psychological debriefing are less well described in healthcare. However, our hospital has found it to be a useful tool for MBU staff. Operationally, this process takes the form of a weekly multidisciplinary team meeting with unit clinical staff. Typically, a psychologist or social worker initiates this meeting, which is held at a dedicated time and in a protected space. Discussion centers on patients who have been admitted to the unit for more than 30 days. A goal of the meeting is to review and update patient care plans, but there is also an important goal of emotional processing (Appendix).
In this meeting, staff reflect collectively on the unique stressors they encounter in their work, and they generate situational awareness and potential interventions for these stressors. The psychosocial providers often share recommendations, such as strategies to promote effective communication with patients and families. Peer support is a major component of this meeting and is often utilized to navigate stressful situations, such as disagreements with families regarding behavioral management. Staff also review and reinforce the Positive Behavioral Interventions and Supports framework—a preventive framework that can reduce seclusion and restraint use in pediatric psychiatric units, among other positive outcomes.17 This framework includes setting expectations for patients and families regarding behaviors on the unit. In reviewing these guidelines, staff are encouraged to recognize and report inappropriate behaviors (from patients or families) that can be traumatizing, especially over prolonged hospitalizations. This framework also provides a common language for staff to express behavioral expectations in a positive manner (eg, “Let’s use our walking feet” rather than “No running”). Overall, staff view this meeting as a resilience-building activity that empowers them in their routine work.
IMPLEMENTATION CONSIDERATIONS
While the MBU is a specialized unit with dedicated psychosocial resources, the debriefing practices we describe can be translated to multiple care settings. However, successful implementation relies on intentional process design. First, debriefing indications must be made clear to staff (eg, events of restraint). There should be a role or group accountable for organizing and leading debriefings, which should be held at a time that promotes participation from frontline staff,particularly for CED. Debriefings—especially psychological debriefings—should be held in a protected space. They should have a clear organization, such as use of a survey-based debriefing guide that allows for data collection. Importantly, there should be a unit or hospital leader accountable for disseminating learnings and improvement ideas to relevant staff and ensuring action items are completed. Finally, accountable leaders should evaluate the process’ feasibility, efficacy, and sustainability to inform implementation.
Hospitals must also consider how to train debriefing leaders to facilitate difficult conversations. Some hospitals may have formal communication training programs, but it may also be helpful to leverage the skills of social workers and psychosocial staff.
OTHER CONSIDERATIONS
Debriefing relies on a climate in which staff of diverse backgrounds and professional status feel comfortable speaking up. Psychological safety is critical in any crisis, and hospital leaders should consider how to make staff feel comfortable during this mental health crisis.18 Leaders must also be prepared to support staff beyond debriefing if resources are required for secondary posttraumatic stress, burnout, or compassion fatigue.8,19,20 Employee assistance programs may be a useful resource.
CONCLUSION
Debriefing practices can help hospitals contend with the unique challenges facing patients and staff in a mental health crisis. While debriefing may vary based on need and setting, hospitals should consider CED as a strategy for reducing seclusion and restraint use, which adversely impact patients and staff. Psychological debriefing can also help staff mitigate the psychosocial stressors of their work.
1. Czeisler MÉ, Lane RI, Petrosky E, et al. Mental health, substance use, and suicidal ideation during the COVID-19 pandemic—United States, June 24–30, 2020. MMWR Morb Mortal Wkly Rep. 2020;69:1049-1057. https://doi.org/10.15585/mmwr.mm6932a1
2. Leeb RT, Bitsko RH, Radhakrishnan L, et al. Mental health–related emergency department visits among children aged <18 years during the COVID-19 pandemic—United States, January 1–October 17, 2020. MMWR Morb Mortal Wkly Rep. 2020;69:1675-1680. https://doi.org/10.15585/mmwr.mm6945a3
3. Rapoport R. ‘Every day is an emergency’: The pandemic is worsening psychiatric bed shortages nationwide. Stat News. December 23, 2020. Accessed January 22, 2021. https://www.statnews.com/2020/12/23/mental-health-covid19-psychiatric-beds/
4. A step to ease the pandemic mental health crisis. Scientific American. February 1, 2021. Accessed April 14, 2021. https://www.scientificamerican.com/article/a-step-to-ease-the-pandemic-mental-health-crisis/
5. Sharpe M, Toynbee M, Walker J. Proactive Integrated Consultation-Liaison Psychiatry: A new service model for the psychiatric care of general hospital inpatients. Gen Hosp Psych. 2020;66:9-15. https://doi.org/10.1016/j.genhosppsych.2020.06.005
6. Mangaoil RA, Cleverley K, Peter E. Immediate staff debriefing following seclusions or restraint use in inpatient mental health settings: a scoping review. Clin Nurs Res. 2020;29(7):479-495. https://doi.org/10.1177/1054773818791085
7. Needham I, Abderhalden C, Zeller A, et al. The effect of a training course on nursing students’ attitudes toward, perceptions of, and confidence in managing patient aggression. J Nurs Educ. 2005;44:415-420.
8. Missouridou E. Secondary posttraumatic stress and nurses’ emotional responses to patient’s trauma. J Trauma Nurs. 2017;24(2):110-115. https://doi.org/10.1097/JTN.0000000000000274
9. Blankenship BAC, Fernandez RP, Joy BF, et al. Multidisciplinary review of code events in a heart center. Am J Crit Care. 2016;25(4):90-98. https://doi.org/10.4037/ajcc2016302
10. Wolfe H, Zebuhr C, Topjian AA, et al. Interdisciplinary ICU cardiac arrest debriefing improves survival outcomes. Crit Care Med. 2014;42(7):1688-1695. https://doi.org/10.1097/CCM.0000000000000327
11. Tannenbaum SI, Cerasoli CP. Do team and individual debriefs enhance performance? A meta-analysis. Hum Factors. 2013;55(1):231-245. https://doi.org/10.1177/0018720812448394
12. Huckshorn KA. Reducing seclusion restraint in mental health use settings: core strategies for prevention. J Psychosoc Nurs Ment Health Serv. 2004;42:22-33.
13. Goulet MH, Larue C, Dumais A. Evaluation of seclusion and restraint reduction programs in mental health: a systematic review. Agress Violent Behav. 2017;34:139-146. https://doi.org/10.1016/j.avb.2017.01.019
14. Azeem MW, Aujila A, Rammerth M, et al, Effectiveness of six core strategies based on trauma informed care in reducing seclusions and restraints at a child and adolescent psychiatric hospital. J Child Adolesc Psychiatr Nurs. 2011;24:11-15. https://doi.org/10.1111/jcap.12190
15. Wieman DA, Camacho-Gonsalves T, Huckshorn KA, et al. Multisite study of an evidence-based practice to reduce seclusion and restraint in psychiatric inpatient facilities. Psychiatr Serv. 2014;65(3):345-351. https://doi.org/10.1176/appi.ps.201300210
16. Everly GS. A primer on critical incident stress management: what’s really in a name? Int J Emerg Ment Health. 1999;1(2):77-79.
17. Reynolds EK, Grados MA, Praglowski N, et al. Use of modified positive behavioral interventions and supports in a psychiatric inpatient unit for high-risk youths. Psychiatr Serv. 2016;67(5):570-573. https://doi.org/10.1176/appi.ps.201500039
18. Devaraj LR, Cooper C, Begin AS. Creating psychological safety on medical teams in times of crisis. J Hosp Med. 2021;16(1):47-49. https://doi.org/10.12788/jhm.3541
19. Bride BE, Radey M, Figley CR. Measuring compassion fatigue. Clin Soc Work J. 2007;35:155-163. https://doi.org/10.1007/s10615-007-0091-7
20. Figley CR. Compassion fatigue: psychotherapists’ lack of self care. J Clin Psychol. 2002;58(11):1433-1441. https://doi.org/10.1002/jclp.10090
© 2021 Society of Hospital Medicine
Things We Do for No Reason™: Calculating a “Corrected Calcium” Level
Inspired by the ABIM Foundation’s Choosing Wisely® campaign, the “Things We Do for No Reason™” (TWDFNR) series reviews practices that have become common parts of hospital care but may provide little value to our patients. Practices reviewed in the TWDFNR series do not represent clear-cut conclusions or clinical practice standards but are meant as a starting place for research and active discussions among hospitalists and patients. We invite you to be part of that discussion.
CLINICAL SCENARIO
A hospitalist admits a 75-year-old man for evaluation of acute pyelonephritis; the patient’s medical history is significant for chronic kidney disease and nephrotic syndrome. The patient endorses moderate flank pain upon palpation. Initial serum laboratory studies reveal an albumin level of 1.5 g/dL and a calcium level of 10.0 mg/dL. A repeat serum calcium assessment produces similar results. The hospitalist corrects calcium for albumin concentration by applying the most common formula (Payne’s formula), which results in a corrected calcium value of 12 mg/dL. The hospitalist then starts the patient on intravenous (IV) fluids to treat hypercalcemia and obtains serum 25-hydroxyvitamin D and parathyroid hormone levels.
BACKGROUND
Our skeletons bind, with phosphate, nearly 99% of the body’s calcium, the most abundant mineral in our body. The remaining 1% of calcium (approximately 9-10.5 mg/dL) circulates in the blood. Approximately 40% of serum calcium is bound to albumin, with a smaller percentage bound to lactate and citrate. The remaining 4.5 to 5.5 mg/dL circulates unbound as free (ie, ionized) calcium (iCa).1 Calcium has many fundamental intra- and extracellular functions. Physiologic calcium homeostasis is maintained by parathyroid hormone and vitamin D.2 The amount of circulating iCa, rather than total plasma calcium, determines the many biologic effects of plasma calcium.
In the hospital setting, clinicians commonly encounter patients with derangements in calcium homeostasis.3 True hypercalcemia or hypocalcemia has significant clinical manifestations, including generalized fatigue, nephrolithiasis, cardiac arrhythmias, and, potentially, death. Thus, clinical practice requires correct and accurate assessment of serum calcium levels.1
WHY YOU MIGHT THINK CALCULATING A “CORRECTED CALCIUM” LEVEL IS HELPFUL
Although measuring biologically active calcium (ie, iCa) is the gold standard for assessing calcium levels, laboratories struggle to obtain a direct, accurate measurement of iCa due to the special handling and time constraints required to process samples.4 As a result, metabolic laboratory panels typically report the more easily measured total calcium, the sum of iCa and bound calcium.5 Changes in albumin levels, however, do not affect iCa levels. Since calcium has less available albumin for binding, hypoalbuminemia should theoretically decrease the amount of bound calcium and lead to a decreased reported total calcium. Therefore, a patient’s total calcium level may appear low even though their iCa is normal, which can lead to an incorrect diagnosis of hypocalcemia or overestimate of the extent of existing hypocalcemia. Moreover, these lower reported calcium levels can falsely report normocalcemia in patients with hypercalcemia or underestimate the extent of the patient’s hypercalcemia.
For years physicians have attempted to account for the underestimate in total calcium due to hypoalbuminemia by calculating a “corrected” calcium. The correction formulas use total calcium and serum albumin to estimate the expected iCa. Refinements to the original formula, developed by Payne et al in 1973, have resulted in the most commonly utilized formula today: corrected calcium = (0.8 x [normal albumin – patient’s albumin]) + serum calcium.6,7 Many commonly used clinical-decision resources recommend correcting serum calcium concentrations in patients with hypoalbuminemia.6
WHY CALCULATING A CORRECTED CALCIUM FOR ALBUMIN IS UNNECESSARY
While calculating corrected calcium should theoretically provide a more accurate estimate of physiologically active iCa in patients with hypoalbuminemia,4 the commonly used correction equations become less accurate as hypoalbuminemia worsens.8 Payne et al derived the original formula from 200 patients using a single laboratory; however, subsequent retrospective studies have not supported the use of albumin-corrected calcium calculations to estimate the iCa.4,9-11 For example, although Payne’s corrected calcium equations assume a constant relationship between albumin and calcium binding throughout all serum-albumin concentrations, studies have shown that as albumin falls, more calcium ions bind to each available gram of albumin. Payne’s assumption results in an overestimation of the total serum calcium after correction as compared to the iCa.8 In comparison, uncorrected total serum calcium assays more accurately reflect both the change in albumin binding that occurs with alterations in albumin concentration and the unchanged free calcium ions. Studies demonstrate superior correlation between iCa and uncorrected total calcium.4,9-11
Several large retrospective studies revealed the poor in vivo accuracy of equations used to correct calcium for albumin. In one study, Uppsala University Sweden researchers reviewed the laboratory records of more than 20,000 hospitalized patients from 2005 to 2013.9 This group compared seven corrected calcium formulas to direct measurements of iCa. All of the correction equations correlated poorly with iCa based on their intraclass correlation (ICC), a descriptive statistic for units that have been sorted into groups. (ICC describes how strongly the units in each group correlate or resemble each other—eg, the closer an ICC is to 1, the stronger the correlation is between each unit in the group.) ICC for the correcting equations ranged from 0.45-0.81. The formulas used to calculate corrected calcium levels performed especially poorly in patients with hypoalbuminemia. In this same patient population, the total serum calcium correlated well with directly assessed iCa, with an ICC of 0.85 (95% CI, 0.84-0.86). Moreover, the uncorrected total calcium classified the patient’s calcium level correctly in 82% of cases.
A second study of 5,500 patients in Australia comparing total and adjusted calcium with iCa similarly demonstrated that corrected calcium inaccurately predicts calcium status.10 Findings from this study showed that corrected calcium values correlated with iCa in only 55% to 65% of samples, but uncorrected total calcium correlated with iCa in 70% to 80% of samples. Notably, in patients with renal failure and/or serum albumin concentrations <3 g/dL, formulas used to correct calcium overestimated calcium levels when compared to directly assessed iCa. Correction formulas performed on serum albumin concentrations >3 g/dL correlated better with iCa (65%-77%), effectively negating the utility of the correction formulas.
Another large retrospective observational study from Norway reviewed laboratory data from more than 6,500 hospitalized and clinic patients.11 In this study, researchers calculated corrected calcium using several different albumin-adjusted formulas and compared results to laboratory-assessed iCa. As compared to corrected calcium, uncorrected total calcium more accurately determined clinically relevant free calcium.
Finally, a Canadian research group analyzed time-matched calcium, albumin, and iCa samples from 678 patients.4 They calculated each patient’s corrected calcium values using Payne’s formula. Results of this study showed that corrected calcium predicted iCa outcomes less reliably than uncorrected total calcium (ICC, 0.73 for corrected calcium vs 0.78 for uncorrected calcium).
Utilizing corrected calcium formulas in patients with hypoalbuminemia can overestimate serum calcium, resulting in false-positive findings and an incorrect diagnosis of hypercalcemia or normocalcemia.12 Incorrectly diagnosing hypercalcemia by using correction formulas prompts management that can lead to iatrogenic harm. Hypoalbuminemia is often associated with hepatic or renal disease. In this patient population, standard treatment of hypercalcemia with volume resuscitation (typically 2 to 4 L) and potentially IV loop diuretics will cause clinically significant volume overload and could worsen renal dysfunction.13 Notably, some of the correction formulas utilized in the studies discussed here performed well in hypercalcemic patients, particularly in those with preserved renal function (estimated glomerular filtration rate ≥60 mL/min/1.73 m2).
Importantly, correction formulas can mask true hypocalcemia or the true severity of hypocalcemia. Applying correction formulas in patients with clinically significant hypocalcemia and hypoalbuminemia can make hospitalists believe that the calcium levels are normal or not as clinically significant as they first seemed. This can lead to the withholding of appropriate treatment.12
WHAT YOU SHOULD DO INSTEAD
Based on the available literature, uncorrected total calcium values more accurately assess biologically active calcium. If a more certain calcium value will affect clinical outcomes, clinicians should obtain a direct measurement of iCa.4,9-11 Therefore, clinicians should assess iCa irrespective of the uncorrected serum calcium level in patients who are critically ill or who have known hypoparathyroidism or other derangements in iCa.14 Since iCa levels also fluctuate with pH, samples must be processed quickly and kept cool to slow blood cell metabolism, which alters pH levels.4 Using bedside point-of-care blood gas analyzers to obtain iCa removes a large logistical obstacle to obtaining an accurate iCa. Serum electrolyte interpretation with a properly calibrated point-of-care analyzer correlates well with a traditional laboratory analyzer.15
RECOMMENDATIONS
- Use serum calcium testing routinely to evaluate calcium homeostasis.
- Do not use corrected calcium equations to estimate total calcium.
- If a more accurate measurement of calcium will change medical management, obtain a direct iCa.
- Obtain a direct iCa measurement in critically ill patents and in patients with known hypoparathyroidism, hyperparathyroidism, or other derangements in calcium homeostasis.
- Do not order a serum albumin test to assess calcium levels.
CONCLUSION
Returning to our clinical scenario, this patient did not have true hypercalcemia and experienced unnecessary evaluation and treatment. Multiple retrospective clinical trials do not support the practice of using corrected calcium equations to correct for serum albumin derangements.4,9-11 Hospitalists should therefore avoid the temptation to calculate a corrected calcium level in patients with hypoalbuminemia. For patients with clinically significant total serum hypocalcemia or hypercalcemia, they should consider obtaining an iCa assay to better determine the true physiologic impact.
Do you think this is a low-value practice? Is this truly a “Thing We Do for No Reason™”? Share what you do in your practice and join in the conversation online by retweeting it on Twitter (#TWDFNR) and liking it on Facebook. We invite you to propose ideas for other “Things We Do for No Reason™” topics by emailing TWDFNR@hospitalmedicine.org
1. Peacock M. Calcium metabolism in health and disease. Clin J Am Soc Nephrol. 2010;5 Suppl 1:S23-S30. https://doi.org/10.2215/cjn.05910809
2. Brown EM. Extracellular Ca2+ sensing, regulation of parathyroid cell function, and role of Ca2+ and other ions as extracellular (first) messengers. Physiol Rev. 1991;71(2):371-411. https://doi.org/10.1152/physrev.1991.71.2.371
3. Aishah AB, Foo YN. A retrospective study of serum calcium levels in a hospital population in Malaysia. Med J Malaysia. 1995;50(3):246-249.
4. Steen O, Clase C, Don-Wauchope A. Corrected calcium formula in routine clinical use does not accurately reflect ionized calcium in hospital patients. Can J Gen Int Med. 2016;11(3):14-21. https://doi.org/10.22374/cjgim.v11i3.150
5. Payne RB, Little AJ, Williams RB, Milner JR. Interpretation of serum calcium in patients with abnormal serum proteins. Br Med J. 1973;4(5893):643-646. https://doi.org/10.1136/bmj.4.5893.643
6. Shane E. Diagnostic approach to hypercalcemia. UpToDate website. Updated August 31, 2020. Accessed April 8, 2021. https://www.uptodate.com/contents/diagnostic-approach-to-hypercalcemia
7. Ladenson JH, Lewis JW, Boyd JC. Failure of total calcium corrected for protein, albumin, and pH to correctly assess free calcium status. J Clin Endocrinol Metab. 1978;46(6):986-993. https://doi.org/10.1210/jcem-46-6-986
8. Besarab A, Caro JF. Increased absolute calcium binding to albumin in hypoalbuminaemia. J Clin Pathol. 1981;34(12):1368-1374. https://doi.org/10.1136/jcp.34.12.1368
9. Ridefelt P, Helmersson-Karlqvist J. Albumin adjustment of total calcium does not improve the estimation of calcium status. Scand J Clin Lab Invest. 2017;77(6):442-447. https://doi.org/10.1080/00365513.2017.1336568
10. Smith JD, Wilson S, Schneider HG. Misclassification of calcium status based on albumin-adjusted calcium: studies in a tertiary hospital setting. Clin Chem. 2018;64(12):1713-1722. https://doi.org/10.1373/clinchem.2018.291377
11. Lian IA, Åsberg A. Should total calcium be adjusted for albumin? A retrospective observational study of laboratory data from central Norway. BMJ Open. 2018;8(4):e017703. https://doi.org/10.1136/bmjopen-2017-017703
12. Bowers GN Jr, Brassard C, Sena SF. Measurement of ionized calcium in serum with ion-selective electrodes: a mature technology that can meet the daily service needs. Clin Chem. 1986;32(8)1437-1447.
13. Myburgh JA. Fluid resuscitation in acute medicine: what is the current situation? J Intern Med. 2015;277(1):58-68. https://doi.org/10.1111/joim.12326
14. Aberegg SK. Ionized calcium in the ICU: should it be measured and corrected? Chest. 2016;149(3):846-855. https://doi.org/10.1016/j.chest.2015.12.001
15. Mirzazadeh M, Morovat A, James T, Smith I, Kirby J, Shine B. Point-of-care testing of electrolytes and calcium using blood gas analysers: it is time we trusted the results. Emerg Med J. 2016;33(3):181-186. https://doi.org/10.1136/emermed-2015-204669
Inspired by the ABIM Foundation’s Choosing Wisely® campaign, the “Things We Do for No Reason™” (TWDFNR) series reviews practices that have become common parts of hospital care but may provide little value to our patients. Practices reviewed in the TWDFNR series do not represent clear-cut conclusions or clinical practice standards but are meant as a starting place for research and active discussions among hospitalists and patients. We invite you to be part of that discussion.
CLINICAL SCENARIO
A hospitalist admits a 75-year-old man for evaluation of acute pyelonephritis; the patient’s medical history is significant for chronic kidney disease and nephrotic syndrome. The patient endorses moderate flank pain upon palpation. Initial serum laboratory studies reveal an albumin level of 1.5 g/dL and a calcium level of 10.0 mg/dL. A repeat serum calcium assessment produces similar results. The hospitalist corrects calcium for albumin concentration by applying the most common formula (Payne’s formula), which results in a corrected calcium value of 12 mg/dL. The hospitalist then starts the patient on intravenous (IV) fluids to treat hypercalcemia and obtains serum 25-hydroxyvitamin D and parathyroid hormone levels.
BACKGROUND
Our skeletons bind, with phosphate, nearly 99% of the body’s calcium, the most abundant mineral in our body. The remaining 1% of calcium (approximately 9-10.5 mg/dL) circulates in the blood. Approximately 40% of serum calcium is bound to albumin, with a smaller percentage bound to lactate and citrate. The remaining 4.5 to 5.5 mg/dL circulates unbound as free (ie, ionized) calcium (iCa).1 Calcium has many fundamental intra- and extracellular functions. Physiologic calcium homeostasis is maintained by parathyroid hormone and vitamin D.2 The amount of circulating iCa, rather than total plasma calcium, determines the many biologic effects of plasma calcium.
In the hospital setting, clinicians commonly encounter patients with derangements in calcium homeostasis.3 True hypercalcemia or hypocalcemia has significant clinical manifestations, including generalized fatigue, nephrolithiasis, cardiac arrhythmias, and, potentially, death. Thus, clinical practice requires correct and accurate assessment of serum calcium levels.1
WHY YOU MIGHT THINK CALCULATING A “CORRECTED CALCIUM” LEVEL IS HELPFUL
Although measuring biologically active calcium (ie, iCa) is the gold standard for assessing calcium levels, laboratories struggle to obtain a direct, accurate measurement of iCa due to the special handling and time constraints required to process samples.4 As a result, metabolic laboratory panels typically report the more easily measured total calcium, the sum of iCa and bound calcium.5 Changes in albumin levels, however, do not affect iCa levels. Since calcium has less available albumin for binding, hypoalbuminemia should theoretically decrease the amount of bound calcium and lead to a decreased reported total calcium. Therefore, a patient’s total calcium level may appear low even though their iCa is normal, which can lead to an incorrect diagnosis of hypocalcemia or overestimate of the extent of existing hypocalcemia. Moreover, these lower reported calcium levels can falsely report normocalcemia in patients with hypercalcemia or underestimate the extent of the patient’s hypercalcemia.
For years physicians have attempted to account for the underestimate in total calcium due to hypoalbuminemia by calculating a “corrected” calcium. The correction formulas use total calcium and serum albumin to estimate the expected iCa. Refinements to the original formula, developed by Payne et al in 1973, have resulted in the most commonly utilized formula today: corrected calcium = (0.8 x [normal albumin – patient’s albumin]) + serum calcium.6,7 Many commonly used clinical-decision resources recommend correcting serum calcium concentrations in patients with hypoalbuminemia.6
WHY CALCULATING A CORRECTED CALCIUM FOR ALBUMIN IS UNNECESSARY
While calculating corrected calcium should theoretically provide a more accurate estimate of physiologically active iCa in patients with hypoalbuminemia,4 the commonly used correction equations become less accurate as hypoalbuminemia worsens.8 Payne et al derived the original formula from 200 patients using a single laboratory; however, subsequent retrospective studies have not supported the use of albumin-corrected calcium calculations to estimate the iCa.4,9-11 For example, although Payne’s corrected calcium equations assume a constant relationship between albumin and calcium binding throughout all serum-albumin concentrations, studies have shown that as albumin falls, more calcium ions bind to each available gram of albumin. Payne’s assumption results in an overestimation of the total serum calcium after correction as compared to the iCa.8 In comparison, uncorrected total serum calcium assays more accurately reflect both the change in albumin binding that occurs with alterations in albumin concentration and the unchanged free calcium ions. Studies demonstrate superior correlation between iCa and uncorrected total calcium.4,9-11
Several large retrospective studies revealed the poor in vivo accuracy of equations used to correct calcium for albumin. In one study, Uppsala University Sweden researchers reviewed the laboratory records of more than 20,000 hospitalized patients from 2005 to 2013.9 This group compared seven corrected calcium formulas to direct measurements of iCa. All of the correction equations correlated poorly with iCa based on their intraclass correlation (ICC), a descriptive statistic for units that have been sorted into groups. (ICC describes how strongly the units in each group correlate or resemble each other—eg, the closer an ICC is to 1, the stronger the correlation is between each unit in the group.) ICC for the correcting equations ranged from 0.45-0.81. The formulas used to calculate corrected calcium levels performed especially poorly in patients with hypoalbuminemia. In this same patient population, the total serum calcium correlated well with directly assessed iCa, with an ICC of 0.85 (95% CI, 0.84-0.86). Moreover, the uncorrected total calcium classified the patient’s calcium level correctly in 82% of cases.
A second study of 5,500 patients in Australia comparing total and adjusted calcium with iCa similarly demonstrated that corrected calcium inaccurately predicts calcium status.10 Findings from this study showed that corrected calcium values correlated with iCa in only 55% to 65% of samples, but uncorrected total calcium correlated with iCa in 70% to 80% of samples. Notably, in patients with renal failure and/or serum albumin concentrations <3 g/dL, formulas used to correct calcium overestimated calcium levels when compared to directly assessed iCa. Correction formulas performed on serum albumin concentrations >3 g/dL correlated better with iCa (65%-77%), effectively negating the utility of the correction formulas.
Another large retrospective observational study from Norway reviewed laboratory data from more than 6,500 hospitalized and clinic patients.11 In this study, researchers calculated corrected calcium using several different albumin-adjusted formulas and compared results to laboratory-assessed iCa. As compared to corrected calcium, uncorrected total calcium more accurately determined clinically relevant free calcium.
Finally, a Canadian research group analyzed time-matched calcium, albumin, and iCa samples from 678 patients.4 They calculated each patient’s corrected calcium values using Payne’s formula. Results of this study showed that corrected calcium predicted iCa outcomes less reliably than uncorrected total calcium (ICC, 0.73 for corrected calcium vs 0.78 for uncorrected calcium).
Utilizing corrected calcium formulas in patients with hypoalbuminemia can overestimate serum calcium, resulting in false-positive findings and an incorrect diagnosis of hypercalcemia or normocalcemia.12 Incorrectly diagnosing hypercalcemia by using correction formulas prompts management that can lead to iatrogenic harm. Hypoalbuminemia is often associated with hepatic or renal disease. In this patient population, standard treatment of hypercalcemia with volume resuscitation (typically 2 to 4 L) and potentially IV loop diuretics will cause clinically significant volume overload and could worsen renal dysfunction.13 Notably, some of the correction formulas utilized in the studies discussed here performed well in hypercalcemic patients, particularly in those with preserved renal function (estimated glomerular filtration rate ≥60 mL/min/1.73 m2).
Importantly, correction formulas can mask true hypocalcemia or the true severity of hypocalcemia. Applying correction formulas in patients with clinically significant hypocalcemia and hypoalbuminemia can make hospitalists believe that the calcium levels are normal or not as clinically significant as they first seemed. This can lead to the withholding of appropriate treatment.12
WHAT YOU SHOULD DO INSTEAD
Based on the available literature, uncorrected total calcium values more accurately assess biologically active calcium. If a more certain calcium value will affect clinical outcomes, clinicians should obtain a direct measurement of iCa.4,9-11 Therefore, clinicians should assess iCa irrespective of the uncorrected serum calcium level in patients who are critically ill or who have known hypoparathyroidism or other derangements in iCa.14 Since iCa levels also fluctuate with pH, samples must be processed quickly and kept cool to slow blood cell metabolism, which alters pH levels.4 Using bedside point-of-care blood gas analyzers to obtain iCa removes a large logistical obstacle to obtaining an accurate iCa. Serum electrolyte interpretation with a properly calibrated point-of-care analyzer correlates well with a traditional laboratory analyzer.15
RECOMMENDATIONS
- Use serum calcium testing routinely to evaluate calcium homeostasis.
- Do not use corrected calcium equations to estimate total calcium.
- If a more accurate measurement of calcium will change medical management, obtain a direct iCa.
- Obtain a direct iCa measurement in critically ill patents and in patients with known hypoparathyroidism, hyperparathyroidism, or other derangements in calcium homeostasis.
- Do not order a serum albumin test to assess calcium levels.
CONCLUSION
Returning to our clinical scenario, this patient did not have true hypercalcemia and experienced unnecessary evaluation and treatment. Multiple retrospective clinical trials do not support the practice of using corrected calcium equations to correct for serum albumin derangements.4,9-11 Hospitalists should therefore avoid the temptation to calculate a corrected calcium level in patients with hypoalbuminemia. For patients with clinically significant total serum hypocalcemia or hypercalcemia, they should consider obtaining an iCa assay to better determine the true physiologic impact.
Do you think this is a low-value practice? Is this truly a “Thing We Do for No Reason™”? Share what you do in your practice and join in the conversation online by retweeting it on Twitter (#TWDFNR) and liking it on Facebook. We invite you to propose ideas for other “Things We Do for No Reason™” topics by emailing TWDFNR@hospitalmedicine.org
1. Peacock M. Calcium metabolism in health and disease. Clin J Am Soc Nephrol. 2010;5 Suppl 1:S23-S30. https://doi.org/10.2215/cjn.05910809
2. Brown EM. Extracellular Ca2+ sensing, regulation of parathyroid cell function, and role of Ca2+ and other ions as extracellular (first) messengers. Physiol Rev. 1991;71(2):371-411. https://doi.org/10.1152/physrev.1991.71.2.371
3. Aishah AB, Foo YN. A retrospective study of serum calcium levels in a hospital population in Malaysia. Med J Malaysia. 1995;50(3):246-249.
4. Steen O, Clase C, Don-Wauchope A. Corrected calcium formula in routine clinical use does not accurately reflect ionized calcium in hospital patients. Can J Gen Int Med. 2016;11(3):14-21. https://doi.org/10.22374/cjgim.v11i3.150
5. Payne RB, Little AJ, Williams RB, Milner JR. Interpretation of serum calcium in patients with abnormal serum proteins. Br Med J. 1973;4(5893):643-646. https://doi.org/10.1136/bmj.4.5893.643
6. Shane E. Diagnostic approach to hypercalcemia. UpToDate website. Updated August 31, 2020. Accessed April 8, 2021. https://www.uptodate.com/contents/diagnostic-approach-to-hypercalcemia
7. Ladenson JH, Lewis JW, Boyd JC. Failure of total calcium corrected for protein, albumin, and pH to correctly assess free calcium status. J Clin Endocrinol Metab. 1978;46(6):986-993. https://doi.org/10.1210/jcem-46-6-986
8. Besarab A, Caro JF. Increased absolute calcium binding to albumin in hypoalbuminaemia. J Clin Pathol. 1981;34(12):1368-1374. https://doi.org/10.1136/jcp.34.12.1368
9. Ridefelt P, Helmersson-Karlqvist J. Albumin adjustment of total calcium does not improve the estimation of calcium status. Scand J Clin Lab Invest. 2017;77(6):442-447. https://doi.org/10.1080/00365513.2017.1336568
10. Smith JD, Wilson S, Schneider HG. Misclassification of calcium status based on albumin-adjusted calcium: studies in a tertiary hospital setting. Clin Chem. 2018;64(12):1713-1722. https://doi.org/10.1373/clinchem.2018.291377
11. Lian IA, Åsberg A. Should total calcium be adjusted for albumin? A retrospective observational study of laboratory data from central Norway. BMJ Open. 2018;8(4):e017703. https://doi.org/10.1136/bmjopen-2017-017703
12. Bowers GN Jr, Brassard C, Sena SF. Measurement of ionized calcium in serum with ion-selective electrodes: a mature technology that can meet the daily service needs. Clin Chem. 1986;32(8)1437-1447.
13. Myburgh JA. Fluid resuscitation in acute medicine: what is the current situation? J Intern Med. 2015;277(1):58-68. https://doi.org/10.1111/joim.12326
14. Aberegg SK. Ionized calcium in the ICU: should it be measured and corrected? Chest. 2016;149(3):846-855. https://doi.org/10.1016/j.chest.2015.12.001
15. Mirzazadeh M, Morovat A, James T, Smith I, Kirby J, Shine B. Point-of-care testing of electrolytes and calcium using blood gas analysers: it is time we trusted the results. Emerg Med J. 2016;33(3):181-186. https://doi.org/10.1136/emermed-2015-204669
© 2021 Society of Hospital Medicine
Pediatric Conditions Requiring Minimal Intervention or Observation After Interfacility Transfer
Regionalization of pediatric acute care is increasing across the United States, with rates of interfacility transfer for general medical conditions in children similar to those of high-risk conditions in adults.1 The inability for children to receive definitive care (ie, care provided to conclusively manage a patient’s condition without requiring an interfacility transfer) within their local community has implications on public health as well as family function and financial burden.1,2 Previous studies demonstrated that 30% to 80% of interfacility transfers are potentially unnecessary,3-6 as indicated by a high proportion of short lengths of stay after transfer.
To highlight conditions that referring hospitals may prioritize for pediatric capacity building, we aimed to identify the most common medical diagnoses among pediatric transfer patients that did not require advanced evaluation or intervention and that had high rates of discharge within 1 day of interfacility transfer.
METHODS
We conducted a retrospective, cross-sectional, descriptive study using the Pediatric Health Information System (PHIS) database, which contains administrative data from 48 geographically diverse US children’s hospitals.
We included children <18 years old who were transferred to a participating PHIS hospital in 2019, including emergency department (ED), observation, and inpatient encounters. We identified patients through the source-of-admission code labeled as “transfer.”
For each diagnosis, we determined the number of transfers and frequency of rapid discharge, defined as either discharge from the ED without admission or admission and discharge within 1 day from a general inpatient unit. As discharge times are not reliably available in PHIS, all patients discharged on the day of transfer or the following calendar day were identified as rapid discharge. Medical complexity was determined through applying the Pediatric Medical Complexity Algorithm (PMCA).8
For descriptive statistics, we calculated means for normally distributed variables, medians for continuous variables with nonnormal distributions, and percentages for binary variables. Comparisons were made using t-tests and chi-square tests.
This study was approved by the Seattle Children’s Institutional Review Board.
RESULTS
We identified 286,905 transfers into participating PHIS hospitals in 2019. Of these, 89,519 (31.2%) were excluded (Appendix Table 2), leaving 197,386 (68.6%) transfers. Patients discharged within 1 day were more likely to have public or unknown insurance (65.1% vs 61.5%, P < 0.01), to have no co-occurring chronic conditions (60.2% vs 28.5%, P < 0.01), and to reside within the Northeast (35.0% vs 11.0%, P < 0.01) (Appendix Table 3).
The most common medical diagnoses among these transfers included acute bronchiolitis (4.3% of all interfacility transfers, n = 8,425), chemotherapy (4.0%, n = 7,819), and asthma (3.3%, n = 6,430) (Appendix Table 4); 45.9% of bronchiolitis, 15.0% of chemotherapy, and 67.4% of asthma transfers were rapidly discharged.
The Table shows the medical conditions among transfers that most frequently experienced rapid discharge (primary surgical diagnoses are presented in Appendix Table 5). 
DISCUSSION
We have identified medical conditions that not only had high rates of rapid discharge after transfer, but also received minimal intervention from the accepting institution. Although bronchiolitis and chemotherapy were the most common conditions for which patients were transferred, the range of severity varied widely, with more than 50% of bronchiolitis and 85% of chemotherapy transfers requiring hospitalization for longer than 1 day
Identifying conditions as potential targets to reduce the number of interfacility transfers requires balancing a hospital’s capacity (or lack thereof) for pediatric admissions, perceived risk of decompensation, referring provider discomfort, and parental preference.9-11
The rapid upscale of telehealth may provide a unique opportunity to support the provision of pediatric care within local communities.12,13
Building infrastructure to prevent interfacility transfers may improve healthcare access for children in rural areas proportionately more than children in urban areas. Children in rural communities experience significantly higher rates of interfacility transfers than children in urban areas.14 This increases financial burden and causes additional distress and inconvenience for families.15 With constraints in staffing capacity, equipment, and finances, identifying a subset of medical conditions is a critical initial step to inform the design of targeted interventions to support pediatric healthcare delivery in local communities and avoid costly transfers, although it is not the wholesale solution. Additional utilization of tools such as informed shared decision-making resources and implementation of pediatric-specific protocols likely represent additional necessary steps.
Our study has several limitations. Because we used administrative data, there is a risk of misclassifying diagnoses. We attempted to mitigate this by using a standard ICD-10-based, pediatric-specific grouper.
CONCLUSION
Our exploration of pediatric interfacility transfers that experienced rapid discharge with minimal intervention provides a building block to support the provision of definitive pediatric care in non-pediatric hospitals and represents a step towards addressing limited access to care in general hospitals.
1. França UL, McManus ML. Availability of definitive hospital care for children. JAMA Pediatr. 2017;171(9):e171096. https://doi.org/10.1001/jamapediatrics.2017.1096
2. Mumford V, Baysari MT, Kalinin D, et al. Measuring the financial and productivity burden of paediatric hospitalisation on the wider family network. J Paediatr Child Health. 2018;54(9):987-996. https://doi.org/10.1111/jpc.13923
3. Richard KR, Glisson KL, Shah N, et al. Predictors of potentially unnecessary transfers to pediatric emergency departments. Hosp Pediatr. 2020;10(5):424-429. https://doi.org/10.1542/hpeds.2019-0307
4. Gattu RK, Teshome G, Cai L, Wright C, Lichenstein R. Interhospital pediatric patient transfers-factors influencing rapid disposition after transfer. Pediatr Emerg Care. 2014;30(1):26-30. https://doi.org/10.1097/PEC.0000000000000061
5. Li J, Monuteaux MC, Bachur RG. Interfacility transfers of noncritically ill children to academic pediatric emergency departments. Pediatrics. 2012;130(1):83-92. https://doi.org/10.1542/peds.2011-1819
6. Rosenthal JL, Lieng MK, Marcin JP, Romano PS. Profiling pediatric potentially avoidable transfers using procedure and diagnosis codes. Pediatr Emerg Care. 2019 Mar 19;10.1097/PEC.0000000000001777. https://doi.org/10.1097/PEC.0000000000001777
7. Pediatric clinical classification system (PECCS) codes. Children’s Hospital Association. December 11, 2020. Accessed June 3, 2021. https://www.childrenshospitals.org/Research-and-Data/Pediatric-Data-and-Trends/2020/Pediatric-Clinical-Classification-System-PECCS
8. Simon TD, Haaland W, Hawley K, Lambka K, Mangione-Smith R. Development and validation of the pediatric medical complexity algorithm (PMCA) version 3.0. Acad Pediatr. 2018;18(5):577-580. https://doi.org/10.1016/j.acap.2018.02.010
9. Rosenthal JL, Okumura MJ, Hernandez L, Li ST, Rehm RS. Interfacility transfers to general pediatric floors: a qualitative study exploring the role of communication. Acad Pediatr. 2016;16(7):692-699. https://doi.org/10.1016/j.acap.2016.04.003
10. Rosenthal JL, Li ST, Hernandez L, Alvarez M, Rehm RS, Okumura MJ. Familial caregiver and physician perceptions of the family-physician interactions during interfacility transfers. Hosp Pediatr. 2017;7(6):344-351. https://doi.org/10.1542/hpeds.2017-0017
11. Peebles ER, Miller MR, Lynch TP, Tijssen JA. Factors associated with discharge home after transfer to a pediatric emergency department. Pediatr Emerg Care. 2018;34(9):650-655. https://doi.org/10.1097/PEC.0000000000001098
12. Labarbera JM, Ellenby MS, Bouressa P, Burrell J, Flori HR, Marcin JP. The impact of telemedicine intensivist support and a pediatric hospitalist program on a community hospital. Telemed J E Health. 2013;19(10):760-766. https://doi.org/10.1089/tmj.2012.0303
13. Haynes SC, Dharmar M, Hill BC, et al. The impact of telemedicine on transfer rates of newborns at rural community hospitals. Acad Pediatr. 2020;20(5):636-641. https://doi.org/10.1016/j.acap.2020.02.013
14. Michelson KA, Hudgins JD, Lyons TW, Monuteaux MC, Bachur RG, Finkelstein JA. Trends in capability of hospitals to provide definitive acute care for children: 2008 to 2016. Pediatrics. 2020;145(1). https://doi.org/10.1542/peds.2019-2203
15. Mohr NM, Harland KK, Shane DM, Miller SL, Torner JC. Potentially avoidable pediatric interfacility transfer is a costly burden for rural families: a cohort study. Acad Emerg Med. 2016;23(8):885-894. https://doi.org/10.1111/acem.12972
Regionalization of pediatric acute care is increasing across the United States, with rates of interfacility transfer for general medical conditions in children similar to those of high-risk conditions in adults.1 The inability for children to receive definitive care (ie, care provided to conclusively manage a patient’s condition without requiring an interfacility transfer) within their local community has implications on public health as well as family function and financial burden.1,2 Previous studies demonstrated that 30% to 80% of interfacility transfers are potentially unnecessary,3-6 as indicated by a high proportion of short lengths of stay after transfer.
To highlight conditions that referring hospitals may prioritize for pediatric capacity building, we aimed to identify the most common medical diagnoses among pediatric transfer patients that did not require advanced evaluation or intervention and that had high rates of discharge within 1 day of interfacility transfer.
METHODS
We conducted a retrospective, cross-sectional, descriptive study using the Pediatric Health Information System (PHIS) database, which contains administrative data from 48 geographically diverse US children’s hospitals.
We included children <18 years old who were transferred to a participating PHIS hospital in 2019, including emergency department (ED), observation, and inpatient encounters. We identified patients through the source-of-admission code labeled as “transfer.”
For each diagnosis, we determined the number of transfers and frequency of rapid discharge, defined as either discharge from the ED without admission or admission and discharge within 1 day from a general inpatient unit. As discharge times are not reliably available in PHIS, all patients discharged on the day of transfer or the following calendar day were identified as rapid discharge. Medical complexity was determined through applying the Pediatric Medical Complexity Algorithm (PMCA).8
For descriptive statistics, we calculated means for normally distributed variables, medians for continuous variables with nonnormal distributions, and percentages for binary variables. Comparisons were made using t-tests and chi-square tests.
This study was approved by the Seattle Children’s Institutional Review Board.
RESULTS
We identified 286,905 transfers into participating PHIS hospitals in 2019. Of these, 89,519 (31.2%) were excluded (Appendix Table 2), leaving 197,386 (68.6%) transfers. Patients discharged within 1 day were more likely to have public or unknown insurance (65.1% vs 61.5%, P < 0.01), to have no co-occurring chronic conditions (60.2% vs 28.5%, P < 0.01), and to reside within the Northeast (35.0% vs 11.0%, P < 0.01) (Appendix Table 3).
The most common medical diagnoses among these transfers included acute bronchiolitis (4.3% of all interfacility transfers, n = 8,425), chemotherapy (4.0%, n = 7,819), and asthma (3.3%, n = 6,430) (Appendix Table 4); 45.9% of bronchiolitis, 15.0% of chemotherapy, and 67.4% of asthma transfers were rapidly discharged.
The Table shows the medical conditions among transfers that most frequently experienced rapid discharge (primary surgical diagnoses are presented in Appendix Table 5).
DISCUSSION
We have identified medical conditions that not only had high rates of rapid discharge after transfer, but also received minimal intervention from the accepting institution. Although bronchiolitis and chemotherapy were the most common conditions for which patients were transferred, the range of severity varied widely, with more than 50% of bronchiolitis and 85% of chemotherapy transfers requiring hospitalization for longer than 1 day
Identifying conditions as potential targets to reduce the number of interfacility transfers requires balancing a hospital’s capacity (or lack thereof) for pediatric admissions, perceived risk of decompensation, referring provider discomfort, and parental preference.9-11
The rapid upscale of telehealth may provide a unique opportunity to support the provision of pediatric care within local communities.12,13
Building infrastructure to prevent interfacility transfers may improve healthcare access for children in rural areas proportionately more than children in urban areas. Children in rural communities experience significantly higher rates of interfacility transfers than children in urban areas.14 This increases financial burden and causes additional distress and inconvenience for families.15 With constraints in staffing capacity, equipment, and finances, identifying a subset of medical conditions is a critical initial step to inform the design of targeted interventions to support pediatric healthcare delivery in local communities and avoid costly transfers, although it is not the wholesale solution. Additional utilization of tools such as informed shared decision-making resources and implementation of pediatric-specific protocols likely represent additional necessary steps.
Our study has several limitations. Because we used administrative data, there is a risk of misclassifying diagnoses. We attempted to mitigate this by using a standard ICD-10-based, pediatric-specific grouper.
CONCLUSION
Our exploration of pediatric interfacility transfers that experienced rapid discharge with minimal intervention provides a building block to support the provision of definitive pediatric care in non-pediatric hospitals and represents a step towards addressing limited access to care in general hospitals.
1. França UL, McManus ML. Availability of definitive hospital care for children. JAMA Pediatr. 2017;171(9):e171096. https://doi.org/10.1001/jamapediatrics.2017.1096
2. Mumford V, Baysari MT, Kalinin D, et al. Measuring the financial and productivity burden of paediatric hospitalisation on the wider family network. J Paediatr Child Health. 2018;54(9):987-996. https://doi.org/10.1111/jpc.13923
3. Richard KR, Glisson KL, Shah N, et al. Predictors of potentially unnecessary transfers to pediatric emergency departments. Hosp Pediatr. 2020;10(5):424-429. https://doi.org/10.1542/hpeds.2019-0307
4. Gattu RK, Teshome G, Cai L, Wright C, Lichenstein R. Interhospital pediatric patient transfers-factors influencing rapid disposition after transfer. Pediatr Emerg Care. 2014;30(1):26-30. https://doi.org/10.1097/PEC.0000000000000061
5. Li J, Monuteaux MC, Bachur RG. Interfacility transfers of noncritically ill children to academic pediatric emergency departments. Pediatrics. 2012;130(1):83-92. https://doi.org/10.1542/peds.2011-1819
6. Rosenthal JL, Lieng MK, Marcin JP, Romano PS. Profiling pediatric potentially avoidable transfers using procedure and diagnosis codes. Pediatr Emerg Care. 2019 Mar 19;10.1097/PEC.0000000000001777. https://doi.org/10.1097/PEC.0000000000001777
7. Pediatric clinical classification system (PECCS) codes. Children’s Hospital Association. December 11, 2020. Accessed June 3, 2021. https://www.childrenshospitals.org/Research-and-Data/Pediatric-Data-and-Trends/2020/Pediatric-Clinical-Classification-System-PECCS
8. Simon TD, Haaland W, Hawley K, Lambka K, Mangione-Smith R. Development and validation of the pediatric medical complexity algorithm (PMCA) version 3.0. Acad Pediatr. 2018;18(5):577-580. https://doi.org/10.1016/j.acap.2018.02.010
9. Rosenthal JL, Okumura MJ, Hernandez L, Li ST, Rehm RS. Interfacility transfers to general pediatric floors: a qualitative study exploring the role of communication. Acad Pediatr. 2016;16(7):692-699. https://doi.org/10.1016/j.acap.2016.04.003
10. Rosenthal JL, Li ST, Hernandez L, Alvarez M, Rehm RS, Okumura MJ. Familial caregiver and physician perceptions of the family-physician interactions during interfacility transfers. Hosp Pediatr. 2017;7(6):344-351. https://doi.org/10.1542/hpeds.2017-0017
11. Peebles ER, Miller MR, Lynch TP, Tijssen JA. Factors associated with discharge home after transfer to a pediatric emergency department. Pediatr Emerg Care. 2018;34(9):650-655. https://doi.org/10.1097/PEC.0000000000001098
12. Labarbera JM, Ellenby MS, Bouressa P, Burrell J, Flori HR, Marcin JP. The impact of telemedicine intensivist support and a pediatric hospitalist program on a community hospital. Telemed J E Health. 2013;19(10):760-766. https://doi.org/10.1089/tmj.2012.0303
13. Haynes SC, Dharmar M, Hill BC, et al. The impact of telemedicine on transfer rates of newborns at rural community hospitals. Acad Pediatr. 2020;20(5):636-641. https://doi.org/10.1016/j.acap.2020.02.013
14. Michelson KA, Hudgins JD, Lyons TW, Monuteaux MC, Bachur RG, Finkelstein JA. Trends in capability of hospitals to provide definitive acute care for children: 2008 to 2016. Pediatrics. 2020;145(1). https://doi.org/10.1542/peds.2019-2203
15. Mohr NM, Harland KK, Shane DM, Miller SL, Torner JC. Potentially avoidable pediatric interfacility transfer is a costly burden for rural families: a cohort study. Acad Emerg Med. 2016;23(8):885-894. https://doi.org/10.1111/acem.12972
© 2021 Society of Hospital Medicine
The Hospital Readmissions Reduction Program and Observation Hospitalizations
The Hospital Readmissions Reduction Program (HRRP) was designed to improve quality and safety for traditional Medicare beneficiaries.1 Since 2012, the program has reduced payments to institutions with excess inpatient rehospitalizations within 30 days of an index inpatient stay for targeted medical conditions. Observation hospitalizations, billed as outpatient and covered under Medicare Part B, are not counted as index or 30-day rehospitalizations under HRRP methods. Historically, observation occurred almost exclusively in observation units. Now, observation hospitalizations commonly occur on hospital wards, even in intensive care units, and are often clinically indistinguishable from inpatient hospitalizations billed under Medicare Part A.2 The Centers for Medicare & Medicaid Services (CMS) state that beneficiaries expected to need 2 or more midnights of hospital care should generally be considered inpatients, yet observation hospitalizations commonly exceed 2 midnights.3,4
The increasing use of observation hospitalizations5,6 raises questions about its impact on HRRP measurements. While observation hospitalizations have been studied as part of 30-day follow-up (numerator) to index inpatient hospitalizations,5,6 little is known about how observation hospitalizations impact rates when they are factored in as both index stays (denominator) and in the 30-day rehospitalization rate (numerator).2,7 We analyzed the complete combinations of observation and inpatient hospitalizations, including observation as index hospitalization, rehospitalization, or both, to determine HRRP impact.
METHODS
Study Cohort
Medicare fee-for-service standard claim files for all beneficiaries (100% population file version) were used to examine qualifying index inpatient and observation hospitalizations between January 1, 2014, and November 30, 2014, as well as 30-day inpatient and observation rehospitalizations. We used CMS’s 30-day methodology, including previously described standard exclusions (Appendix Figure),8 except for the aforementioned inclusion of observation hospitalizations. Observation hospitalizations were identified using established methods,3,9,10 excluding those observation encounters coded with revenue center code 0761 only3,10 in order to be most conservative in identifying observation hospitalizations (Appendix Figure). These methods assign hospitalization type (observation or inpatient) based on the final (billed) status. The terms hospitalization and rehospitalization refer to both inpatient and observation encounters. The University of Wisconsin Health Sciences Institutional Review Board approved this study.
Hospital Readmissions Reduction Program
Index HRRP admissions for congestive heart failure, chronic obstructive pulmonary disease, myocardial infarction, and pneumonia were examined as a prespecified subgroup.1,11 Coronary artery bypass grafting, total hip replacement, and total knee replacement were excluded in this analysis, as no crosswalk exists between International Classification of Diseases, Ninth Revision codes and Current Procedural Terminology codes for these surgical conditions.11
Analysis
Analyses were conducted at the encounter level, consistent with CMS methods.8 Descriptive statistics were used to summarize index and 30-day outcomes.
RESULTS
Of 8,859,534 index hospitalizations for any reason or diagnosis, 1,597,837 (18%) were observation and 7,261,697 (82%) were inpatient. Including all hospitalizations, 23% (390,249/1,689,609) of rehospitalizations were excluded from readmission measurement by virtue of the index hospitalization and/or 30-day rehospitalization being observation (Table 1 and Table 2).

For the subgroup of HRRP conditions, 418,923 (11%) and 3,387,849 (89%) of 3,806,772 index hospitalizations were observation and inpatient, respectively. Including HRRP conditions only, 18% (155,553/876,033) of rehospitalizations were excluded from HRRP reporting owing to observation hospitalization as index, 30-day outcome, or both. Of 188,430 index/30-day pairs containing observation, 34% (63,740) were observation/inpatient, 53% (100,343) were inpatient/observation, and 13% (24,347) were observation/observation (Table 1 and Table 2).
DISCUSSION
By ignoring observation hospitalizations in 30-day HRRP quality metrics, nearly one of five potential rehospitalizations is missed. Observation hospitalizations commonly occur as either the index event or 30-day outcome, so accurately determining 30-day HRRP rates must include observation in both positions. Given hospital variability in observation use,3,7 these findings are critically important to accurately understand rehospitalization risk and indicate that HRRP may not be fulfilling its intended purpose.
Including all hospitalizations for any diagnosis, we found that observation and inpatient hospitalizations commonly occur within 30 days of each other. Nearly one in four hospitalization/rehospitalization pairs include observation as index, 30-day rehospitalization, or both. Although not directly related to HRRP metrics, these data demonstrate the growing importance and presence of outpatient (observation) hospitalizations in the Medicare program.
Our study adds to the evolving body of literature investigating quality measures under a two-tiered hospital system where inpatient hospitalizations are counted and observation hospitalizations are not. Figueroa and colleagues12 found that improvements in avoidable admission rates for patients with ambulatory care–sensitive conditions were largely attributable to a shift from counted inpatient to uncounted observation hospitalizations. In other words, hospitalizations were still occurring, but were not being tallied due to outpatient (observation) classification. Zuckerman et al5 and the Medicare Payment Advisory Commission (MedPAC)6 concluded that readmissions improvements recognized by the HRRP were not explained by a shift to more observation hospitalizations following an index inpatient hospitalization; however, both studies included observation hospitalizations as part of 30-day rehospitalization (numerator) only, not also as part of index hospitalizations (denominator). Our study confirms the importance of including observation hospitalizations in both the index (denominator) and 30-day (numerator) rehospitalization positions to determine the full impact of observation hospitalizations on Medicare’s HRRP metrics.
Our study has limitations. We focused on nonsurgical HRRP conditions, which may have impacted our findings. Additionally, some authors have suggested including emergency department (ED) visits in rehospitalization studies.7 Although ED visits occur at hospitals, they are not hospitalizations; we excluded them as a first step. Had we included ED visits, encounters excluded from HRRP measurements would have increased, suggesting that our findings, while sizeable, are likely conservative. Additionally, we could not determine the merits or medical necessity of hospitalizations (inpatient or outpatient observation), but this is an inherent limitation in a large claims dataset like this one. Finally, we only included a single year of data in this analysis, and it is possible that additional years of data would show different trends. However, we have no reason to believe the study year to be an aberrant year; if anything, observation rates have increased since 2014,6 again pointing out that while our findings are sizable, they are likely conservative. Future research could include additional years of data to confirm even greater proportions of rehospitalizations exempt from HRRP over time due to observation hospitalizations as index and/or 30-day events.
Outpatient observation hospitalizations can occur anywhere in the hospital and are often clinically similar to inpatient hospitalizations, yet observation hospitalizations are essentially invisible under inpatient quality metrics. Requiring the HRRP to include observation hospitalizations is the most obvious solution, but this could require major regulatory and legislative change11,13—change that would fix a metric but fail to address broad policy concerns inherent in the two-tiered observation and inpatient billing distinction. Instead, CMS and Congress might consider this an opportunity to address the oxymoron of “outpatient hospitalizations” by engaging in comprehensive observation reform.
1. Centers for Medicare & Medicaid Services. Hospital Readmissions Reduction Program (HRRP). Accessed March 12, 2021. https://www.cms.gov/Medicare/Medicare-Fee-for-Service-Payment/AcuteInpatientPPS/Readmissions-Reduction-Program
2. Sabbatini AK, Wright B. Excluding observation stays from readmission rates—what quality measures are missing. N Engl J Med. 2018;378(22):2062-2065. https://doi.org/10.1056/NEJMp1800732
3. Sheehy AM, Powell WR, Kaiksow FA, et al. Thirty-day re-observation, chronic re-observation, and neighborhood disadvantage. Mayo Clin Proc. 2020;95(12):2644-2654. https://doi.org/10.1016/j.mayocp.2020.06.059
4. US Department of Health and Human Services. Office of Inspector General. Vulnerabilities remain under Medicare’s 2-midnight hospital policy. December 19, 2016. Accessed February 11, 2021. https://oig.hhs.gov/oei/reports/oei-02-15-00020.asp
5. Zuckerman RB, Sheingold SH, Orav EJ, Ruhter J, Epstein AM. Readmissions, observation and the Hospital Readmissions Reduction Program. N Engl J Med. 2016;374(16):1543-1551. https://doi.org/10.1056/NEJMsa1513024
6. Medicare Payment Advisory Commission. Mandated report: the effects of the Hospital Readmissions Reduction Program. In: Report to the Congress: Medicare and the Health Care Delivery System. 2018;3-31. Accessed March 17, 2021. Available at: http://www.medpac.gov/docs/default-source/reports/jun18_medpacreporttocongress_rev_nov2019_note_sec.pdf?sfvrsn=0
7. Wadhera RK, Yeh RW, Maddox KEJ. The Hospital Readmissions Reduction Program—time for a reboot. N Engl J Med. 2019;380(24):2289-2291. https://doi.org/10.1056/NEJMp1901225
8. National Quality Forum. Measure #1789: Hospital-wide all-cause unplanned readmission measure. Accessed January 30, 2021. https://www.qualityforum.org/ProjectDescription.aspx?projectID=73619
9. Sheehy AM, Shi F, Kind AJH. Identifying observation stays in Medicare data: policy implications of a definition. J Hosp Med. 2019;14(2):96-100. https://doi.org/10.12788/jhm.3038
10. Powell WR, Kaiksow FA, Kind AJH, Sheehy AM. What is an observation stay? Evaluating the use of hospital observation stays in Medicare. J Am Geriatr Soc. 2020;68(7):1568-1572. https://doi.org/10.1111/jgs.16441
11. Centers for Medicare & Medicaid Services. Hospital Readmissions Reduction Program (HRRP) Archives. Accessed February 10, 2021. https://www.cms.gov/Medicare/Medicare-Fee-for-Service-Payment/AcuteInpatientPPS/HRRP-Archives
12. Figueroa JF, Burke LG, Zheng J, Orav EJ, Jha AK. Trends in hospitalization vs observation stay for ambulatory care-sensitive conditions. JAMA Intern Med. 2019;179(12): 1714-1716. https://doi.org/10.1001/jamainternmed.2019.3177
13. Public Law 111-148, Patient Protection and Affordable Care Act, 111th Congress. March 23, 2010. Accessed March 12, 2021.https://www.congress.gov/111/plaws/publ148/PLAW-111publ148.pdf
The Hospital Readmissions Reduction Program (HRRP) was designed to improve quality and safety for traditional Medicare beneficiaries.1 Since 2012, the program has reduced payments to institutions with excess inpatient rehospitalizations within 30 days of an index inpatient stay for targeted medical conditions. Observation hospitalizations, billed as outpatient and covered under Medicare Part B, are not counted as index or 30-day rehospitalizations under HRRP methods. Historically, observation occurred almost exclusively in observation units. Now, observation hospitalizations commonly occur on hospital wards, even in intensive care units, and are often clinically indistinguishable from inpatient hospitalizations billed under Medicare Part A.2 The Centers for Medicare & Medicaid Services (CMS) state that beneficiaries expected to need 2 or more midnights of hospital care should generally be considered inpatients, yet observation hospitalizations commonly exceed 2 midnights.3,4
The increasing use of observation hospitalizations5,6 raises questions about its impact on HRRP measurements. While observation hospitalizations have been studied as part of 30-day follow-up (numerator) to index inpatient hospitalizations,5,6 little is known about how observation hospitalizations impact rates when they are factored in as both index stays (denominator) and in the 30-day rehospitalization rate (numerator).2,7 We analyzed the complete combinations of observation and inpatient hospitalizations, including observation as index hospitalization, rehospitalization, or both, to determine HRRP impact.
METHODS
Study Cohort
Medicare fee-for-service standard claim files for all beneficiaries (100% population file version) were used to examine qualifying index inpatient and observation hospitalizations between January 1, 2014, and November 30, 2014, as well as 30-day inpatient and observation rehospitalizations. We used CMS’s 30-day methodology, including previously described standard exclusions (Appendix Figure),8 except for the aforementioned inclusion of observation hospitalizations. Observation hospitalizations were identified using established methods,3,9,10 excluding those observation encounters coded with revenue center code 0761 only3,10 in order to be most conservative in identifying observation hospitalizations (Appendix Figure). These methods assign hospitalization type (observation or inpatient) based on the final (billed) status. The terms hospitalization and rehospitalization refer to both inpatient and observation encounters. The University of Wisconsin Health Sciences Institutional Review Board approved this study.
Hospital Readmissions Reduction Program
Index HRRP admissions for congestive heart failure, chronic obstructive pulmonary disease, myocardial infarction, and pneumonia were examined as a prespecified subgroup.1,11 Coronary artery bypass grafting, total hip replacement, and total knee replacement were excluded in this analysis, as no crosswalk exists between International Classification of Diseases, Ninth Revision codes and Current Procedural Terminology codes for these surgical conditions.11
Analysis
Analyses were conducted at the encounter level, consistent with CMS methods.8 Descriptive statistics were used to summarize index and 30-day outcomes.
RESULTS
Of 8,859,534 index hospitalizations for any reason or diagnosis, 1,597,837 (18%) were observation and 7,261,697 (82%) were inpatient. Including all hospitalizations, 23% (390,249/1,689,609) of rehospitalizations were excluded from readmission measurement by virtue of the index hospitalization and/or 30-day rehospitalization being observation (Table 1 and Table 2).
For the subgroup of HRRP conditions, 418,923 (11%) and 3,387,849 (89%) of 3,806,772 index hospitalizations were observation and inpatient, respectively. Including HRRP conditions only, 18% (155,553/876,033) of rehospitalizations were excluded from HRRP reporting owing to observation hospitalization as index, 30-day outcome, or both. Of 188,430 index/30-day pairs containing observation, 34% (63,740) were observation/inpatient, 53% (100,343) were inpatient/observation, and 13% (24,347) were observation/observation (Table 1 and Table 2).
DISCUSSION
By ignoring observation hospitalizations in 30-day HRRP quality metrics, nearly one of five potential rehospitalizations is missed. Observation hospitalizations commonly occur as either the index event or 30-day outcome, so accurately determining 30-day HRRP rates must include observation in both positions. Given hospital variability in observation use,3,7 these findings are critically important to accurately understand rehospitalization risk and indicate that HRRP may not be fulfilling its intended purpose.
Including all hospitalizations for any diagnosis, we found that observation and inpatient hospitalizations commonly occur within 30 days of each other. Nearly one in four hospitalization/rehospitalization pairs include observation as index, 30-day rehospitalization, or both. Although not directly related to HRRP metrics, these data demonstrate the growing importance and presence of outpatient (observation) hospitalizations in the Medicare program.
Our study adds to the evolving body of literature investigating quality measures under a two-tiered hospital system where inpatient hospitalizations are counted and observation hospitalizations are not. Figueroa and colleagues12 found that improvements in avoidable admission rates for patients with ambulatory care–sensitive conditions were largely attributable to a shift from counted inpatient to uncounted observation hospitalizations. In other words, hospitalizations were still occurring, but were not being tallied due to outpatient (observation) classification. Zuckerman et al5 and the Medicare Payment Advisory Commission (MedPAC)6 concluded that readmissions improvements recognized by the HRRP were not explained by a shift to more observation hospitalizations following an index inpatient hospitalization; however, both studies included observation hospitalizations as part of 30-day rehospitalization (numerator) only, not also as part of index hospitalizations (denominator). Our study confirms the importance of including observation hospitalizations in both the index (denominator) and 30-day (numerator) rehospitalization positions to determine the full impact of observation hospitalizations on Medicare’s HRRP metrics.
Our study has limitations. We focused on nonsurgical HRRP conditions, which may have impacted our findings. Additionally, some authors have suggested including emergency department (ED) visits in rehospitalization studies.7 Although ED visits occur at hospitals, they are not hospitalizations; we excluded them as a first step. Had we included ED visits, encounters excluded from HRRP measurements would have increased, suggesting that our findings, while sizeable, are likely conservative. Additionally, we could not determine the merits or medical necessity of hospitalizations (inpatient or outpatient observation), but this is an inherent limitation in a large claims dataset like this one. Finally, we only included a single year of data in this analysis, and it is possible that additional years of data would show different trends. However, we have no reason to believe the study year to be an aberrant year; if anything, observation rates have increased since 2014,6 again pointing out that while our findings are sizable, they are likely conservative. Future research could include additional years of data to confirm even greater proportions of rehospitalizations exempt from HRRP over time due to observation hospitalizations as index and/or 30-day events.
Outpatient observation hospitalizations can occur anywhere in the hospital and are often clinically similar to inpatient hospitalizations, yet observation hospitalizations are essentially invisible under inpatient quality metrics. Requiring the HRRP to include observation hospitalizations is the most obvious solution, but this could require major regulatory and legislative change11,13—change that would fix a metric but fail to address broad policy concerns inherent in the two-tiered observation and inpatient billing distinction. Instead, CMS and Congress might consider this an opportunity to address the oxymoron of “outpatient hospitalizations” by engaging in comprehensive observation reform.
1. Centers for Medicare & Medicaid Services. Hospital Readmissions Reduction Program (HRRP). Accessed March 12, 2021. https://www.cms.gov/Medicare/Medicare-Fee-for-Service-Payment/AcuteInpatientPPS/Readmissions-Reduction-Program
2. Sabbatini AK, Wright B. Excluding observation stays from readmission rates—what quality measures are missing. N Engl J Med. 2018;378(22):2062-2065. https://doi.org/10.1056/NEJMp1800732
3. Sheehy AM, Powell WR, Kaiksow FA, et al. Thirty-day re-observation, chronic re-observation, and neighborhood disadvantage. Mayo Clin Proc. 2020;95(12):2644-2654. https://doi.org/10.1016/j.mayocp.2020.06.059
4. US Department of Health and Human Services. Office of Inspector General. Vulnerabilities remain under Medicare’s 2-midnight hospital policy. December 19, 2016. Accessed February 11, 2021. https://oig.hhs.gov/oei/reports/oei-02-15-00020.asp
5. Zuckerman RB, Sheingold SH, Orav EJ, Ruhter J, Epstein AM. Readmissions, observation and the Hospital Readmissions Reduction Program. N Engl J Med. 2016;374(16):1543-1551. https://doi.org/10.1056/NEJMsa1513024
6. Medicare Payment Advisory Commission. Mandated report: the effects of the Hospital Readmissions Reduction Program. In: Report to the Congress: Medicare and the Health Care Delivery System. 2018;3-31. Accessed March 17, 2021. Available at: http://www.medpac.gov/docs/default-source/reports/jun18_medpacreporttocongress_rev_nov2019_note_sec.pdf?sfvrsn=0
7. Wadhera RK, Yeh RW, Maddox KEJ. The Hospital Readmissions Reduction Program—time for a reboot. N Engl J Med. 2019;380(24):2289-2291. https://doi.org/10.1056/NEJMp1901225
8. National Quality Forum. Measure #1789: Hospital-wide all-cause unplanned readmission measure. Accessed January 30, 2021. https://www.qualityforum.org/ProjectDescription.aspx?projectID=73619
9. Sheehy AM, Shi F, Kind AJH. Identifying observation stays in Medicare data: policy implications of a definition. J Hosp Med. 2019;14(2):96-100. https://doi.org/10.12788/jhm.3038
10. Powell WR, Kaiksow FA, Kind AJH, Sheehy AM. What is an observation stay? Evaluating the use of hospital observation stays in Medicare. J Am Geriatr Soc. 2020;68(7):1568-1572. https://doi.org/10.1111/jgs.16441
11. Centers for Medicare & Medicaid Services. Hospital Readmissions Reduction Program (HRRP) Archives. Accessed February 10, 2021. https://www.cms.gov/Medicare/Medicare-Fee-for-Service-Payment/AcuteInpatientPPS/HRRP-Archives
12. Figueroa JF, Burke LG, Zheng J, Orav EJ, Jha AK. Trends in hospitalization vs observation stay for ambulatory care-sensitive conditions. JAMA Intern Med. 2019;179(12): 1714-1716. https://doi.org/10.1001/jamainternmed.2019.3177
13. Public Law 111-148, Patient Protection and Affordable Care Act, 111th Congress. March 23, 2010. Accessed March 12, 2021.https://www.congress.gov/111/plaws/publ148/PLAW-111publ148.pdf
© 2021 Society of Hospital Medicine
Scholarly Productivity and Rank in Academic Hospital Medicine
Hospital medicine has grown rapidly, with more than 50,000 hospitalists practicing nationally in 2016.1 Despite the remarkable increase in academic hospital medicine faculty (AHMF), scholarly productivity remains underdeveloped. Prior evidence suggests peer-reviewed publications remain an important aspect of promotion in academic hospital medicine.2 However, there are multiple barriers to robust scholarly productivity among AHMF, including inadequate mentorship,3 lack of protected scholarship time,4 and greater participation in nonclinical activities outside of peer-reviewed clinical research.5 Though research barriers have been described previously, the current state of scholarly productivity among AHMF has not been characterized. In this cross-sectional study, we describe the distribution of academic rank and scholarly output of a national sample of AHMF.
METHODS
Study Design and Data Source
We performed a cross-sectional study of AHMF at the top 25 internal medicine residency programs as determined by Doximity.com as of February 1, 2020 (Appendix Table 1). Between March and August 2020, two authors (NS, MT) visited each residency program’s website, identified all faculty listed as members of the hospital medicine program, and extracted demographic data, including degrees, sex, residency, medical school, year of residency graduation, completion of chief residency, completion of fellowship, and rank. We categorized all academic titles into full professor, associate professor, assistant professor, and instructor/lecturer. Missing information was supplemented by searching state licensing websites and Doximity.com. Sex was validated using Genderize.io. We queried the Scopus database for each AHMF’s name and affiliated institution to extract publications, citations, and H-index (metric of productivity and impact, derived from the number of publications and their associated citations).6 We categorized medical schools by rank (top 25, top 50, or unranked), as defined by the 2020 US News Best Medical Schools, sorted by research7 and by location (United States, international Caribbean, and international non-Caribbean). We excluded programs without hospital medicine section/division webpages and AHMF with nonpromotion titles such as “adjunct professor” or “acting professor” or those with missing data that could not be identified using these methods.
Analysis
Summary statistics were generated using means with standard deviations and medians with interquartile ranges. We evaluated postresidency years 6 to 10 and 14 to 18 as conservative time frames for promotion to associate and full professor, respectively. These windows account for time spent for additional degrees, instructor years, and alternative career pathways. Demographic differences between academic ranks were determined using chi-square and Kruskal-Wallis analyses.
Because promotion occurs sequentially, a proportional odds logistic regression model was used to evaluate the association of academic rank and H-index, number of years post residency, completion of chief residency, graduation from a top 25 medical school, and sex. Since not all programs have the instructor/lecturer rank, only assistant, associate, and full professors were included in this model. Significance was assessed with the likelihood ratio test. The proportional odds assumption was assessed using the score test. All adjusted odds ratios and their associated 95% confidence intervals were recorded. A two-tailed P value < .05 was considered significant for this study, and SAS version 9.4 (SAS Institute Inc) was used to conduct all analyses. This study was approved by the UT Southwestern Institutional Review Board.
RESULTS
Cohort Demographics
Of the top 25 internal medicine programs, 3 were excluded because they did not have websites that listed AHMF. Of the remaining 22 programs, we identified 1,829 AHMF. We excluded 166 AHMF because we could not identify title or year of residency graduation and 109 for having nonpromotion titles, leaving 1,554 AHMF (Appendix Figure). The cohort characteristics are described in Table 1. 

Research Productivity
A total of 9,809 documents had been published by this cohort of academic hospitalists (Appendix Table 2). Overall mean (SD) and median (IQR) publications were 6.3 (24.3) and 0.0 (0.0-4.0), respectively. A total of 799 (51.4%) AHMF had no publications, 347 (22.3%) had one to three publications, 209 (13.4%) had 10 or more, and 39 (2.5%) had 50 or more. The median number of publications stratified by academic rank were 0.0 (IQR, 0.0-1.0) for instructors, 0.0 (IQR, 0.0-3.0) for assistant professors, 8.0 (IQR, 2.0-23.0) for associate professors, and 38.0 (IQR, 6.0-99.0) for full professors. Among men, 54.3% had published at least one manuscript, compared to 42.7% of women (P < .0001). The distribution of H-indices by years since residency graduation is shown in the Figure. The median number of documents published by faculty 6 to 10 years post residency was 1.0 (IQR, 0.0-4.0), with 46.8% of these faculty without a publication. For faculty 14 to 18 years post residency, the median number of documents was 3.0 (IQR, 0.0-11.0), with 30.1% of these faculty without a publication. Years post residency and academic rank were correlated with higher H-indices as well as more publications and citations (P < .0001).
Factors Associated With Academic Rank
Factors associated with rank are described in Appendix Table 3. In our multivariable ordinal regression model, H-index (adjusted odds ratio [aOR], 1.16 per single H-index point; 95% CI, 1.12-1.20), years post residency graduation (aOR, 1.14; 95% CI, 1.11-1.17), completion of chief residency (aOR, 2.46; 95% CI, 1.34-4.51), and graduation from a top 25 medical school (aOR, 2.10; 95% CI, 1.44-3.06) were associated with promotion.
DISCUSSION
In this cross-sectional analysis of more than 1,500 AHMF at the top 25 internal medicine residencies in the United States, 88.3% were instructors or assistant professors, while only 11.7% were associate or full professors. Furthermore, 51.4% were without a publication, and only 26.3% had published more than three manuscripts. Last, H-index, completion of a chief residency, years post residency, and graduation from a top 25 medical school were associated with higher academic rank.
Only 2.7% of the cohort were full professors, and 9.0% were associate professors. In comparison, academic cardiology faculty are 28.2% full professors and 22.9% associate professors.8 While the field of hospital medicine is relatively new, many faculty members had practiced for the expected duration of time for promotion consideration, with assistant professors or instructors constituting 89.9% of faculty at 6 to 10 years and 63.6% of faculty at 14 to 18 years post residency. We additionally observed a gender gap in publication history in hospital medicine, consistent with prior studies in hospital medicine that suggested gender disparities in scholarship.9,10 Increased focus will be needed in the future to ensure opportunities for scholarship are equitable for all faculty in hospital medicine.
Our findings suggest that scholarly productivity in academic hospital medicine remains a challenge. Prior studies have reported that less than half of academic hospitalists have ever published, and fewer than one in eight have received research funding.11,12 It is encouraging, however, that publications increase with time after residency. These data are consistent with the literature demonstrating a modest increase in hospitalists who had ever published, increasing from 43.0% in 2012 to 48.6% in 2020.12 Despite these trends, however, some early-career academic hospitalists report ambivalence toward academic productivity and promotion.13 Whether this ambivalence is the source of low scholarship output or the outcome of insufficient mentorship and limited research success is uncertain. But these factors, combined with the pressures of clinical productivity, the existing lack of mentorship, and inadequate protected research time represent barriers to successful scholarship in academic hospital medicine.3,14
Our study has several limitations. First, our inclusion criteria for the top 25 internal medicine residencies may have excluded hospital medicine divisions with substantial scholarly productivity. However, with 21 of the 25 programs listed on Doximity.com in the top 25 for internal medicine research funding, it is likely that our results overestimate scholarly productivity if compared to a complete, national cohort of AHMF.15 Second, our findings may not be generalizable to hospitalists who practice in nonacademic settings. Third, we were unable to account for differences in promotion criteria/tracks or scholarly output expectations between institutions. This limitation has been seen similarly in prior studies linking promotion and H-index.2 Furthermore, our study does not capture promotion via other pathways that may not depend on scholarly output, such as hospital leadership roles. Last, as data were abstracted from academic center websites, it is possible that not all information was accurate or updated. However, we randomly reevaluated 25% of hospital division webpages 6 months after our initial data collection and noted that all had been updated with new faculty and academic ranks, suggesting our data were accurate.
These data highlight that research productivity and academic promotion remain challenges in academic hospital medicine. Future studies may examine topics that include understanding pathways and milestones to promotion, reducing disparities in scholarship, and improving mentorship, protected time, and research funding in academic hospital medicine.
1. Wachter RM, Goldman L. Zero to 50,000—the 20th anniversary of the hospitalist. N Engl J Med. 2016;375(11):1009-1011. https://doi.org/10.1056/NEJMp1607958
2. Leykum LK, Parekh VI, Sharpe B, Boonyasai RT, Centor RM. Tried and true: a survey of successfully promoted academic hospitalists. J Hosp Med. 2011;6(7):411-415. https://doi.org/10.1002/jhm.894
3. Harrison R, Hunter AJ, Sharpe B, Auerbach AD. Survey of US academic hospitalist leaders about mentorship and academic activities in hospitalist groups. J Hosp Med. 2011;6(1):5-9. https://doi.org/10.1002/jhm.836
4. Cumbler E, Rendón P, Yirdaw E, et al. Keys to career success: resources and barriers identified by early career academic hospitalists. J Gen Intern Med. 2018;33(5):588-589. https://doi.org/10.1007/s11606-018-4336-7
5. Flanders SA, Centor B, Weber V, McGinn T, DeSalvo K, Auerbach A. Challenges and opportunities in academic hospital medicine: report from the Academic Hospital Medicine Summit. J Hosp Med. 2009;4(4):240-246. https://doi.org/10.1002/jhm.497
6. Hirsch JE. An index to quantify an individual’s scientific research output. Proc Natl Acad Sci U S A. 2005;102(46):16569-16572. https://doi.org/10.1073/pnas.0507655102
7. 2021 Best Medical Schools: Research. U.S. News & World Report. Accessed April 23, 2021. https://www.usnews.com/best-graduate-schools/top-medical-schools/research-rankings
8. Blumenthal DM, Olenski AR, Yeh RW, et al. Sex differences in faculty rank among academic cardiologists in the United States. Circulation. 2017;135(6):506-517. https://doi.org/10.1161/CIRCULATIONAHA.116.023520
9. Burden M, Frank MG, Keniston A, et al. Gender disparities in leadership and scholarly productivity of academic hospitalists. J Hosp Med. 2015;10(8):481-485. https://doi.org/10.1002/jhm.2340
10. Adler E, Hobbs A, Dhaliwal G, Babik JM. Gender differences in authorship of clinical problem-solving articles. J Hosp Med. 2020;15(8):475-478. https://doi.org/10.12788/jhm.3465
11. Chopra V, Burden M, Jones CD, et al. State of research in adult hospital medicine: results of a national survey. J Hosp Med. 2019;14(4):207-211. https://doi.org/10.12788/jhm.3136
12. Dang Do AN, Munchhof AM, Terry C, Emmett T, Kara A. Research and publication trends in hospital medicine. J Hosp Med. 2014;9(3):148-154. https://doi.org/10.1002/jhm.2148
13. Cumbler E, Yirdaw E, Kneeland P, et al. What is career success for academic hospitalists? A qualitative analysis of early-career faculty perspectives. J Hosp Med. 2018;13(6):372-377. https://doi.org/10.12788/jhm.2924
14. Reid MB, Misky GJ, Harrison RA, Sharpe B, Auerbach A, Glasheen JJ. Mentorship, productivity, and promotion among academic hospitalists. J Gen Intern Med. 2012;27(1):23-27. https://doi.org/10.1007/s11606-011-1892-5
15. Roskoski R Jr, Parslow TG. Ranking tables of NIH funding to US medical schools in 2019. Accessed April 23, 2021. http://www.brimr.org/NIH_Awards/2019/NIH_Awards_2019.htm
Hospital medicine has grown rapidly, with more than 50,000 hospitalists practicing nationally in 2016.1 Despite the remarkable increase in academic hospital medicine faculty (AHMF), scholarly productivity remains underdeveloped. Prior evidence suggests peer-reviewed publications remain an important aspect of promotion in academic hospital medicine.2 However, there are multiple barriers to robust scholarly productivity among AHMF, including inadequate mentorship,3 lack of protected scholarship time,4 and greater participation in nonclinical activities outside of peer-reviewed clinical research.5 Though research barriers have been described previously, the current state of scholarly productivity among AHMF has not been characterized. In this cross-sectional study, we describe the distribution of academic rank and scholarly output of a national sample of AHMF.
METHODS
Study Design and Data Source
We performed a cross-sectional study of AHMF at the top 25 internal medicine residency programs as determined by Doximity.com as of February 1, 2020 (Appendix Table 1). Between March and August 2020, two authors (NS, MT) visited each residency program’s website, identified all faculty listed as members of the hospital medicine program, and extracted demographic data, including degrees, sex, residency, medical school, year of residency graduation, completion of chief residency, completion of fellowship, and rank. We categorized all academic titles into full professor, associate professor, assistant professor, and instructor/lecturer. Missing information was supplemented by searching state licensing websites and Doximity.com. Sex was validated using Genderize.io. We queried the Scopus database for each AHMF’s name and affiliated institution to extract publications, citations, and H-index (metric of productivity and impact, derived from the number of publications and their associated citations).6 We categorized medical schools by rank (top 25, top 50, or unranked), as defined by the 2020 US News Best Medical Schools, sorted by research7 and by location (United States, international Caribbean, and international non-Caribbean). We excluded programs without hospital medicine section/division webpages and AHMF with nonpromotion titles such as “adjunct professor” or “acting professor” or those with missing data that could not be identified using these methods.
Analysis
Summary statistics were generated using means with standard deviations and medians with interquartile ranges. We evaluated postresidency years 6 to 10 and 14 to 18 as conservative time frames for promotion to associate and full professor, respectively. These windows account for time spent for additional degrees, instructor years, and alternative career pathways. Demographic differences between academic ranks were determined using chi-square and Kruskal-Wallis analyses.
Because promotion occurs sequentially, a proportional odds logistic regression model was used to evaluate the association of academic rank and H-index, number of years post residency, completion of chief residency, graduation from a top 25 medical school, and sex. Since not all programs have the instructor/lecturer rank, only assistant, associate, and full professors were included in this model. Significance was assessed with the likelihood ratio test. The proportional odds assumption was assessed using the score test. All adjusted odds ratios and their associated 95% confidence intervals were recorded. A two-tailed P value < .05 was considered significant for this study, and SAS version 9.4 (SAS Institute Inc) was used to conduct all analyses. This study was approved by the UT Southwestern Institutional Review Board.
RESULTS
Cohort Demographics
Of the top 25 internal medicine programs, 3 were excluded because they did not have websites that listed AHMF. Of the remaining 22 programs, we identified 1,829 AHMF. We excluded 166 AHMF because we could not identify title or year of residency graduation and 109 for having nonpromotion titles, leaving 1,554 AHMF (Appendix Figure). The cohort characteristics are described in Table 1.
Research Productivity
A total of 9,809 documents had been published by this cohort of academic hospitalists (Appendix Table 2). Overall mean (SD) and median (IQR) publications were 6.3 (24.3) and 0.0 (0.0-4.0), respectively. A total of 799 (51.4%) AHMF had no publications, 347 (22.3%) had one to three publications, 209 (13.4%) had 10 or more, and 39 (2.5%) had 50 or more. The median number of publications stratified by academic rank were 0.0 (IQR, 0.0-1.0) for instructors, 0.0 (IQR, 0.0-3.0) for assistant professors, 8.0 (IQR, 2.0-23.0) for associate professors, and 38.0 (IQR, 6.0-99.0) for full professors. Among men, 54.3% had published at least one manuscript, compared to 42.7% of women (P < .0001). The distribution of H-indices by years since residency graduation is shown in the Figure. The median number of documents published by faculty 6 to 10 years post residency was 1.0 (IQR, 0.0-4.0), with 46.8% of these faculty without a publication. For faculty 14 to 18 years post residency, the median number of documents was 3.0 (IQR, 0.0-11.0), with 30.1% of these faculty without a publication. Years post residency and academic rank were correlated with higher H-indices as well as more publications and citations (P < .0001).
Factors Associated With Academic Rank
Factors associated with rank are described in Appendix Table 3. In our multivariable ordinal regression model, H-index (adjusted odds ratio [aOR], 1.16 per single H-index point; 95% CI, 1.12-1.20), years post residency graduation (aOR, 1.14; 95% CI, 1.11-1.17), completion of chief residency (aOR, 2.46; 95% CI, 1.34-4.51), and graduation from a top 25 medical school (aOR, 2.10; 95% CI, 1.44-3.06) were associated with promotion.
DISCUSSION
In this cross-sectional analysis of more than 1,500 AHMF at the top 25 internal medicine residencies in the United States, 88.3% were instructors or assistant professors, while only 11.7% were associate or full professors. Furthermore, 51.4% were without a publication, and only 26.3% had published more than three manuscripts. Last, H-index, completion of a chief residency, years post residency, and graduation from a top 25 medical school were associated with higher academic rank.
Only 2.7% of the cohort were full professors, and 9.0% were associate professors. In comparison, academic cardiology faculty are 28.2% full professors and 22.9% associate professors.8 While the field of hospital medicine is relatively new, many faculty members had practiced for the expected duration of time for promotion consideration, with assistant professors or instructors constituting 89.9% of faculty at 6 to 10 years and 63.6% of faculty at 14 to 18 years post residency. We additionally observed a gender gap in publication history in hospital medicine, consistent with prior studies in hospital medicine that suggested gender disparities in scholarship.9,10 Increased focus will be needed in the future to ensure opportunities for scholarship are equitable for all faculty in hospital medicine.
Our findings suggest that scholarly productivity in academic hospital medicine remains a challenge. Prior studies have reported that less than half of academic hospitalists have ever published, and fewer than one in eight have received research funding.11,12 It is encouraging, however, that publications increase with time after residency. These data are consistent with the literature demonstrating a modest increase in hospitalists who had ever published, increasing from 43.0% in 2012 to 48.6% in 2020.12 Despite these trends, however, some early-career academic hospitalists report ambivalence toward academic productivity and promotion.13 Whether this ambivalence is the source of low scholarship output or the outcome of insufficient mentorship and limited research success is uncertain. But these factors, combined with the pressures of clinical productivity, the existing lack of mentorship, and inadequate protected research time represent barriers to successful scholarship in academic hospital medicine.3,14
Our study has several limitations. First, our inclusion criteria for the top 25 internal medicine residencies may have excluded hospital medicine divisions with substantial scholarly productivity. However, with 21 of the 25 programs listed on Doximity.com in the top 25 for internal medicine research funding, it is likely that our results overestimate scholarly productivity if compared to a complete, national cohort of AHMF.15 Second, our findings may not be generalizable to hospitalists who practice in nonacademic settings. Third, we were unable to account for differences in promotion criteria/tracks or scholarly output expectations between institutions. This limitation has been seen similarly in prior studies linking promotion and H-index.2 Furthermore, our study does not capture promotion via other pathways that may not depend on scholarly output, such as hospital leadership roles. Last, as data were abstracted from academic center websites, it is possible that not all information was accurate or updated. However, we randomly reevaluated 25% of hospital division webpages 6 months after our initial data collection and noted that all had been updated with new faculty and academic ranks, suggesting our data were accurate.
These data highlight that research productivity and academic promotion remain challenges in academic hospital medicine. Future studies may examine topics that include understanding pathways and milestones to promotion, reducing disparities in scholarship, and improving mentorship, protected time, and research funding in academic hospital medicine.
1. Wachter RM, Goldman L. Zero to 50,000—the 20th anniversary of the hospitalist. N Engl J Med. 2016;375(11):1009-1011. https://doi.org/10.1056/NEJMp1607958
2. Leykum LK, Parekh VI, Sharpe B, Boonyasai RT, Centor RM. Tried and true: a survey of successfully promoted academic hospitalists. J Hosp Med. 2011;6(7):411-415. https://doi.org/10.1002/jhm.894
3. Harrison R, Hunter AJ, Sharpe B, Auerbach AD. Survey of US academic hospitalist leaders about mentorship and academic activities in hospitalist groups. J Hosp Med. 2011;6(1):5-9. https://doi.org/10.1002/jhm.836
4. Cumbler E, Rendón P, Yirdaw E, et al. Keys to career success: resources and barriers identified by early career academic hospitalists. J Gen Intern Med. 2018;33(5):588-589. https://doi.org/10.1007/s11606-018-4336-7
5. Flanders SA, Centor B, Weber V, McGinn T, DeSalvo K, Auerbach A. Challenges and opportunities in academic hospital medicine: report from the Academic Hospital Medicine Summit. J Hosp Med. 2009;4(4):240-246. https://doi.org/10.1002/jhm.497
6. Hirsch JE. An index to quantify an individual’s scientific research output. Proc Natl Acad Sci U S A. 2005;102(46):16569-16572. https://doi.org/10.1073/pnas.0507655102
7. 2021 Best Medical Schools: Research. U.S. News & World Report. Accessed April 23, 2021. https://www.usnews.com/best-graduate-schools/top-medical-schools/research-rankings
8. Blumenthal DM, Olenski AR, Yeh RW, et al. Sex differences in faculty rank among academic cardiologists in the United States. Circulation. 2017;135(6):506-517. https://doi.org/10.1161/CIRCULATIONAHA.116.023520
9. Burden M, Frank MG, Keniston A, et al. Gender disparities in leadership and scholarly productivity of academic hospitalists. J Hosp Med. 2015;10(8):481-485. https://doi.org/10.1002/jhm.2340
10. Adler E, Hobbs A, Dhaliwal G, Babik JM. Gender differences in authorship of clinical problem-solving articles. J Hosp Med. 2020;15(8):475-478. https://doi.org/10.12788/jhm.3465
11. Chopra V, Burden M, Jones CD, et al. State of research in adult hospital medicine: results of a national survey. J Hosp Med. 2019;14(4):207-211. https://doi.org/10.12788/jhm.3136
12. Dang Do AN, Munchhof AM, Terry C, Emmett T, Kara A. Research and publication trends in hospital medicine. J Hosp Med. 2014;9(3):148-154. https://doi.org/10.1002/jhm.2148
13. Cumbler E, Yirdaw E, Kneeland P, et al. What is career success for academic hospitalists? A qualitative analysis of early-career faculty perspectives. J Hosp Med. 2018;13(6):372-377. https://doi.org/10.12788/jhm.2924
14. Reid MB, Misky GJ, Harrison RA, Sharpe B, Auerbach A, Glasheen JJ. Mentorship, productivity, and promotion among academic hospitalists. J Gen Intern Med. 2012;27(1):23-27. https://doi.org/10.1007/s11606-011-1892-5
15. Roskoski R Jr, Parslow TG. Ranking tables of NIH funding to US medical schools in 2019. Accessed April 23, 2021. http://www.brimr.org/NIH_Awards/2019/NIH_Awards_2019.htm
© 2021 Society of Hospital Medicine
As the Story Unfolds
A 78-year-old woman presented to the ambulatory care clinic for a painful tongue mass. She noticed the mass 2 months prior to presentation, and it had not grown in the interim. She had left-sided jaw pain when opening her mouth and persistent left-sided otalgia.
In the evaluation of tongue masses, ulcerations, or other surface abnormalities, exclusion of squamous cell carcinoma is the top priority. Additional tongue surface abnormalities include benign lesions such as geographic tongue, inflammatory conditions such as lichen planus, and infections such as syphilis.
The ear and jaw pain may reflect metastatic spread, neural invasion, or referred pain from the tongue. A vasculitis with predilection for the head, such as giant cell arteritis, could present with oral and ear pain. Jaw pain with mastication could reflect jaw claudication, but pain upon mouth opening is more commonly explained by temporomandibular joint dysfunction.
The patient had hypertension, hyperlipidemia, chronic kidney disease (estimated glomerular filtration rate of 42 mL/min), and diabetes mellitus. Four months prior she was diagnosed with a chronic obstructing left renal calculus on ultrasonography to evaluate chronic kidney disease. Two months prior heart failure with preserved ejection fraction was diagnosed. Stress cardiac magnetic resonance imaging (MRI) demonstrated normal ejection fraction, asymmetric septal hypertrophy, and stress-induced subendocardial perfusion defect. Her medications were metoprolol, lisinopril, simvastatin, meloxicam, and aspirin. She never used tobacco and did not consume alcohol. She was born in the Philippines and emigrated to the United States 15 years ago. She had not experienced fever, chills, hearing loss, tinnitus, cough, dysphonia, neck swelling, or joint pain. She had lost 3 kg in the previous 4 months.
The absence of tobacco and alcohol use reduces the probability of a squamous cell carcinoma, although human papillomavirus–associated squamous cell carcinoma of the tongue remains possible. Asymmetric septal hypertrophy is characteristic of hypertrophic cardiomyopathy or an infiltrative cardiomyopathy. Sarcoidosis can affect the heart and can account for the renal calculus (via hypercalcemia). Amyloid light-chain (AL) amyloidosis could involve the heart and the tongue, although in amyloidosis the cardiac MRI typically displays late gadolinium enhancement and ventricular wall thickening. The absence of tinnitus or hearing loss suggests that the left-sided otalgia is referred pain from the tongue and oral cavity rather than a primary otologic disease (eg, infection).
On physical examination, temperature was 37.2 °C, heart rate was 88 beats per minute, blood pressure was 134/62 mm Hg, and oxygen saturation was 99% while breathing ambient air. The patient’s weight was 40.4 kg (body mass index of 19.26 kg/m2). Intraoral examination revealed induration of the bilateral tongue, an erosive 1-cm pedunculated mass of the left dorsum, rough white coating on the right dorsum, and fullness of the right lateral surface with an erosion abutting tooth #2. The right submandibular salivary gland was firm. The otoscopic examination and remainder of the head and neck examination were normal. There was no cervical, supraclavicular, or axillary adenopathy. The cranial nerve, cardiovascular, pulmonary, abdominal, and skin examinations were normal.
The left-sided lingual mass and right-sided lingual erosion likely arise from the same process. Both are compatible with an infection (eg, syphilis or tuberculosis), cancer, autoimmune disease (eg, Crohn’s disease or sarcoidosis), or an infiltrative disease such as amyloidosis. Leukoplakia could reflect a candidal infection, dysplasia, squamous cell carcinoma, oral hairy leukoplakia, or hyperkeratosis. The isolated submandibular salivary gland could reflect sialadenitis from chronic salivary duct obstruction or a primary neoplasm, but more likely is caused by the same process causing the tongue abnormalities.
The white blood cell count was 8,600/μL; hemoglobin, 11.5 g/dL; mean corpuscular volume, 102.5 fL; and platelet count, 270,000/μL3. Serum sodium was 141 mEq/L; potassium, 4.1 mEq/L; chloride, 101 mEq/L; bicarbonate, 30 mEq/L; blood urea nitrogen, 19 mg/dL; creatinine, 0.7 mg/dL; and calcium, 10.4 mg/dL (reference range, 8.5-10.3). Total serum protein was 7.3 g/dL (reference range, 6.0-8.3); albumin was 3.7 g/dL. Liver biochemistry test results were normal. Serum folate and vitamin B12 levels were normal. Serum ferritin was 423 ng/mL (reference range, 11-306); transferrin saturation, 21.4% (reference range, 15.0%-50.0%); and total iron-binding capacity, 323 µg/dL (reference range, 261-478). Parathyroid hormone (PTH) was 14 pg/mL (reference range, 15-65). HIV antibody was negative.
The calcium level is at the upper range of normal, whereas the PTH level is at the lower range of normal. The differential diagnosis for PTH-independent hypercalcemia includes hypercalcemia of malignancy and granulomatous disease such as sarcoidosis. Mild hypercalcemia could contribute to the nephrolithiasis. The iron studies exclude iron deficiency and are not suggestive of anemia of chronic disease. The triad of mild hypercalcemia, cardiomyopathy, and anemia is compatible with AL amyloidosis (perhaps with associated multiple myeloma) or sarcoidosis; both disorders can present as a mass. Imaging of the head and neck and biopsy of the tongue mass are the next steps.
The left dorsal tongue mass was excised in clinic. Histopathology revealed ulcerated squamous mucosa with inflammatory changes but no malignancy. Imaging of the head and neck was scheduled.
Neither cancer or granulomas were detected, but inadequate sampling or staining must be considered. Inflammatory changes are compatible with infection, autoimmunity, and cancer; the latter can feature reactive changes that obscure the malignant cells. The absence of granulomas lowers, but does not eliminate, the possibility of sarcoidosis, tuberculosis, fungal infection, and granulomatosis with polyangiitis. Actinomycosis is an invasive orofacial infection that disregards anatomic boundaries and is characterized by inflammatory histology; although infection of the tongue is possible, infection of the jaw and face is more typical. Immunoglobulin G4–related disease can present as an inflammatory and invasive disorder; however, the characteristic histopathologic findings (lymphoplasmacytic infiltrate, fibrosis, and phlebitis) are absent.
Culture of the tissue for mycobacteria or fungi (she is at increased risk for both given her previous residency in the Philippines) could increase the diagnostic yield. Another biopsy of the tongue or an adjacent structure—guided by imaging—may provide a more diagnostic tissue sample.
MRI of the head and neck demonstrated hyperintense signal and prominence of the right lateral pterygoid muscle (Figure 1A) and slight enlargement of a right submandibular gland (Figure 1B). No tongue abnormalities were identified. Radiograph of the chest did not reveal infiltrates, masses, or lymphadenopathy.

The absence of the tongue mass on the MRI likely reflects excision of the mass at the time of biopsy. The signal enhancement in the right lateral pterygoid muscle and submandibular gland is suggestive of an infiltrative process. Infiltration of the right lateral pterygoid muscle may also explain the patient’s pain when opening her mouth. Infiltrative processes can be neoplastic (eg, salivary gland tumor, sarcoma, lymphoma), infectious (eg, mycobacterial or fungal), cellular (eg, histiocytes, mast cells, plasma cells, eosinophils, granulomas), or related to inert substances such as amyloid or iron.
Seven weeks later, the patient presented to the hospital for scheduled percutaneous nephrolithotomy of the obstructing renal calculus. The physical examination was unchanged. The complete blood count and metabolic panel were unchanged apart from hemoglobin of 9.9 g/dL and calcium of 11.5 mg/dL. Coagulation studies were within normal limits.
A percutaneous nephroureteral stent was placed under conscious sedation. The patient then underwent rapid sequence induction of general anesthesia for the nephrolithotomy with fentanyl, propofol, and rocuronium. Within minutes of initiating mechanical ventilation, severe periorbital and perioral edema, copious oral cavity bleeding, and bilateral periorbital purpura occurred. Sugammadex (neuromuscular blockade reversal) and dexamethasone were administered. Examination of the oral cavity was limited by the brisk bleeding; the right sided tongue erosion was unchanged.
Bleeding is caused by thrombocytopenia, thrombocytopathy, coagulopathy, or disruption of vessel integrity. Oral cavity bleeding could arise from the tongue ulceration, but could also reflect pulmonary, nasal, or gastrointestinal hemorrhage. Angioedema arises from mast cell– or bradykinin-mediated pathways; mast cell degranulation may have been precipitated by the anesthetic agents, opiate, or a material in the nephroureteral stent.
The edema and bleeding are temporally related to multiple medications and mechanical ventilation. A latent bleeding diathesis may have manifested in the setting of increased tissue hydrostatic pressure or vessel permeability. Amyloidosis can lead to vessel fragility and coagulopathy, and periorbital bleeding is characteristic of AL amyloidosis.
The hypercalcemia, now more pronounced, raises concern for malignancy (including multiple myeloma) and granulomatous diseases like sarcoidosis, mycobacterial infections, and fungal infections. The declining hemoglobin could be explained by chronic blood loss, hemolysis, anemia of chronic disease, or a bone marrow process.
The cardiomyopathy, bleeding disorder, and multifocal disease in the oral cavity can be explained by AL amyloidosis; the hypercalcemia suggests concomitant multiple myeloma.
At the time of the bleeding event, the partial thromboplastin time, prothrombin time, and fibrinogen were within the reference ranges. Factor X activity level was normal. No schistocytes were observed on peripheral blood smear. Immunoglobulin G level was 1,425 mg/dL (reference range, 639-1,349); IgA and IgM levels were within the reference range. Serum lambda free light chains were 151.78 mg/dL (reference range, 0.46-2.71), and the ratio of kappa to lambda light chains was 0.01 (reference range, 0.49-2.54). Serum protein electrophoresis and immunofixation demonstrated a monoclonal paraprotein (IgG lambda) level of 1.2 g/dL. Congo red staining of the previously excised left dorsal tongue mass was negative for apple-green birefringence. Reexamination of the oral cavity revealed macroglossia and scalloping of the tongue (Figure 2).

Scalloping is characteristic of an infiltrative disorder that enlarges the tongue (macroglossia) and deforms its edges, which encounter the teeth. Macroglossia is seen in AL amyloidosis, acromegaly, and hypothyroidism. A monoclonal light chain, especially a lambda light chain, is characteristic of AL amyloidosis. The Congo red stain results can support the diagnosis when positive, but it has limited sensitivity. The tongue specimen can be sent for immunohistochemistry or mass spectrometry to evaluate for light chain deposition. A bone marrow biopsy can demonstrate a clonal plasma cell population. AL amyloidosis with concomitant multiple myeloma is the most likely diagnosis.
Bone marrow aspiration and core biopsy demonstrated 30% lambda-restricted plasma cells (Figure 3A-C). Congo red staining demonstrated apple-green birefringence of the bone marrow microvasculature (Figure 3D). Skeletal survey demonstrated widespread lytic bone disease involving the calvarium (Figure 4A), left humerus (Figure 4B), and left scapula (Figure 4B). Based on the monoclonal paraprotein, more than 10% monoclonal plasma cells, skeletal lesions, and hypercalcemia, she was diagnosed with IgG lambda multiple myeloma. Based on apple-green birefringence in the bone marrow and macroglossia, she was diagnosed with AL amyloidosis. The cardiac MRI findings were compatible with AL amyloidosis. 1

After three cycles of bortezomib and dexamethasone therapy to concurrently treat AL amyloidosis and multiple myeloma, the serum lambda light chain level decreased to 1.49 mg/dL and the monoclonal paraprotein level decreased to 0.3 g/dL. The calcium level was 9.8 mg/dL, and the hemoglobin level was 11.7 g/dL. The patient’s tongue pain resolved, allowing for improved oral intake and a 5.7-kg weight gain. The patient underwent nephrolithotomy 4 months after her initial presentation. She resumed an active lifestyle and recently traveled to visit relatives in the Philippines.

DISCUSSION
Oral diseases affect general health and quality of life and can be a harbinger of systemic disease. Tooth loss, caries, periodontal disease, and poorly fitting dentures commonly affect speech and nutrition.2 These common outpatient oral health issues can be the driving force for hospital admissions; for example, caries and periodontal disease can lead to suppurative odontogenic infection, endocarditis, brain abscess, and sepsis.
Tongue ulcerations, masses, and surface abnormalities often require consultation with a dentist or oral and maxillofacial surgeon to exclude squamous cell carcinoma.3 Other diagnostic considerations include benign neoplasms, trauma, inflammatory conditions (eg, sarcoidosis), infection (eg, syphilis, tuberculosis), and infiltrative processes such as amyloidosis.
Amyloidosis is a heterogeneous group of diseases caused by deposition of insoluble protein fibrils in tissues.4,5 The three most encountered forms of amyloidosis are AL, AA, and ATTR. Each form is named after the culprit protein.4 AL amyloidosis arises when a small clonal population of plasma cells in the bone marrow overproduces immunoglobulin light chain monomers.4,6 AA amyloidosis develops when the liver produces serum amyloid A protein (an acute phase reactant) in response to a chronic inflammatory condition such as rheumatoid arthritis or chronic intravenous drug injection.4 Transthyretin (TTR, also known as “prealbumin”) is a tetrameric protein that transports thyroxine and retinol; there are two forms of ATTR amyloidosis: hereditary and wild type. Hereditary ATTR amyloidosis develops from agglomeration of misfolded TTR monomers caused by mutations in the TTR gene. Wild-type ATTR amyloidosis is caused by age-related dissociation of the TTR tetramer into its constituent monomers that denature, misfold, and agglomerate into fibrils.5 Wild-type ATTR is now recognized as the most common form of amyloidosis, with 25% of myocardial autopsy specimens of patients 80 years or older demonstrating amyloid.7 The estimated incidence of AL amyloidosis is 10 cases per million person-years.8
Each amyloid protein homes in on specific anatomic sites.4 Characteristic combinations of organ dysfunction can suggest different forms of amyloidosis.9 Cardiac and peripheral nervous involvement (eg, carpal tunnel syndrome) is typical of both hereditary and wild-type ATTR amyloidosis; ATTR amyloidosis does not involve the kidney.4 AA amyloidosis most commonly manifests with proteinuria followed by declining glomerular filtration rate; heart failure is rare.4 The most common findings in AL amyloidosis are proteinuria, congestive heart failure, and sensory neuropathy.6 Gastrointestinal tract and hepatic involvement are each seen in nearly 20% of patients, and macroglossia is identified in approximately 10% of those with AL amyloidosis.6,10
Chronic deposition of amyloid can lead to acute presentations. Approximately 30% of patients with AL amyloidosis develop abnormal bleeding.11 Amyloid deposition in small blood vessels predisposes them to rupture. Bleeding events can be exacerbated by acquired coagulopathy due to plasma cell dyscrasia−associated thrombocytopenia, amyloid fibril adsorption of factor X, or hypofibrinogenemia.11,12 Periorbital purpura following minor trauma or transient venous hypertension is characteristic of AL amyloidosis.6,13 In this case, positive pressure ventilation and recumbent positioning increased hydrostatic pressure in the head and neck, causing rupture of the infiltrated small vessels around the eyes and in the oral cavity.14
Histological demonstration of tissue deposition of amyloid protein is the preferred method for amyloidosis diagnosis. Symptomatic sites or organs with dysfunction or radiologic changes are suitable for biopsy.6 If those sites are inaccessible or yield insufficient tissue quantity, abdominal fat pad aspiration or biopsy is indicated.15 Apple-green birefringence under polarized light of Congo red–stained tissue is characteristic, with sensitivity and specificity of approximately 80% and a positive predictive value of 85%.15 Immunoelectron microscopy is often performed simultaneously to confirm the diagnosis and determine the amyloid protein type.4,16 Immunoelectron microscopy’s sensitivity is approximately 80%, and it has specificity and positive predictive value both approaching 100%.15 Mass spectrometry is particularly useful in cases where the amyloid subtype is not clinically apparent (eg, a patient with an autoimmune condition or chronic infection as well as light chain abnormality).6 Cardiac MRI findings that suggest amyloidosis include a thickened left ventricle and late gadolinium enhancement.1 ATTR cardiac amyloidosis can be diagnosed using amyloid fibril–binding radiotracer technetium-99m-pyrophosphate scintigraphy; biopsy is often not necessary.1,4 Gene sequencing to differentiate between hereditary and wild-type forms of ATTR amyloidosis is beneficial.
The primary objectives of amyloidosis management are to control symptoms and inhibit amyloid protein production.6 Outcomes in AL amyloidosis have improved due to early diagnosis, new chemotherapeutic agents to eradicate the plasma cell clone, and autologous stem cell transplantation.6,17 Two new ATTR amyloidosis treatments are RNA interference therapies, which prevent TTR messenger RNA translation, and tafamidis, which stabilizes the TTR tetramer and prevents dissociation into its constituent monomers that precipitate in tissues.18 Both therapies can improve neuropathy-related quality of life.18 Tafamidis slows disease progression and decreases all-cause mortality in patients with hereditary and wild-type ATTR cardiac amyloidosis.19
Multiple myeloma and AL amyloidosis are both plasma cell dyscrasias involving the bone marrow, but they represent distinct disease processes with different clinical features.6 Multiple myeloma is characterized by marked expansion of a clonal plasma cell population within the bone marrow that aberrantly produces immunoglobulin. Conversely, the clonal plasma cell population responsible for producing the insoluble monoclonal light chain protein in AL amyloidosis typically constitutes less than 10% of the bone marrow.20 Multiple myeloma and AL amyloidosis may coexist in the same patient; nearly 15% of patients with multiple myeloma subsequently develop clinically overt AL amyloidosis, which portends a poor outcome.20
Amyloidosis is a rare group of diseases that arises when misfolded proteins aggregate in vital organs. The typical manifestations—congestive heart failure, neuropathy, chronic kidney disease, bleeding—are nearly always explained by more common conditions. Characteristic manifestations (like macroglossia) or associated diseases (like multiple myeloma) substantially increases the probability of AL amyloidosis. In a multisystem illness, the most common diseases must be excluded first, but this case reminds us that rare diseases, like amyloidosis, also warrant consideration as the story unfolds.
KEY TEACHING POINTS
- Different amyloid proteins precipitate in different anatomic sites, which leads to specific multiorgan combinations. The most common amyloidosis, ATTR, tends to manifest as heart failure and peripheral sensory neuropathy, while the constellation of AL amyloidosis includes heart failure, neuropathy, and proteinuria.
- Bleeding occurs in 30% of patients with AL amyloidosis. It is precipitated by fragile small blood vessels and exacerbated by acquired coagulopathy from adsorption of coagulation factors.
- Multiple myeloma and AL amyloidosis are both plasma cell dyscrasias involving the bone marrow, but they represent distinct disease processes with different clinical tempos and presentations. Multiple myeloma and AL amyloidosis may coexist in the same patient; nearly 15% of patients with multiple myeloma subsequently develop clinically overt AL amyloidosis.
Acknowledgment
The authors thank Benjamin A Derman, MD, of the University of Chicago, Chicago, Illinois, for critical review of the manuscript.
1. Witteles RM, Bokhari S, Damy T, et al. Screening for transthyretin amyloid cardiomyopathy in everyday practice. JACC Heart Fail. 2019;7(8):709-716. https://doi.org/10.1016/j.jchf.2019.04.010
2. Griffin SO, Jones JA, Brunson D, Griffin PM, Bailey WD. Burden of oral disease among older adults and implications for public health priorities. Am J Public Health. 2012;102(3):411-418. https://doi.org/10.2105/ajph.2011.300362
3. Ernster JA, Sciotto CG, O’Brien MM, et al. Rising incidence of oropharyngeal cancer and the role of oncogenic human papilloma virus. Laryngoscope. 2007;117(12):2115-2128. https://doi.org/10.1097/mlg.0b013e31813e5fbb
4. Wechalekar AD, Gillmore JD, Hawkins PN. Systemic amyloidosis. Lancet. 2016;387(10038):2641-2654. https://doi.org/10.1016/s0140-6736(15)01274-x
5. Riek R, Eisenberg DS. The activities of amyloids from a structural perspective. Nature. 2016;539(7628):227-235. https://doi.org/10.1038/nature20416
6. Gertz MA, Dispenzieri A. Systemic amyloidosis recognition, prognosis, and therapy: a systematic review. JAMA. 2020;324(1):79-89. https://doi.org/10.1001/jama.2020.5493
7. Ruberg FL, Berk JL. Transthyretin (TTR) cardiac amyloidosis. Circulation. 2012;126(10):1286-1300. https://doi.org/10.1161/circulationaha.111.078915
8. Quock TP, Yan T, Chang E, Guthrie S, Broder MS. Epidemiology of AL amyloidosis: a real-world study using US claims data. Blood Adv. 2018;2(10):1046-1053. https://doi.org/10.1182/bloodadvances.2018016402
9. Papoutsidakis N, Miller EJ, Rodonski A, Jacoby D. Time course of common clinical manifestations in patients with transthyretin cardiac amyloidosis: delay from symptom onset to diagnosis. J Card Fail. 2018;24(2):131-133. https://doi.org/10.1016/j.cardfail.2017.12.005
10. Shimazaki C, Hata H, Iida S, et al. Nationwide survey of 741 patients with systemic amyloid light-chain amyloidosis in Japan. Intern Med. 2018;57(2):181-187. https://doi.org/10.2169/internalmedicine.9206-17
11. Mumford AD, O’Donnell J, Gillmore JD, Manning RA, Hawkins PN, Laffan M. Bleeding symptoms and coagulation abnormalities in 337 patients with AL-amyloidosis. Br J Haematol. 2000;110(2):454-460. https://doi.org/10.1046/j.1365-2141.2000.02183.x
12. Choufani EB, Sanchorawala V, Ernst T, et al. Acquired factor X deficiency in patients with amyloid light-chain amyloidosis: incidence, bleeding manifestations, and response to high-dose chemotherapy. Blood. 2001;97(6):1885-1887. https://doi.org/10.1182/blood.v97.6.1885
13. Slagel GA, Lupton GP. Postproctoscopic periorbital purpura. Primary systemic amyloidosis. Arch Dermatol. 1986;122(4):464-465, 467-468.
14. Lupton GP. Pneomometry-induced purpura. Arch Dermatol. 1981;117(10):603. https://doi.org/10.1001/archderm.117.10.603a
15. Fernández de Larrea C, Verga L, Morbini P, et al. A practical approach to the diagnosis of systemic amyloidoses. Blood. 2015;125(14):2239-2244. https://doi.org/10.1182/blood-2014-11-609883
16. Vaxman I, Gertz M. Recent Advances in the diagnosis, risk stratification, and management of systemic light-chain amyloidosis. Acta Haematol. 2019;141(2):93-106. https://doi.org/10.1159/000495455
17. Muchtar E, Gertz MA, Kumar SK, et al. Improved outcomes for newly diagnosed AL amyloidosis between 2000 and 2014: cracking the glass ceiling of early death. Blood. 2017;129(15):2111-2119. https://doi.org/10.1182/blood-2016-11-751628
18. Quarta CC, Solomon SD. Stabilizing transthyretin to treat ATTR cardiomyopathy. N Engl J Med. 2018;379(11):1083-1084. https://doi.org/10.1056/nejme1810074
19. Maurer MS, Schwartz JH, Gundapaneni B, et al. Tafamidis treatment for patients with transthyretin amyloid cardiomyopathy. N Engl J Med. 2018;379(11):1007-1016. https://doi.org/10.1056/nejmoa1805689
20. Bahlis NJ, Lazarus HM. Multiple myeloma-associated AL amyloidosis: is a distinctive therapeutic approach warranted? Bone Marrow Transplant. 2006;38(1):7-15. https://doi.org/10.1038/sj.bmt.1705395
A 78-year-old woman presented to the ambulatory care clinic for a painful tongue mass. She noticed the mass 2 months prior to presentation, and it had not grown in the interim. She had left-sided jaw pain when opening her mouth and persistent left-sided otalgia.
In the evaluation of tongue masses, ulcerations, or other surface abnormalities, exclusion of squamous cell carcinoma is the top priority. Additional tongue surface abnormalities include benign lesions such as geographic tongue, inflammatory conditions such as lichen planus, and infections such as syphilis.
The ear and jaw pain may reflect metastatic spread, neural invasion, or referred pain from the tongue. A vasculitis with predilection for the head, such as giant cell arteritis, could present with oral and ear pain. Jaw pain with mastication could reflect jaw claudication, but pain upon mouth opening is more commonly explained by temporomandibular joint dysfunction.
The patient had hypertension, hyperlipidemia, chronic kidney disease (estimated glomerular filtration rate of 42 mL/min), and diabetes mellitus. Four months prior she was diagnosed with a chronic obstructing left renal calculus on ultrasonography to evaluate chronic kidney disease. Two months prior heart failure with preserved ejection fraction was diagnosed. Stress cardiac magnetic resonance imaging (MRI) demonstrated normal ejection fraction, asymmetric septal hypertrophy, and stress-induced subendocardial perfusion defect. Her medications were metoprolol, lisinopril, simvastatin, meloxicam, and aspirin. She never used tobacco and did not consume alcohol. She was born in the Philippines and emigrated to the United States 15 years ago. She had not experienced fever, chills, hearing loss, tinnitus, cough, dysphonia, neck swelling, or joint pain. She had lost 3 kg in the previous 4 months.
The absence of tobacco and alcohol use reduces the probability of a squamous cell carcinoma, although human papillomavirus–associated squamous cell carcinoma of the tongue remains possible. Asymmetric septal hypertrophy is characteristic of hypertrophic cardiomyopathy or an infiltrative cardiomyopathy. Sarcoidosis can affect the heart and can account for the renal calculus (via hypercalcemia). Amyloid light-chain (AL) amyloidosis could involve the heart and the tongue, although in amyloidosis the cardiac MRI typically displays late gadolinium enhancement and ventricular wall thickening. The absence of tinnitus or hearing loss suggests that the left-sided otalgia is referred pain from the tongue and oral cavity rather than a primary otologic disease (eg, infection).
On physical examination, temperature was 37.2 °C, heart rate was 88 beats per minute, blood pressure was 134/62 mm Hg, and oxygen saturation was 99% while breathing ambient air. The patient’s weight was 40.4 kg (body mass index of 19.26 kg/m2). Intraoral examination revealed induration of the bilateral tongue, an erosive 1-cm pedunculated mass of the left dorsum, rough white coating on the right dorsum, and fullness of the right lateral surface with an erosion abutting tooth #2. The right submandibular salivary gland was firm. The otoscopic examination and remainder of the head and neck examination were normal. There was no cervical, supraclavicular, or axillary adenopathy. The cranial nerve, cardiovascular, pulmonary, abdominal, and skin examinations were normal.
The left-sided lingual mass and right-sided lingual erosion likely arise from the same process. Both are compatible with an infection (eg, syphilis or tuberculosis), cancer, autoimmune disease (eg, Crohn’s disease or sarcoidosis), or an infiltrative disease such as amyloidosis. Leukoplakia could reflect a candidal infection, dysplasia, squamous cell carcinoma, oral hairy leukoplakia, or hyperkeratosis. The isolated submandibular salivary gland could reflect sialadenitis from chronic salivary duct obstruction or a primary neoplasm, but more likely is caused by the same process causing the tongue abnormalities.
The white blood cell count was 8,600/μL; hemoglobin, 11.5 g/dL; mean corpuscular volume, 102.5 fL; and platelet count, 270,000/μL3. Serum sodium was 141 mEq/L; potassium, 4.1 mEq/L; chloride, 101 mEq/L; bicarbonate, 30 mEq/L; blood urea nitrogen, 19 mg/dL; creatinine, 0.7 mg/dL; and calcium, 10.4 mg/dL (reference range, 8.5-10.3). Total serum protein was 7.3 g/dL (reference range, 6.0-8.3); albumin was 3.7 g/dL. Liver biochemistry test results were normal. Serum folate and vitamin B12 levels were normal. Serum ferritin was 423 ng/mL (reference range, 11-306); transferrin saturation, 21.4% (reference range, 15.0%-50.0%); and total iron-binding capacity, 323 µg/dL (reference range, 261-478). Parathyroid hormone (PTH) was 14 pg/mL (reference range, 15-65). HIV antibody was negative.
The calcium level is at the upper range of normal, whereas the PTH level is at the lower range of normal. The differential diagnosis for PTH-independent hypercalcemia includes hypercalcemia of malignancy and granulomatous disease such as sarcoidosis. Mild hypercalcemia could contribute to the nephrolithiasis. The iron studies exclude iron deficiency and are not suggestive of anemia of chronic disease. The triad of mild hypercalcemia, cardiomyopathy, and anemia is compatible with AL amyloidosis (perhaps with associated multiple myeloma) or sarcoidosis; both disorders can present as a mass. Imaging of the head and neck and biopsy of the tongue mass are the next steps.
The left dorsal tongue mass was excised in clinic. Histopathology revealed ulcerated squamous mucosa with inflammatory changes but no malignancy. Imaging of the head and neck was scheduled.
Neither cancer or granulomas were detected, but inadequate sampling or staining must be considered. Inflammatory changes are compatible with infection, autoimmunity, and cancer; the latter can feature reactive changes that obscure the malignant cells. The absence of granulomas lowers, but does not eliminate, the possibility of sarcoidosis, tuberculosis, fungal infection, and granulomatosis with polyangiitis. Actinomycosis is an invasive orofacial infection that disregards anatomic boundaries and is characterized by inflammatory histology; although infection of the tongue is possible, infection of the jaw and face is more typical. Immunoglobulin G4–related disease can present as an inflammatory and invasive disorder; however, the characteristic histopathologic findings (lymphoplasmacytic infiltrate, fibrosis, and phlebitis) are absent.
Culture of the tissue for mycobacteria or fungi (she is at increased risk for both given her previous residency in the Philippines) could increase the diagnostic yield. Another biopsy of the tongue or an adjacent structure—guided by imaging—may provide a more diagnostic tissue sample.
MRI of the head and neck demonstrated hyperintense signal and prominence of the right lateral pterygoid muscle (Figure 1A) and slight enlargement of a right submandibular gland (Figure 1B). No tongue abnormalities were identified. Radiograph of the chest did not reveal infiltrates, masses, or lymphadenopathy.
The absence of the tongue mass on the MRI likely reflects excision of the mass at the time of biopsy. The signal enhancement in the right lateral pterygoid muscle and submandibular gland is suggestive of an infiltrative process. Infiltration of the right lateral pterygoid muscle may also explain the patient’s pain when opening her mouth. Infiltrative processes can be neoplastic (eg, salivary gland tumor, sarcoma, lymphoma), infectious (eg, mycobacterial or fungal), cellular (eg, histiocytes, mast cells, plasma cells, eosinophils, granulomas), or related to inert substances such as amyloid or iron.
Seven weeks later, the patient presented to the hospital for scheduled percutaneous nephrolithotomy of the obstructing renal calculus. The physical examination was unchanged. The complete blood count and metabolic panel were unchanged apart from hemoglobin of 9.9 g/dL and calcium of 11.5 mg/dL. Coagulation studies were within normal limits.
A percutaneous nephroureteral stent was placed under conscious sedation. The patient then underwent rapid sequence induction of general anesthesia for the nephrolithotomy with fentanyl, propofol, and rocuronium. Within minutes of initiating mechanical ventilation, severe periorbital and perioral edema, copious oral cavity bleeding, and bilateral periorbital purpura occurred. Sugammadex (neuromuscular blockade reversal) and dexamethasone were administered. Examination of the oral cavity was limited by the brisk bleeding; the right sided tongue erosion was unchanged.
Bleeding is caused by thrombocytopenia, thrombocytopathy, coagulopathy, or disruption of vessel integrity. Oral cavity bleeding could arise from the tongue ulceration, but could also reflect pulmonary, nasal, or gastrointestinal hemorrhage. Angioedema arises from mast cell– or bradykinin-mediated pathways; mast cell degranulation may have been precipitated by the anesthetic agents, opiate, or a material in the nephroureteral stent.
The edema and bleeding are temporally related to multiple medications and mechanical ventilation. A latent bleeding diathesis may have manifested in the setting of increased tissue hydrostatic pressure or vessel permeability. Amyloidosis can lead to vessel fragility and coagulopathy, and periorbital bleeding is characteristic of AL amyloidosis.
The hypercalcemia, now more pronounced, raises concern for malignancy (including multiple myeloma) and granulomatous diseases like sarcoidosis, mycobacterial infections, and fungal infections. The declining hemoglobin could be explained by chronic blood loss, hemolysis, anemia of chronic disease, or a bone marrow process.
The cardiomyopathy, bleeding disorder, and multifocal disease in the oral cavity can be explained by AL amyloidosis; the hypercalcemia suggests concomitant multiple myeloma.
At the time of the bleeding event, the partial thromboplastin time, prothrombin time, and fibrinogen were within the reference ranges. Factor X activity level was normal. No schistocytes were observed on peripheral blood smear. Immunoglobulin G level was 1,425 mg/dL (reference range, 639-1,349); IgA and IgM levels were within the reference range. Serum lambda free light chains were 151.78 mg/dL (reference range, 0.46-2.71), and the ratio of kappa to lambda light chains was 0.01 (reference range, 0.49-2.54). Serum protein electrophoresis and immunofixation demonstrated a monoclonal paraprotein (IgG lambda) level of 1.2 g/dL. Congo red staining of the previously excised left dorsal tongue mass was negative for apple-green birefringence. Reexamination of the oral cavity revealed macroglossia and scalloping of the tongue (Figure 2).
Scalloping is characteristic of an infiltrative disorder that enlarges the tongue (macroglossia) and deforms its edges, which encounter the teeth. Macroglossia is seen in AL amyloidosis, acromegaly, and hypothyroidism. A monoclonal light chain, especially a lambda light chain, is characteristic of AL amyloidosis. The Congo red stain results can support the diagnosis when positive, but it has limited sensitivity. The tongue specimen can be sent for immunohistochemistry or mass spectrometry to evaluate for light chain deposition. A bone marrow biopsy can demonstrate a clonal plasma cell population. AL amyloidosis with concomitant multiple myeloma is the most likely diagnosis.
Bone marrow aspiration and core biopsy demonstrated 30% lambda-restricted plasma cells (Figure 3A-C). Congo red staining demonstrated apple-green birefringence of the bone marrow microvasculature (Figure 3D). Skeletal survey demonstrated widespread lytic bone disease involving the calvarium (Figure 4A), left humerus (Figure 4B), and left scapula (Figure 4B). Based on the monoclonal paraprotein, more than 10% monoclonal plasma cells, skeletal lesions, and hypercalcemia, she was diagnosed with IgG lambda multiple myeloma. Based on apple-green birefringence in the bone marrow and macroglossia, she was diagnosed with AL amyloidosis. The cardiac MRI findings were compatible with AL amyloidosis. 1
After three cycles of bortezomib and dexamethasone therapy to concurrently treat AL amyloidosis and multiple myeloma, the serum lambda light chain level decreased to 1.49 mg/dL and the monoclonal paraprotein level decreased to 0.3 g/dL. The calcium level was 9.8 mg/dL, and the hemoglobin level was 11.7 g/dL. The patient’s tongue pain resolved, allowing for improved oral intake and a 5.7-kg weight gain. The patient underwent nephrolithotomy 4 months after her initial presentation. She resumed an active lifestyle and recently traveled to visit relatives in the Philippines.
DISCUSSION
Oral diseases affect general health and quality of life and can be a harbinger of systemic disease. Tooth loss, caries, periodontal disease, and poorly fitting dentures commonly affect speech and nutrition.2 These common outpatient oral health issues can be the driving force for hospital admissions; for example, caries and periodontal disease can lead to suppurative odontogenic infection, endocarditis, brain abscess, and sepsis.
Tongue ulcerations, masses, and surface abnormalities often require consultation with a dentist or oral and maxillofacial surgeon to exclude squamous cell carcinoma.3 Other diagnostic considerations include benign neoplasms, trauma, inflammatory conditions (eg, sarcoidosis), infection (eg, syphilis, tuberculosis), and infiltrative processes such as amyloidosis.
Amyloidosis is a heterogeneous group of diseases caused by deposition of insoluble protein fibrils in tissues.4,5 The three most encountered forms of amyloidosis are AL, AA, and ATTR. Each form is named after the culprit protein.4 AL amyloidosis arises when a small clonal population of plasma cells in the bone marrow overproduces immunoglobulin light chain monomers.4,6 AA amyloidosis develops when the liver produces serum amyloid A protein (an acute phase reactant) in response to a chronic inflammatory condition such as rheumatoid arthritis or chronic intravenous drug injection.4 Transthyretin (TTR, also known as “prealbumin”) is a tetrameric protein that transports thyroxine and retinol; there are two forms of ATTR amyloidosis: hereditary and wild type. Hereditary ATTR amyloidosis develops from agglomeration of misfolded TTR monomers caused by mutations in the TTR gene. Wild-type ATTR amyloidosis is caused by age-related dissociation of the TTR tetramer into its constituent monomers that denature, misfold, and agglomerate into fibrils.5 Wild-type ATTR is now recognized as the most common form of amyloidosis, with 25% of myocardial autopsy specimens of patients 80 years or older demonstrating amyloid.7 The estimated incidence of AL amyloidosis is 10 cases per million person-years.8
Each amyloid protein homes in on specific anatomic sites.4 Characteristic combinations of organ dysfunction can suggest different forms of amyloidosis.9 Cardiac and peripheral nervous involvement (eg, carpal tunnel syndrome) is typical of both hereditary and wild-type ATTR amyloidosis; ATTR amyloidosis does not involve the kidney.4 AA amyloidosis most commonly manifests with proteinuria followed by declining glomerular filtration rate; heart failure is rare.4 The most common findings in AL amyloidosis are proteinuria, congestive heart failure, and sensory neuropathy.6 Gastrointestinal tract and hepatic involvement are each seen in nearly 20% of patients, and macroglossia is identified in approximately 10% of those with AL amyloidosis.6,10
Chronic deposition of amyloid can lead to acute presentations. Approximately 30% of patients with AL amyloidosis develop abnormal bleeding.11 Amyloid deposition in small blood vessels predisposes them to rupture. Bleeding events can be exacerbated by acquired coagulopathy due to plasma cell dyscrasia−associated thrombocytopenia, amyloid fibril adsorption of factor X, or hypofibrinogenemia.11,12 Periorbital purpura following minor trauma or transient venous hypertension is characteristic of AL amyloidosis.6,13 In this case, positive pressure ventilation and recumbent positioning increased hydrostatic pressure in the head and neck, causing rupture of the infiltrated small vessels around the eyes and in the oral cavity.14
Histological demonstration of tissue deposition of amyloid protein is the preferred method for amyloidosis diagnosis. Symptomatic sites or organs with dysfunction or radiologic changes are suitable for biopsy.6 If those sites are inaccessible or yield insufficient tissue quantity, abdominal fat pad aspiration or biopsy is indicated.15 Apple-green birefringence under polarized light of Congo red–stained tissue is characteristic, with sensitivity and specificity of approximately 80% and a positive predictive value of 85%.15 Immunoelectron microscopy is often performed simultaneously to confirm the diagnosis and determine the amyloid protein type.4,16 Immunoelectron microscopy’s sensitivity is approximately 80%, and it has specificity and positive predictive value both approaching 100%.15 Mass spectrometry is particularly useful in cases where the amyloid subtype is not clinically apparent (eg, a patient with an autoimmune condition or chronic infection as well as light chain abnormality).6 Cardiac MRI findings that suggest amyloidosis include a thickened left ventricle and late gadolinium enhancement.1 ATTR cardiac amyloidosis can be diagnosed using amyloid fibril–binding radiotracer technetium-99m-pyrophosphate scintigraphy; biopsy is often not necessary.1,4 Gene sequencing to differentiate between hereditary and wild-type forms of ATTR amyloidosis is beneficial.
The primary objectives of amyloidosis management are to control symptoms and inhibit amyloid protein production.6 Outcomes in AL amyloidosis have improved due to early diagnosis, new chemotherapeutic agents to eradicate the plasma cell clone, and autologous stem cell transplantation.6,17 Two new ATTR amyloidosis treatments are RNA interference therapies, which prevent TTR messenger RNA translation, and tafamidis, which stabilizes the TTR tetramer and prevents dissociation into its constituent monomers that precipitate in tissues.18 Both therapies can improve neuropathy-related quality of life.18 Tafamidis slows disease progression and decreases all-cause mortality in patients with hereditary and wild-type ATTR cardiac amyloidosis.19
Multiple myeloma and AL amyloidosis are both plasma cell dyscrasias involving the bone marrow, but they represent distinct disease processes with different clinical features.6 Multiple myeloma is characterized by marked expansion of a clonal plasma cell population within the bone marrow that aberrantly produces immunoglobulin. Conversely, the clonal plasma cell population responsible for producing the insoluble monoclonal light chain protein in AL amyloidosis typically constitutes less than 10% of the bone marrow.20 Multiple myeloma and AL amyloidosis may coexist in the same patient; nearly 15% of patients with multiple myeloma subsequently develop clinically overt AL amyloidosis, which portends a poor outcome.20
Amyloidosis is a rare group of diseases that arises when misfolded proteins aggregate in vital organs. The typical manifestations—congestive heart failure, neuropathy, chronic kidney disease, bleeding—are nearly always explained by more common conditions. Characteristic manifestations (like macroglossia) or associated diseases (like multiple myeloma) substantially increases the probability of AL amyloidosis. In a multisystem illness, the most common diseases must be excluded first, but this case reminds us that rare diseases, like amyloidosis, also warrant consideration as the story unfolds.
KEY TEACHING POINTS
- Different amyloid proteins precipitate in different anatomic sites, which leads to specific multiorgan combinations. The most common amyloidosis, ATTR, tends to manifest as heart failure and peripheral sensory neuropathy, while the constellation of AL amyloidosis includes heart failure, neuropathy, and proteinuria.
- Bleeding occurs in 30% of patients with AL amyloidosis. It is precipitated by fragile small blood vessels and exacerbated by acquired coagulopathy from adsorption of coagulation factors.
- Multiple myeloma and AL amyloidosis are both plasma cell dyscrasias involving the bone marrow, but they represent distinct disease processes with different clinical tempos and presentations. Multiple myeloma and AL amyloidosis may coexist in the same patient; nearly 15% of patients with multiple myeloma subsequently develop clinically overt AL amyloidosis.
Acknowledgment
The authors thank Benjamin A Derman, MD, of the University of Chicago, Chicago, Illinois, for critical review of the manuscript.
1. Witteles RM, Bokhari S, Damy T, et al. Screening for transthyretin amyloid cardiomyopathy in everyday practice. JACC Heart Fail. 2019;7(8):709-716. https://doi.org/10.1016/j.jchf.2019.04.010
2. Griffin SO, Jones JA, Brunson D, Griffin PM, Bailey WD. Burden of oral disease among older adults and implications for public health priorities. Am J Public Health. 2012;102(3):411-418. https://doi.org/10.2105/ajph.2011.300362
3. Ernster JA, Sciotto CG, O’Brien MM, et al. Rising incidence of oropharyngeal cancer and the role of oncogenic human papilloma virus. Laryngoscope. 2007;117(12):2115-2128. https://doi.org/10.1097/mlg.0b013e31813e5fbb
4. Wechalekar AD, Gillmore JD, Hawkins PN. Systemic amyloidosis. Lancet. 2016;387(10038):2641-2654. https://doi.org/10.1016/s0140-6736(15)01274-x
5. Riek R, Eisenberg DS. The activities of amyloids from a structural perspective. Nature. 2016;539(7628):227-235. https://doi.org/10.1038/nature20416
6. Gertz MA, Dispenzieri A. Systemic amyloidosis recognition, prognosis, and therapy: a systematic review. JAMA. 2020;324(1):79-89. https://doi.org/10.1001/jama.2020.5493
7. Ruberg FL, Berk JL. Transthyretin (TTR) cardiac amyloidosis. Circulation. 2012;126(10):1286-1300. https://doi.org/10.1161/circulationaha.111.078915
8. Quock TP, Yan T, Chang E, Guthrie S, Broder MS. Epidemiology of AL amyloidosis: a real-world study using US claims data. Blood Adv. 2018;2(10):1046-1053. https://doi.org/10.1182/bloodadvances.2018016402
9. Papoutsidakis N, Miller EJ, Rodonski A, Jacoby D. Time course of common clinical manifestations in patients with transthyretin cardiac amyloidosis: delay from symptom onset to diagnosis. J Card Fail. 2018;24(2):131-133. https://doi.org/10.1016/j.cardfail.2017.12.005
10. Shimazaki C, Hata H, Iida S, et al. Nationwide survey of 741 patients with systemic amyloid light-chain amyloidosis in Japan. Intern Med. 2018;57(2):181-187. https://doi.org/10.2169/internalmedicine.9206-17
11. Mumford AD, O’Donnell J, Gillmore JD, Manning RA, Hawkins PN, Laffan M. Bleeding symptoms and coagulation abnormalities in 337 patients with AL-amyloidosis. Br J Haematol. 2000;110(2):454-460. https://doi.org/10.1046/j.1365-2141.2000.02183.x
12. Choufani EB, Sanchorawala V, Ernst T, et al. Acquired factor X deficiency in patients with amyloid light-chain amyloidosis: incidence, bleeding manifestations, and response to high-dose chemotherapy. Blood. 2001;97(6):1885-1887. https://doi.org/10.1182/blood.v97.6.1885
13. Slagel GA, Lupton GP. Postproctoscopic periorbital purpura. Primary systemic amyloidosis. Arch Dermatol. 1986;122(4):464-465, 467-468.
14. Lupton GP. Pneomometry-induced purpura. Arch Dermatol. 1981;117(10):603. https://doi.org/10.1001/archderm.117.10.603a
15. Fernández de Larrea C, Verga L, Morbini P, et al. A practical approach to the diagnosis of systemic amyloidoses. Blood. 2015;125(14):2239-2244. https://doi.org/10.1182/blood-2014-11-609883
16. Vaxman I, Gertz M. Recent Advances in the diagnosis, risk stratification, and management of systemic light-chain amyloidosis. Acta Haematol. 2019;141(2):93-106. https://doi.org/10.1159/000495455
17. Muchtar E, Gertz MA, Kumar SK, et al. Improved outcomes for newly diagnosed AL amyloidosis between 2000 and 2014: cracking the glass ceiling of early death. Blood. 2017;129(15):2111-2119. https://doi.org/10.1182/blood-2016-11-751628
18. Quarta CC, Solomon SD. Stabilizing transthyretin to treat ATTR cardiomyopathy. N Engl J Med. 2018;379(11):1083-1084. https://doi.org/10.1056/nejme1810074
19. Maurer MS, Schwartz JH, Gundapaneni B, et al. Tafamidis treatment for patients with transthyretin amyloid cardiomyopathy. N Engl J Med. 2018;379(11):1007-1016. https://doi.org/10.1056/nejmoa1805689
20. Bahlis NJ, Lazarus HM. Multiple myeloma-associated AL amyloidosis: is a distinctive therapeutic approach warranted? Bone Marrow Transplant. 2006;38(1):7-15. https://doi.org/10.1038/sj.bmt.1705395
© 2021 Society of Hospital Medicine