User login
Comprehensive Genomic Profiles of Melanoma in Veterans Compared to Reference Databases
Comprehensive Genomic Profiles of Melanoma in Veterans Compared to Reference Databases
The veteran population, with its unique and diverse types of exposure and military service experiences, faces distinct health factors compared with the general population. These factors can be categorized into exposures during military service and those occurring postservice. While the latter phase incorporates psychological issues that may arise while transitioning to civilian life, the service period is associated with major physical, chemical, and psychological exposures that can impact veterans’ health. Carcinogenesis related to military exposures is concerning, and different types of malignancies have been associated with military exposures.1 The 2022 introduction of the Cancer Moonshot initiative served as a breeding ground for multiple projects aimed at investigation of exposure-related carcinogenesis, prompting increased attention and efforts to linking specific exposures to specific malignancies.2
Melanoma is the deadliest skin cancer, accounting for 1.3% of all cancer deaths.3 Although it may only account for 1% to 5% of skin cancer diagnoses, its incidence in the United States’ population has been increasing.4,5 There were 97,610 estimated new cases of melanoma in 2023, according to the National Cancer Institute.6
The incidence of melanoma may be higher in the military population compared with the general population.7 Melanoma is the fourth-most common cancer diagnosed in veterans.8
Several demographic characteristics of the US military population are associated with higher melanoma incidence and poorer prognosis, including male sex, older age, and White race. Apart from sun exposure—a known risk factor for melanoma development—other factors, such as service branch, seem to contribute to risk, with the highest melanoma rates noted in the Air Force.9 According to a study by Chang et al, veterans have a higher risk of stage III (18%) or stage IV (13%) melanoma at initial diagnosis.8
Molecular testing of metastatic melanoma is currently the standard of care for guiding the use of US Food and Drug Administration-approved targeted therapies such as BRAF, MEK, and KIT inhibitors. This comparative analysis details the melanoma comprehensive genomic profiles observed at a large US Department of Veterans Affairs (VA) medical center (VAMC) and those reported in reference databases.
Methods
A query to select all metastatic melanomas sent for comprehensive genomic profiling from the Kansas City VAMC (KCVAMC), identified 35 cases from 2019 through 2023 as the study population. The health records of these patients were reviewed to collect demographic information, military service history, melanoma history, other medical, social, and family histories. The comprehensive genomic profiling reports were reviewed to collect the reported pathogenic variants, microsatellite instability (MSI) status, and tumor mutational burden (TMB) for each case.
The Catalogue of Somatic Mutations in Cancer (COSMIC) was used to identify the most commonly mutated genes in melanomas from The Cancer Genome Atlas for the general population.4,5 The literature was consulted to determine the MSI status and TMB in melanomas from The Cancer Genome Atlas for separate reference populations.6,7 The frequency of MSI-high (MSI-H) status, TMB ≥ 10 mutations/megabase (mut/Mb), and mutations in each of the 20 most commonly mutated genes was determined and compared between melanomas from The Cancer Genome Atlas and KCVAMC cases. Corresponding P values were calculated to identify significant differences. Values were calculated for the entire sample as well as a subgroup with Agent Orange (AO) exposure. The study was approved by the KCVAMC Institutional Review Board.
Results
The mean (SD) age of study participants was 72.9 (9.4) years (range, 39-90 years). The mean (SD) duration of military service was 1654 (1421) days (about 4 years, 6 months, and 10 days). Of the 35 patients included, 22 (63%) served during the Vietnam era (November 1, 1965, to April 30, 1975) and 2 (6%) served during the Persian Gulf War era (August 2, 1990, to February 28, 1991). Seventeen veterans (49%) served in the Army, 9 in the Navy (26%), 5 in the Air Force (14%), and 4 in the Marine Corps (11%). Definitive AO exposure was noted in 13 patients (37%) (Table 1).
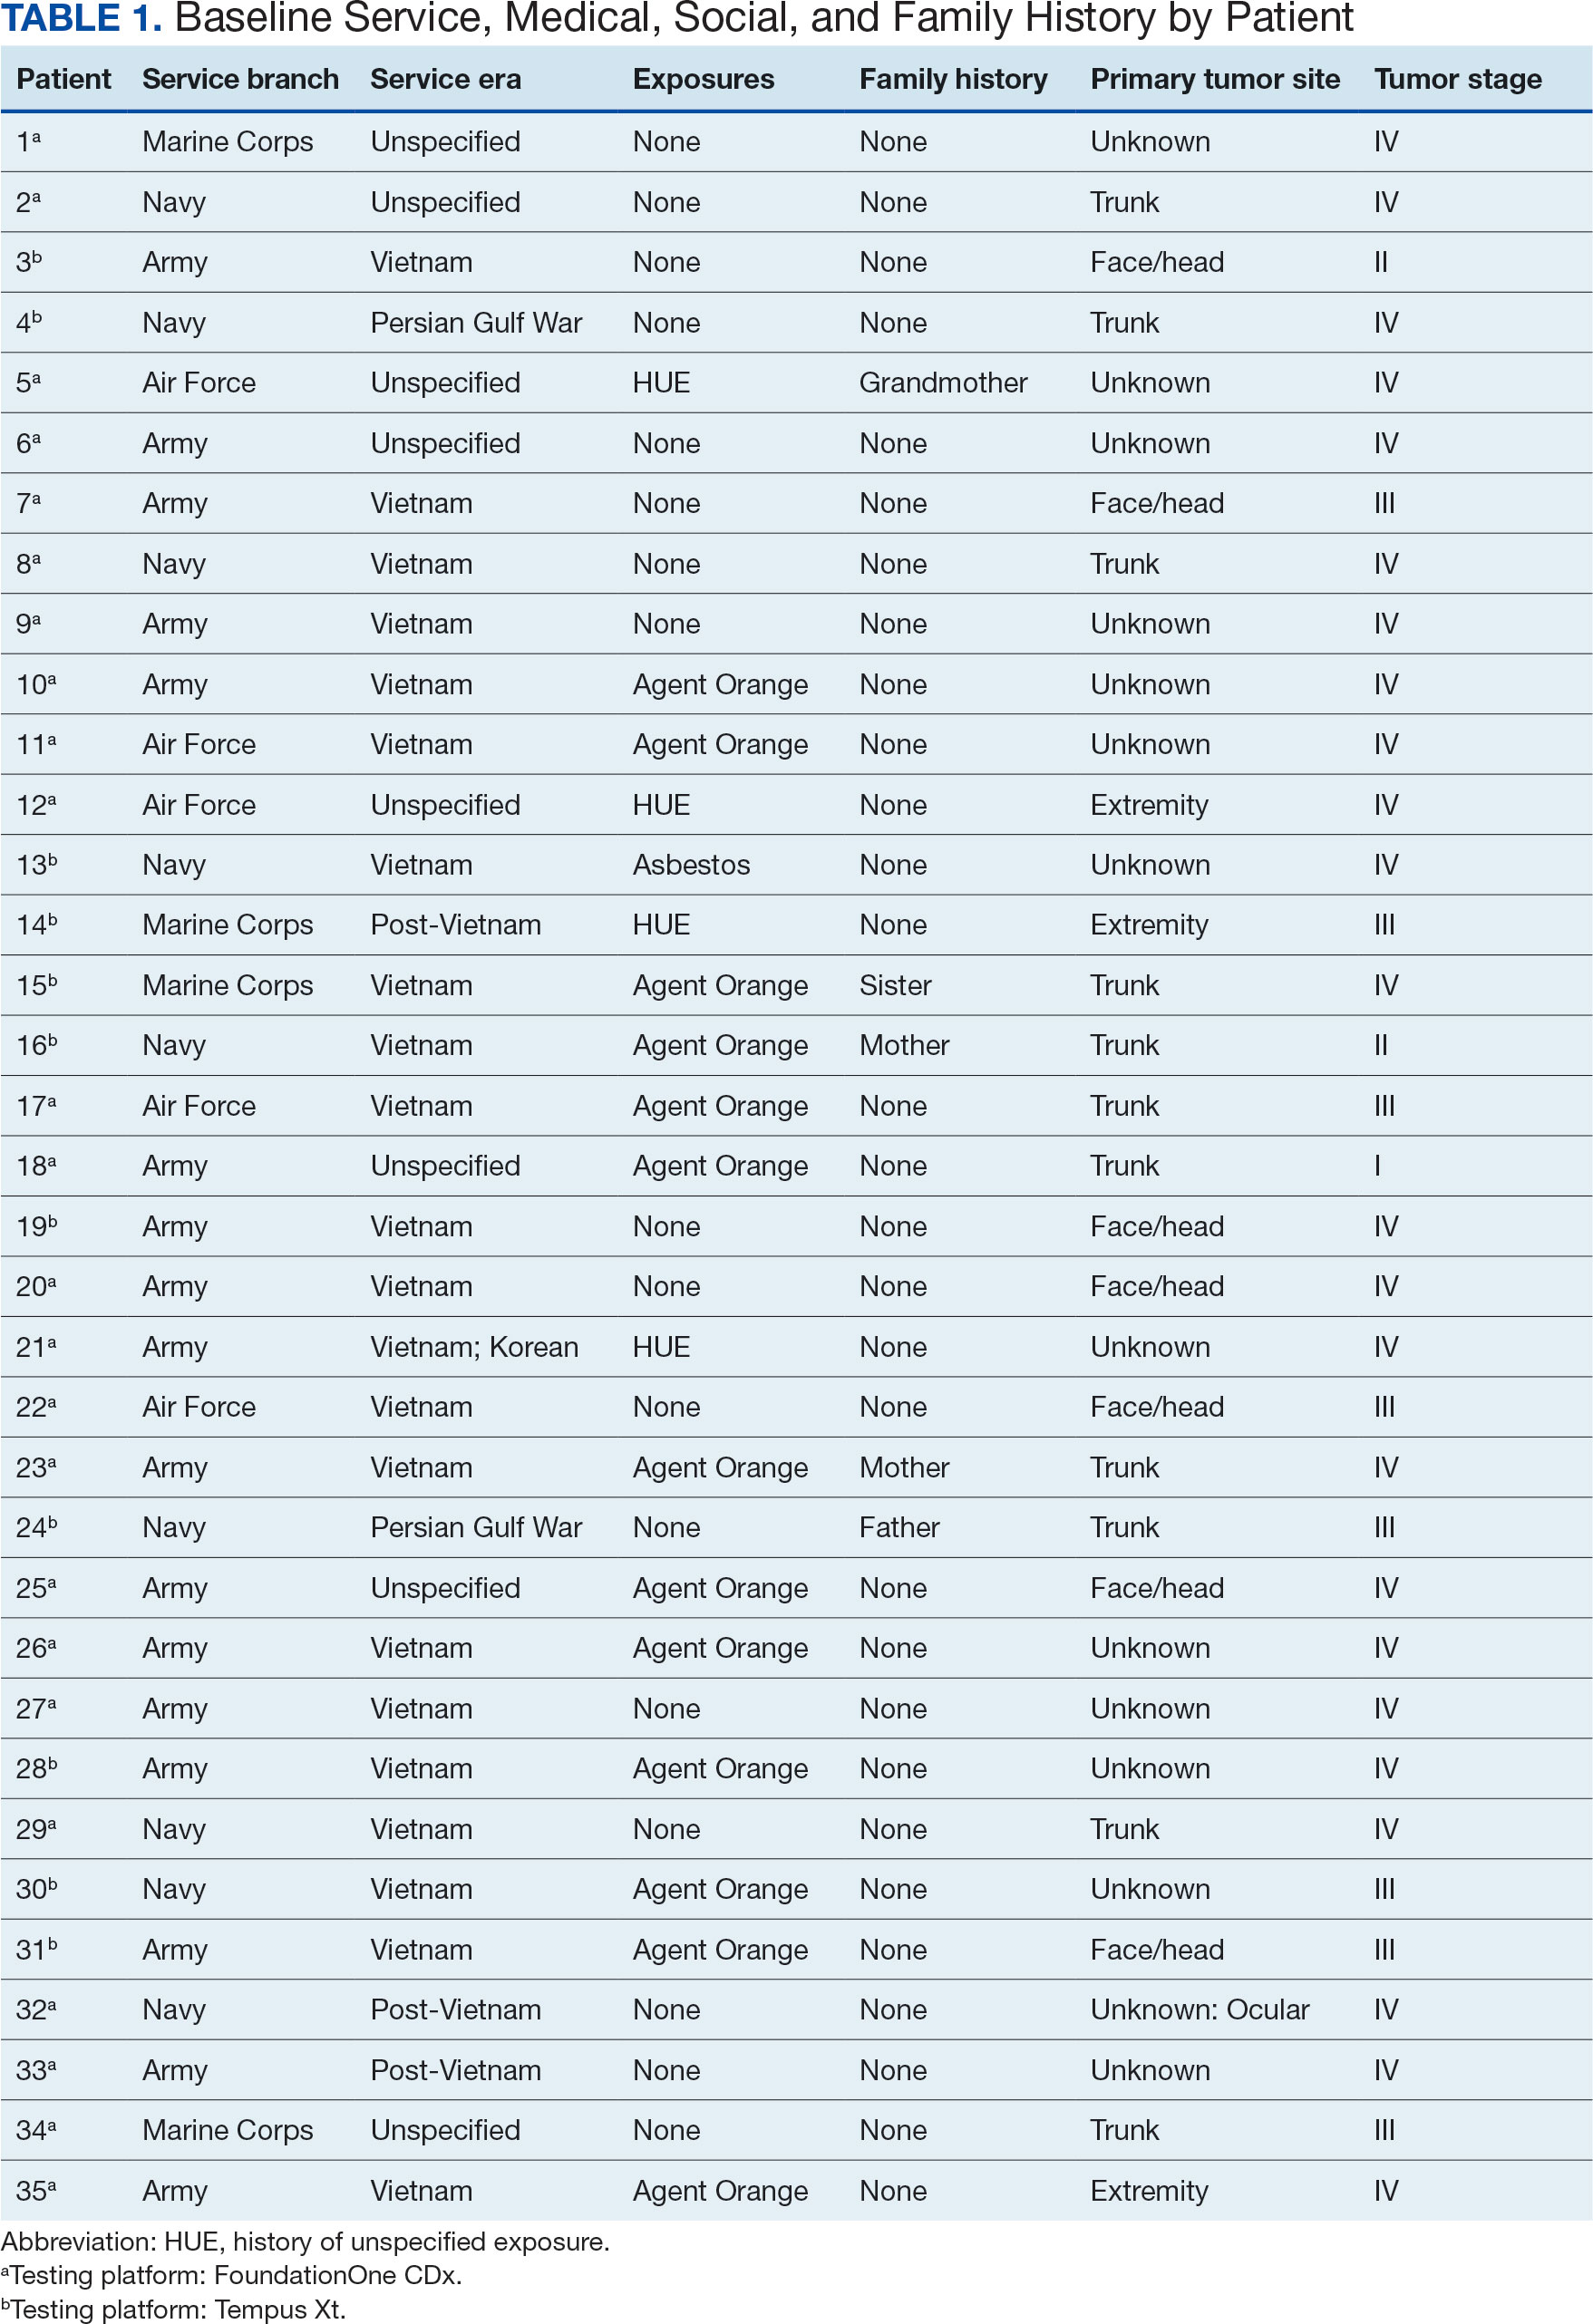
Of the 35 patients, 24 (69%) had metastatic disease and the primary site of melanoma was unknown in 14 patients (40%). One patient (Patient 32) had an intraocular melanoma. The primary site was the trunk for 11 patients (31%), the face/head for 7 patients (20%) and extremities for 3 patients (9%). Eight patients (23%) were pT3 stage (thickness > 2 mm but < 4 mm), 7 patients (20%) were pT4 stage (thickness > 4 mm), and 5 patients (14%) were pT1 (thickness ≥ 1 mm). One patient had a primary lesion at pT2 stage, and 1 had a Tis stage lesion. Three patients (9%) had a family history of melanoma in a first-degree relative.
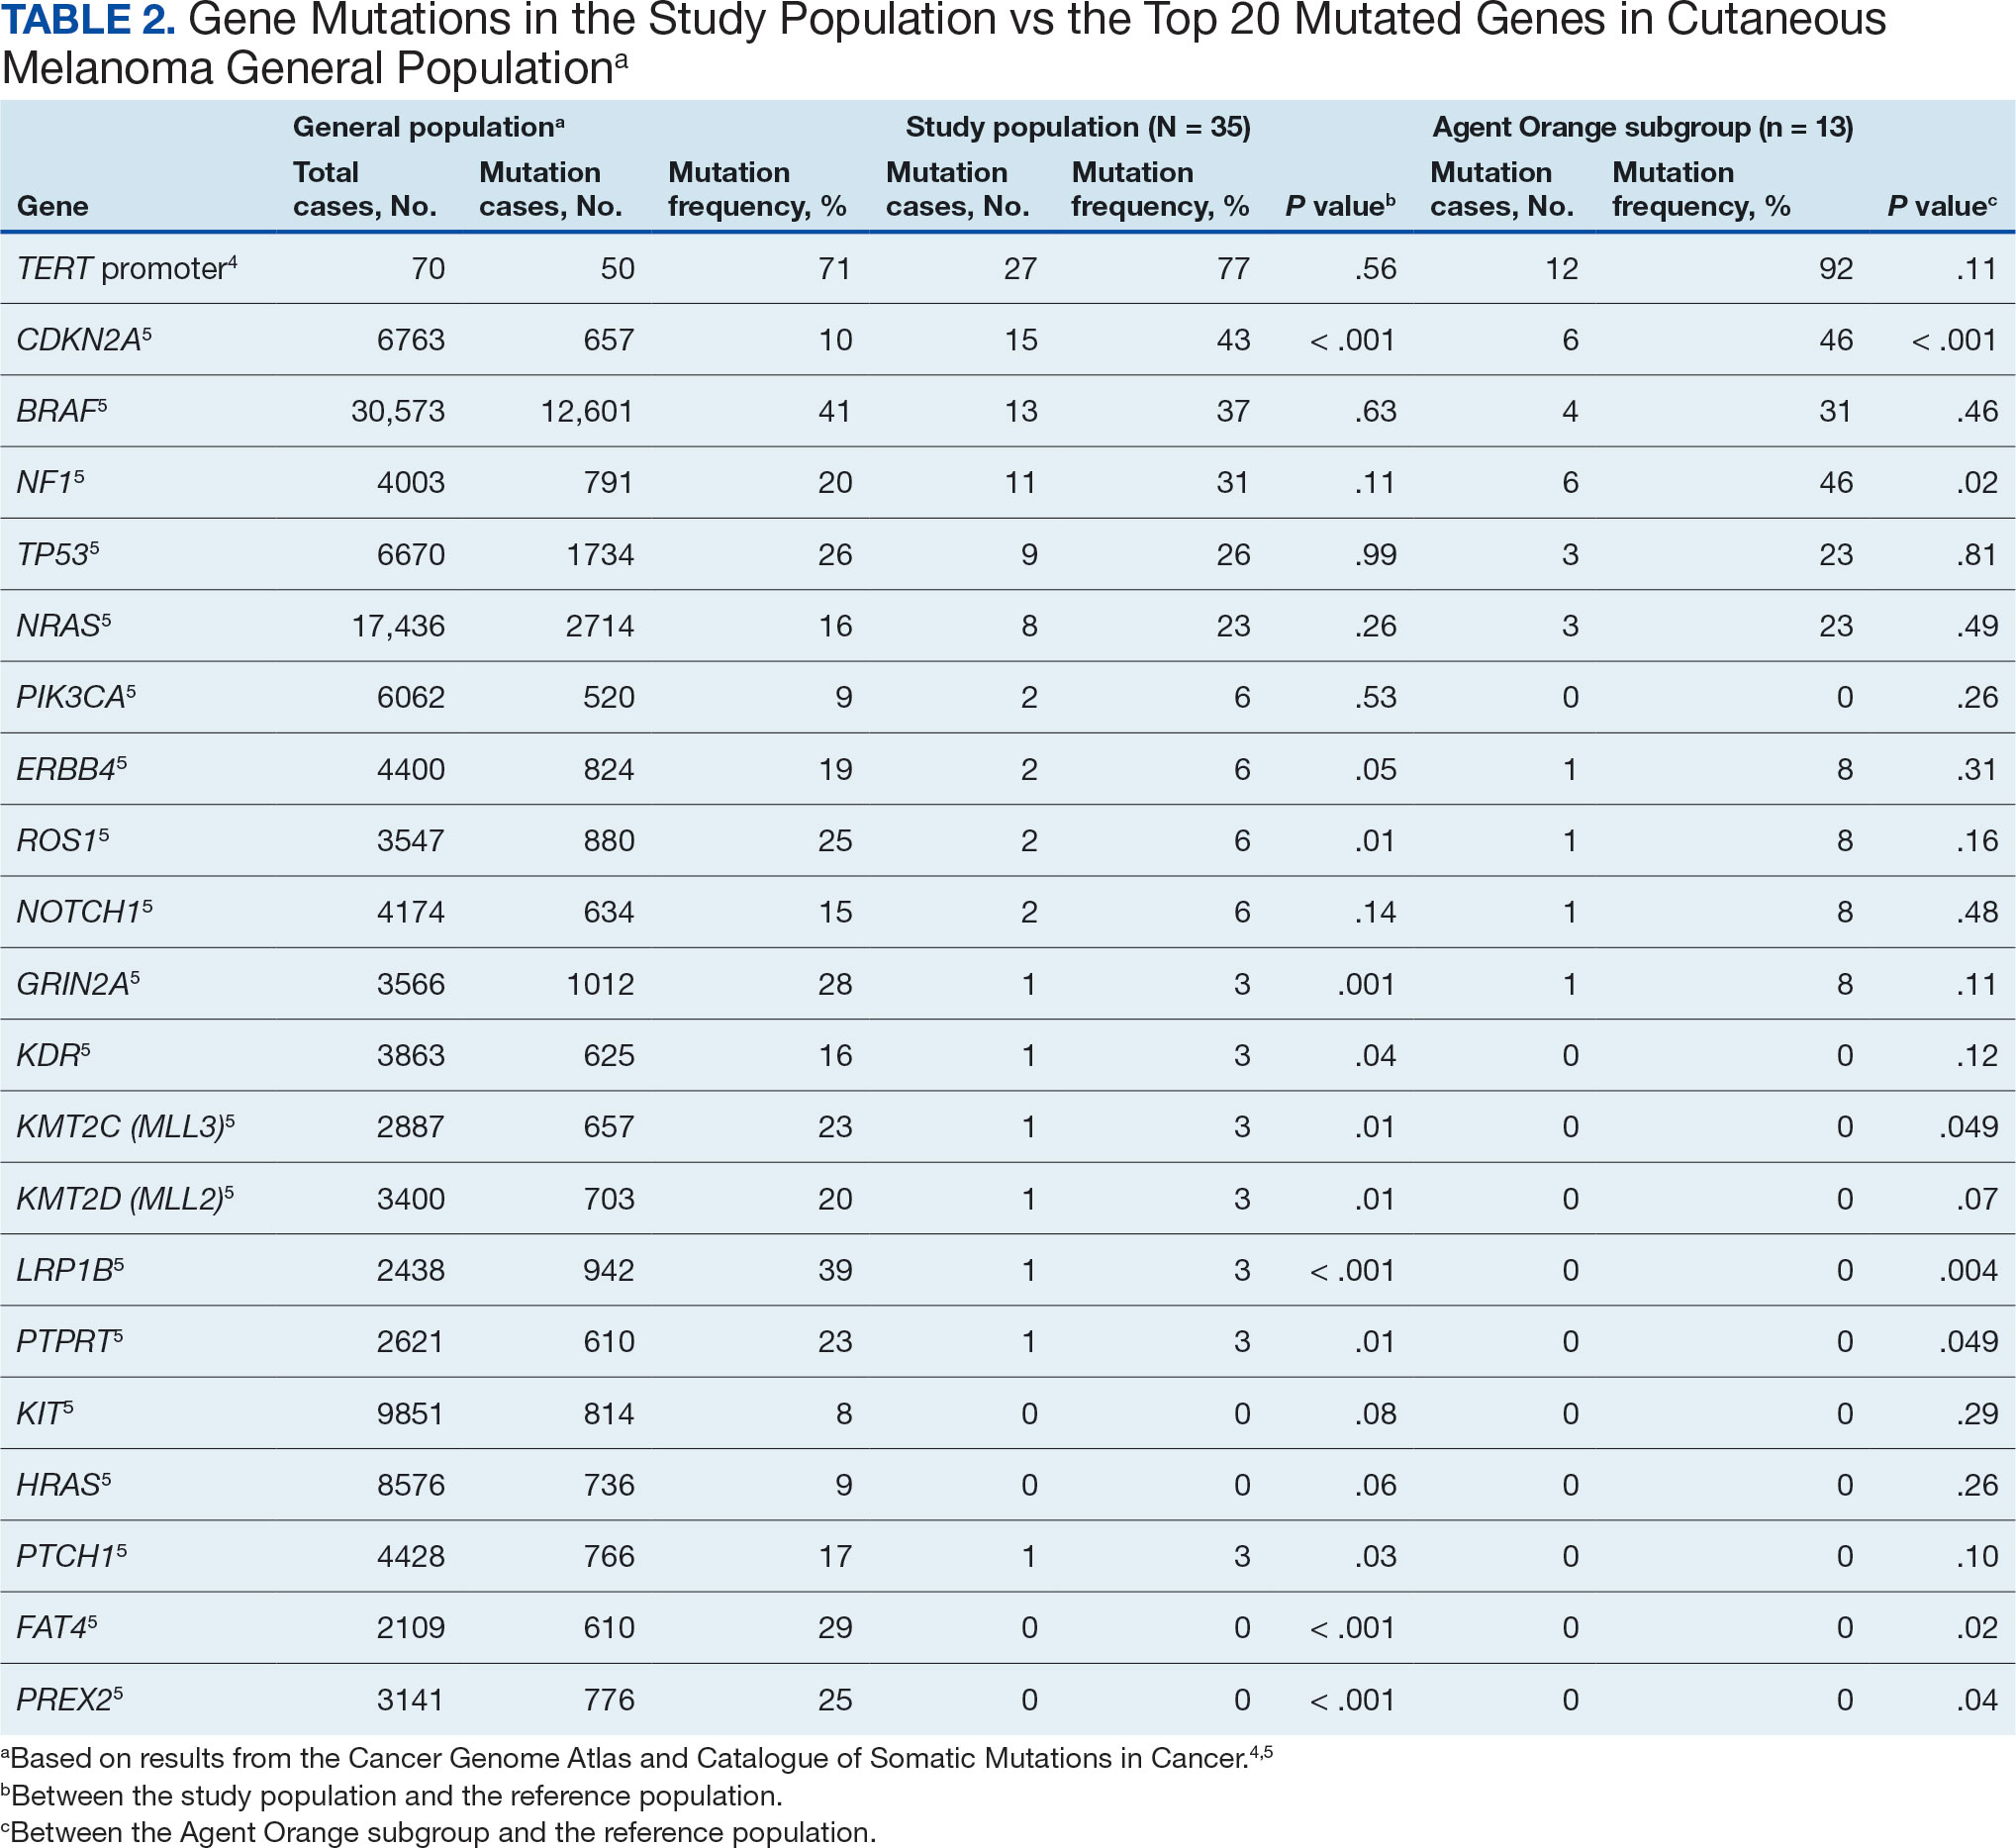
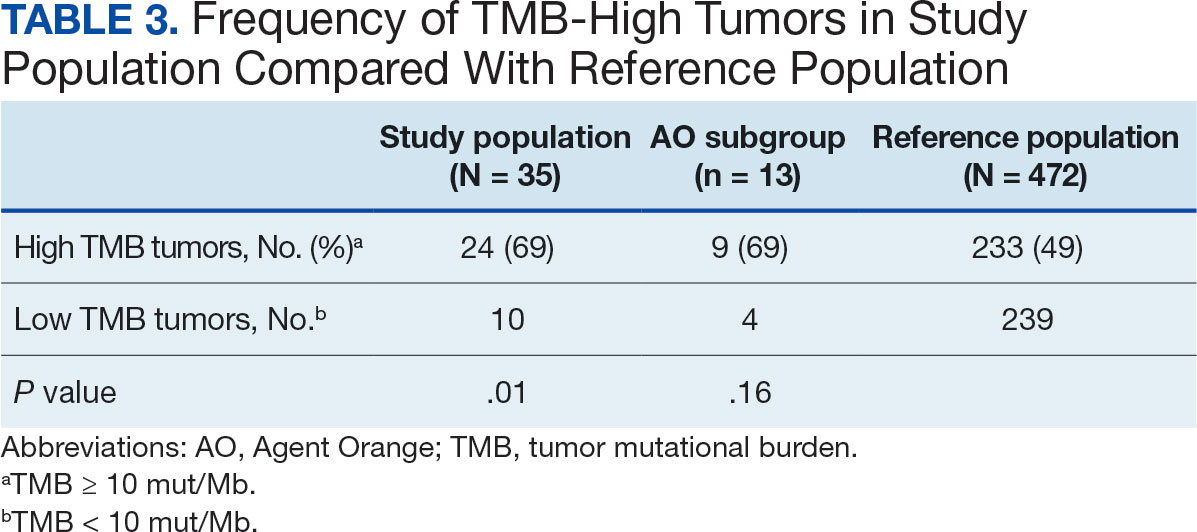
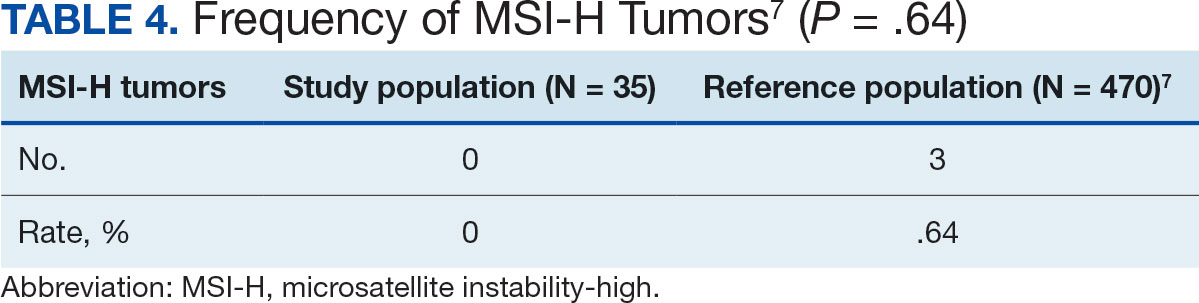
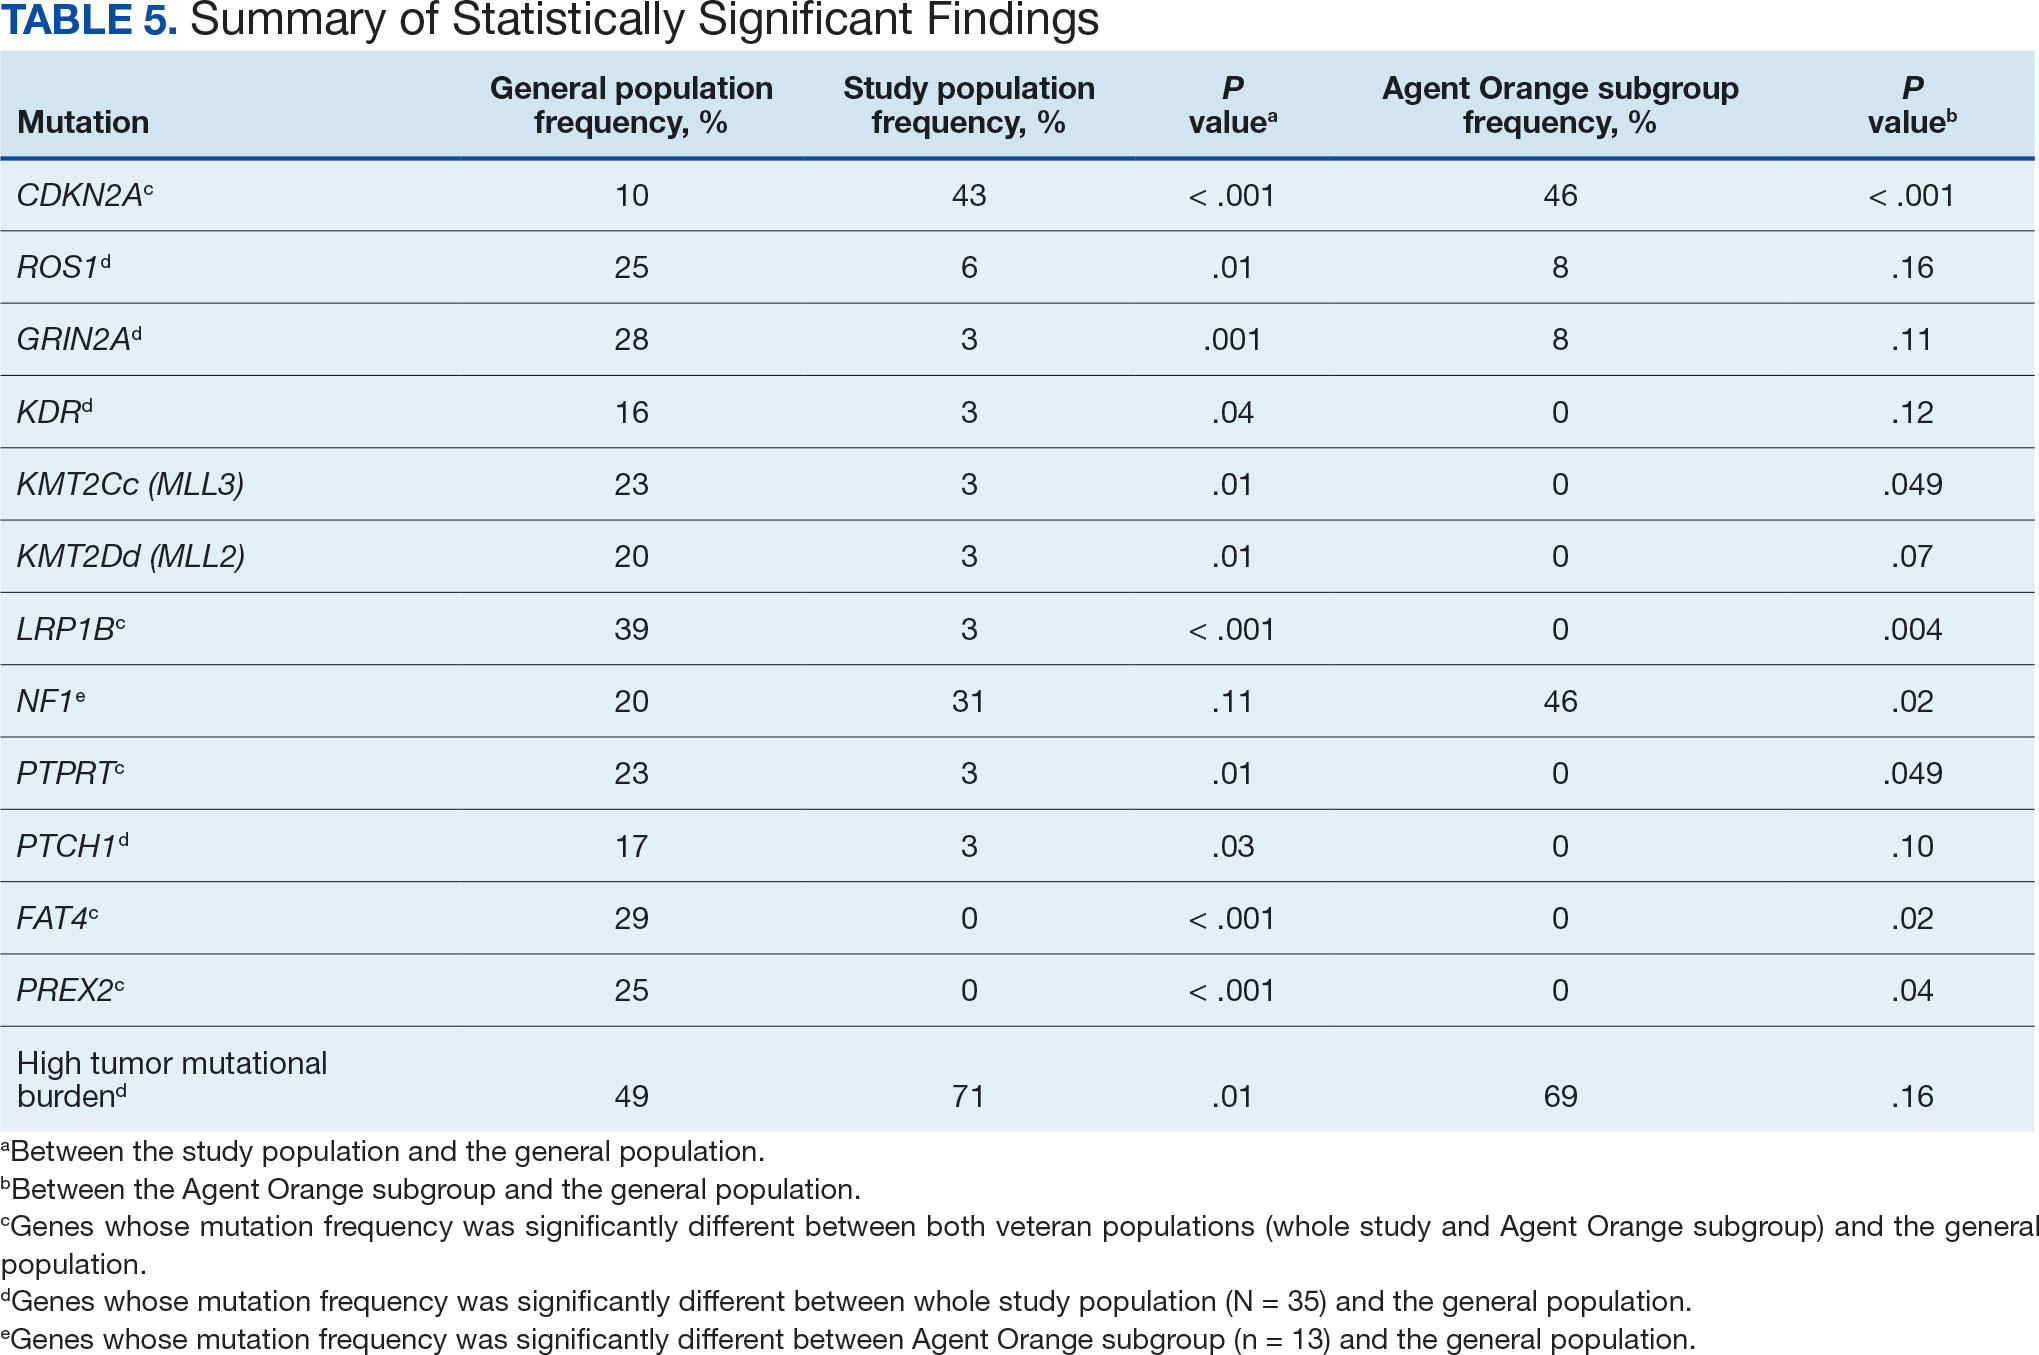
The list of genes mutated in melanoma cells in the study population is provided in the eAppendix.10,11 Twenty-seven patients (77%) had mutations in TERT promoter, 15 (43%) in CDKN2A/B, 13 (37%) in BRAF, 11 (31%) in NF1, 9 (26%) in TP53, and 8 (23%) in NRAS (Table 2). The majority of mutations in TERT promoter were c.- 146C>T (18 of 27 patients [67%]), whereas c.-124C>T was the second-most common (8 of 27 patients [30%]). The 2 observed mutations in the 13 patients with BRAF mutations were V600E and V600K, with almost equal distribution (54% and 46%, respectively). The mean (SD) TMB was 33.2 (39) mut/Mb (range, 1-203 mut/Mb). Ten patients (29%) had a TMB < 10 mut/Mb, whereas 24 (69%) had a TMB > 10 mut/Mb. The TMB could not be determined in 1 case. The frequency of TMB-high tumors in the study population compared with frequency in the reference population is shown in Table 3.12 Only 3 patients (0.64%) in the reference population had MSI-H tumors, and the microsatellite status could not be determined in those tumors (Table 4).13 Table 5 outlines statistically significant findings.
Agent Orange Subgroup
AO was a tactical herbicide used by the US military, named for the orange band around the storage barrels. Possible mutagenic properties of AO have been attributed to its byproduct, dioxin. Among the most common cancers known to be associated with AO exposure are bladder and prostate carcinoma and hematopoietic neoplasms. The association between genetic alterations and AO exposure was studied in veterans with prostate cancer.14 However, to our knowledge, insufficient information is available to determine whether an association exists between exposure to herbicides used in Vietnam or the contaminant dioxin and melanoma. Because a significant proportion of this study population had a well-documented history of AO exposure (37.1%), we were able to analyze them as a subgroup and to separately compare their mutation frequency with the general population.
Results were notable for different distributions of the most frequently mutated genes in the AO subgroup compared with the whole study population. As such, TERT promoter remained the most frequently mutated gene (92%), followed by CDKN2A/B (46%); however, frequency of mutations in NF1 (46%) outnumbered those of BRAF (31%), the fourth-most common mutation. Moreover, when compared with the general melanoma population, a significantly higher frequency of mutations in the NF1 gene was observed in the AO subgroup—not the entire study population.
Discussion
Given that veterans constitute a distinct population, there is reasonable interest in investigating characteristic health issues related to military service. Skin cancer—melanoma in particular—has been researched recently in a veteran population. The differences in demographics, tumor characteristics, and melanoma- specific survival in veterans compared with the general population have already been assessed. According to Chang et al, compared with the general population, veterans are more likely to present with metastatic disease and have lower 5-year survival rates.8
Melanoma is one of the most highly mutated malignancies.15 Fortunately, the most common mutation in melanoma, BRAF V600E, is now considered therapeutically targetable. However, there are still many mutations that are less often discussed and not well understood. Regardless of therapeutic implications, all mutations observed in melanoma are worth investigating because a tumor’s genomic profile also can provide prognostic and etiologic information. Developing comprehensive descriptions of melanoma mutational profiles in specific populations is critical to advancing etiologic understanding and informing prevention strategies.
Our results demonstrate the high prevalence of TERT promoter mutations with characteristic ultraviolet signature (C>T) in the study population. This aligns with general evidence that TERT promoter mutations are common in cutaneous melanomas: 77% of this study sample and up to 86% of all mutations are TERT promoter mutations, according to Davis et al.15 TERT promoter mutations are positively associated with the initiation, invasion, and metastasis of melanoma. In certain subtypes, there is evidence that the presence of TERT promoter mutations is significantly associated with risk for extranodal metastasis and death.16 The second-most common mutated gene in the veteran study population was CDKN2A/B (43%), and the third-most mutated gene was BRAF (37%).
In chronically sun-exposed skin NF1, NRAS, and occasionally BRAF V600K mutations tend to predominate. BRAF V600E mutations, on the other hand, are rare in these melanomas.15 In our study population, the most prevalent melanoma site was the trunk (31%), which is considered a location with an intermittent pattern of sun exposure.17
This study population also had a higher frequency of CDKN2A/B mutations. High frequencies of CDKN2A/B mutations have been reported in familial melanomas, but only 1 patient with CDKN2A/B mutations had a known family history of melanoma.15 Tumors in the study population showed significantly lower frequency of mutations in ROS1, GRIN2A, KDR, KMT2C (MLL3), KMT2D (MLL2), LRP1B, PTPRT, PTCH1, FAT4, and PREX2 (P < .05).
In this study the subgroup of veterans with AO exposure differed from the whole study population. As such, CDKN2A/B mutations were observed with the same frequency as NF1 mutations (46% each); however, BRAF mutations constituted only 31% of the mutations. In addition, the frequency of NF1 mutations was significantly higher in the AO subgroup compared with the general population, but not in the whole study population.
Our sample also differed from the reference population by showing a significantly higher frequency of TMB-high (ie, ≥ 10 mut/Mb) tumors (71% vs 49%; P = .01).12 Interestingly, no significant difference in the frequency of TMB-high tumors was observed between the AO subgroup and the reference population (69% vs 49%; P = .16). There also was no statistically significant difference between the frequency of MSI-H tumors in our study population and the reference population (P = .64).13
One patient in the study population had uveal melanoma. Mutations encountered in this patient’s tumor differed from the general mutational profile of tumors. None of the 21 mutations depicted in Table 2 were present in this sample.10,11 On the other hand, those mutations frequently observed in intraocular melanomas, BAP1 and GNA11, were present in this patient.18 Additionally, this particular melanoma possessed mutations in genes RICTOR, RAD21, and PIK3R1.
Limitations
This study population consisted exclusively of male patients, introducing sex as a potential confounder in analyzing differences between the study population and the general population. As noted in a 2020 systematic review, there were no sex-based differences in the frequency of mutations in BRAF, NRAS, and KIT genes.19
Regarding NF1 mutations, only NF1-mutated acral and mucosal melanomas were more frequently observed in female patients, whereas nonacral NF1-mutated melanomas were more frequently observed in male patients.20 However, there is currently no clear evidence of whether the mutational landscapes of cutaneous melanoma differ by sex.21 Among the 11 cases with NF1-mutatation, site of origin was known in 6, 5 of which originated at nonacral sites. Although the AO subgroup also consisted entirely of male patients, this does not explain the observed increased frequency of NF1 mutations relative to the general population. No such difference was observed between the whole study population, which also consisted exclusively of male patients, and the general population. The similar frequencies of nonacral location in the whole study population (3 acral, 18 nonacral, 14 unknown site of origin) and AO subgroup (1 acral, 7 nonacral, 5 unknown site of origin) preclude location as an explanation.
The Cancer Genome Atlas Network proposed a framework for genomic classification of melanoma into 4 subtypes based on the pattern of the most prevalent significantly mutated genes: mutant BRAF, mutant RAS, mutant NF1, and triple–wild-type. According to that study, BRAF mutations were indeed associated with younger age, in contrast to the NF1-mutant genomic subtype, which was more prevalent in older individuals with higher TMB.22 This emphasizes the need to interpret the potential association of AO exposure and NF1 mutation in melanoma with caution, although additional studies are required to observe the difference between the veteran population and age-matched general population.
On the other hand, Yu et al reported no significant differences of TMB values between patients aged < 60 and ≥ 60 years with melanoma.23 In short, the observed differences we report in our limited study warrant additional investigation with larger sample sizes, sex-matched controlling, and age-matched controlling. The study was limited by its small sample size and the single location.
Conclusion
The genomic profile of melanomas in the veteran population appears to be similar to that of the general population with a few possible differences. Melanomas in the veteran study population showed a higher frequency of CDKN2A/B mutations; lower frequency of ROS1, GRIN2A, KDR, KMT2C (MLL3), KMT2D (MLL2), LRP1B, PTPRT, PTCH1, FAT4, and PREX2 mutations; and higher TMB. In addition, melanomas in the AO subgroup showed higher frequencies of NF1 mutations. The significance of such findings remains to be determined by further investigation.
- Bytnar JA, McGlynn KA, et al. Cancer incidence in the US military: An updated analysis. Cancer. 2024;130(1):96-106. doi:10.1002/cncr.34978
- Singer DS. A new phase of the Cancer Moonshot to end cancer as we know it. Nat Med. 2022;28(7):1345-1347. doi:10.1038/s41591-022-01881-5
- Koczkodaj P, Sulkowska U, Didkowska J, et al. Melanoma mortality trends in 28 European countries: a retrospective analysis for the years 1960-2020. Cancers (Basel). 2023;15(5):1514. Published 2023 Feb 28. doi:10.3390/cancers15051514
- Okobi OE, Abreo E, Sams NP, et al. Trends in melanoma incidence, prevalence, stage at diagnosis, and survival: an analysis of the United States Cancer Statistics (USCS) database. Cureus. 2024;16(10):e70697. doi:10.7759/cureus.70697
- Bartling SJ, Rivard SC, Meyerle JH. Melanoma in an active duty marine. Mil Med. 2017;182:e2034-e2039. doi:10.7205/MILMED-D-17-00127
- American Cancer Society. Cancer facts & figures 2023. American Cancer Society; 2023. Accessed June 20, 2025. https://www.cancer.org/content/dam/cancer-org/research/cancer-facts-and-statistics/annual-cancer-facts-and-figures/2023/2023-cancer-facts-and-figures.pdf
- Rezaei SJ, Kim J, Onyeka S, et al. Skin cancer and other dermatologic conditions among US veterans. JAMA Dermatol. 2024;160(10):1107-1111. doi:10.1001/jamadermatol.2024.3043
- Chang MS, La J, Trepanowski N, et al. Increased relative proportions of advanced melanoma among veterans: a comparative analysis with the Surveillance, Epidemiology, and End Results registry. J Am Acad Dermatol. 2022;87:72-79. doi:10.1016/j.jaad.2022.02.063
- Riemenschneider K, Liu J, Powers JG. Skin cancer in the military: a systematic review of melanoma and nonmelanoma skin cancer incidence, prevention, and screening among active duty and veteran personnel. J Am Acad Dermatol. 2018;78:1185-1192. doi:10.1016/j.jaad.2017.11.062
- Huang FW, Hodis E, Xu MJ, et al. Highly recurrent TERT promoter mutations in human melanoma. Science. 2013;339:957-959. doi:10.1126/science.1229259
- Tate JG, Bamford S, Jubb HC, et al. COSMIC: the Catalogue of Somatic Mutations in Cancer. Nucleic Acids Res. 2019;47:D941-D947. doi:10.1093/nar/gky1015
- Li M, Gao X, Wang X. Identification of tumor mutation burden-associated molecular and clinical features in cancer by analyzing multi-omics data. Front Immunol. 2023;14:1090838. doi:10.3389/fimmu.2023.1090838
- Bonneville R, Krook MA, Kautto EA, et al. Landscape of microsatellite instability across 39 cancer types. JCO Precis Oncol. 2017;2017:PO.17.00073. doi:10.1200/PO.17.00073
- Lui AJ, Pagadala MS, Zhong AY, et al. Agent Orange exposure and prostate cancer risk in the Million Veteran Program. medRxiv [Preprint]. 2023:2023.06.14.23291413. doi:10.1101/2023.06.14.23291413
- Davis EJ, Johnson DB, Sosman JA, et al. Melanoma: what do all the mutations mean? Cancer. 2018;124:3490-3499. doi:10.1002/cncr.31345
- Guo Y, Chen Y, Zhang L, et al. TERT promoter mutations and telomerase in melanoma. J Oncol. 2022;2022:6300329. doi:10.1155/2022/6300329
- Whiteman DC, Stickley M, Watt P, et al. Anatomic site, sun exposure, and risk of cutaneous melanoma. J Clin Oncol. 2006;24:3172-3177. doi:10.1200/JCO.2006.06.1325
- Decatur CL, Ong E, Garg N, et al. Driver mutations in uveal melanoma: associations with gene expression profile and patient outcomes. JAMA Ophthalmol. 2016;134:728-733. doi:10.1001/jamaophthalmol.2016.0903
- Gutiérrez-Castañeda LD, Nova JA, Tovar-Parra JD. Frequency of mutations in BRAF, NRAS, and KIT in different populations and histological subtypes of melanoma: a systemic review. Melanoma Res. 2020;30:62- 70. doi:10.1097/CMR.0000000000000628
- Thielmann CM, Chorti E, Matull J, et al. NF1-mutated melanomas reveal distinct clinical characteristics depending on tumour origin and respond favourably to immune checkpoint inhibitors. Eur J Cancer. 2021;159:113-124. doi:10.1016/j.ejca.2021.09.035
- D’Ecclesiis O, Caini S, Martinoli C, et al. Gender-dependent specificities in cutaneous melanoma predisposition, risk factors, somatic mutations, prognostic and predictive factors: a systematic review. Int J Environ Res Public Health. 2021;18:7945. doi:10.3390/ijerph18157945
- Cancer Genome Atlas Network. Genomic classification of cutaneous melanoma. Cell. 2015;161:1681-1696. doi:10.1016/j.cell.2015.05.044
- Yu Z, Wang J, Feng L, et al. Association of tumor mutational burden with age in solid tumors. J Clin Oncol. 2020;38:e13590-e13590. doi:10.1200/JCO.2020.38.15_suppl.e13590
The veteran population, with its unique and diverse types of exposure and military service experiences, faces distinct health factors compared with the general population. These factors can be categorized into exposures during military service and those occurring postservice. While the latter phase incorporates psychological issues that may arise while transitioning to civilian life, the service period is associated with major physical, chemical, and psychological exposures that can impact veterans’ health. Carcinogenesis related to military exposures is concerning, and different types of malignancies have been associated with military exposures.1 The 2022 introduction of the Cancer Moonshot initiative served as a breeding ground for multiple projects aimed at investigation of exposure-related carcinogenesis, prompting increased attention and efforts to linking specific exposures to specific malignancies.2
Melanoma is the deadliest skin cancer, accounting for 1.3% of all cancer deaths.3 Although it may only account for 1% to 5% of skin cancer diagnoses, its incidence in the United States’ population has been increasing.4,5 There were 97,610 estimated new cases of melanoma in 2023, according to the National Cancer Institute.6
The incidence of melanoma may be higher in the military population compared with the general population.7 Melanoma is the fourth-most common cancer diagnosed in veterans.8
Several demographic characteristics of the US military population are associated with higher melanoma incidence and poorer prognosis, including male sex, older age, and White race. Apart from sun exposure—a known risk factor for melanoma development—other factors, such as service branch, seem to contribute to risk, with the highest melanoma rates noted in the Air Force.9 According to a study by Chang et al, veterans have a higher risk of stage III (18%) or stage IV (13%) melanoma at initial diagnosis.8
Molecular testing of metastatic melanoma is currently the standard of care for guiding the use of US Food and Drug Administration-approved targeted therapies such as BRAF, MEK, and KIT inhibitors. This comparative analysis details the melanoma comprehensive genomic profiles observed at a large US Department of Veterans Affairs (VA) medical center (VAMC) and those reported in reference databases.
Methods
A query to select all metastatic melanomas sent for comprehensive genomic profiling from the Kansas City VAMC (KCVAMC), identified 35 cases from 2019 through 2023 as the study population. The health records of these patients were reviewed to collect demographic information, military service history, melanoma history, other medical, social, and family histories. The comprehensive genomic profiling reports were reviewed to collect the reported pathogenic variants, microsatellite instability (MSI) status, and tumor mutational burden (TMB) for each case.
The Catalogue of Somatic Mutations in Cancer (COSMIC) was used to identify the most commonly mutated genes in melanomas from The Cancer Genome Atlas for the general population.4,5 The literature was consulted to determine the MSI status and TMB in melanomas from The Cancer Genome Atlas for separate reference populations.6,7 The frequency of MSI-high (MSI-H) status, TMB ≥ 10 mutations/megabase (mut/Mb), and mutations in each of the 20 most commonly mutated genes was determined and compared between melanomas from The Cancer Genome Atlas and KCVAMC cases. Corresponding P values were calculated to identify significant differences. Values were calculated for the entire sample as well as a subgroup with Agent Orange (AO) exposure. The study was approved by the KCVAMC Institutional Review Board.
Results
The mean (SD) age of study participants was 72.9 (9.4) years (range, 39-90 years). The mean (SD) duration of military service was 1654 (1421) days (about 4 years, 6 months, and 10 days). Of the 35 patients included, 22 (63%) served during the Vietnam era (November 1, 1965, to April 30, 1975) and 2 (6%) served during the Persian Gulf War era (August 2, 1990, to February 28, 1991). Seventeen veterans (49%) served in the Army, 9 in the Navy (26%), 5 in the Air Force (14%), and 4 in the Marine Corps (11%). Definitive AO exposure was noted in 13 patients (37%) (Table 1).
Of the 35 patients, 24 (69%) had metastatic disease and the primary site of melanoma was unknown in 14 patients (40%). One patient (Patient 32) had an intraocular melanoma. The primary site was the trunk for 11 patients (31%), the face/head for 7 patients (20%) and extremities for 3 patients (9%). Eight patients (23%) were pT3 stage (thickness > 2 mm but < 4 mm), 7 patients (20%) were pT4 stage (thickness > 4 mm), and 5 patients (14%) were pT1 (thickness ≥ 1 mm). One patient had a primary lesion at pT2 stage, and 1 had a Tis stage lesion. Three patients (9%) had a family history of melanoma in a first-degree relative.
The list of genes mutated in melanoma cells in the study population is provided in the eAppendix.10,11 Twenty-seven patients (77%) had mutations in TERT promoter, 15 (43%) in CDKN2A/B, 13 (37%) in BRAF, 11 (31%) in NF1, 9 (26%) in TP53, and 8 (23%) in NRAS (Table 2). The majority of mutations in TERT promoter were c.- 146C>T (18 of 27 patients [67%]), whereas c.-124C>T was the second-most common (8 of 27 patients [30%]). The 2 observed mutations in the 13 patients with BRAF mutations were V600E and V600K, with almost equal distribution (54% and 46%, respectively). The mean (SD) TMB was 33.2 (39) mut/Mb (range, 1-203 mut/Mb). Ten patients (29%) had a TMB < 10 mut/Mb, whereas 24 (69%) had a TMB > 10 mut/Mb. The TMB could not be determined in 1 case. The frequency of TMB-high tumors in the study population compared with frequency in the reference population is shown in Table 3.12 Only 3 patients (0.64%) in the reference population had MSI-H tumors, and the microsatellite status could not be determined in those tumors (Table 4).13 Table 5 outlines statistically significant findings.
Agent Orange Subgroup
AO was a tactical herbicide used by the US military, named for the orange band around the storage barrels. Possible mutagenic properties of AO have been attributed to its byproduct, dioxin. Among the most common cancers known to be associated with AO exposure are bladder and prostate carcinoma and hematopoietic neoplasms. The association between genetic alterations and AO exposure was studied in veterans with prostate cancer.14 However, to our knowledge, insufficient information is available to determine whether an association exists between exposure to herbicides used in Vietnam or the contaminant dioxin and melanoma. Because a significant proportion of this study population had a well-documented history of AO exposure (37.1%), we were able to analyze them as a subgroup and to separately compare their mutation frequency with the general population.
Results were notable for different distributions of the most frequently mutated genes in the AO subgroup compared with the whole study population. As such, TERT promoter remained the most frequently mutated gene (92%), followed by CDKN2A/B (46%); however, frequency of mutations in NF1 (46%) outnumbered those of BRAF (31%), the fourth-most common mutation. Moreover, when compared with the general melanoma population, a significantly higher frequency of mutations in the NF1 gene was observed in the AO subgroup—not the entire study population.
Discussion
Given that veterans constitute a distinct population, there is reasonable interest in investigating characteristic health issues related to military service. Skin cancer—melanoma in particular—has been researched recently in a veteran population. The differences in demographics, tumor characteristics, and melanoma- specific survival in veterans compared with the general population have already been assessed. According to Chang et al, compared with the general population, veterans are more likely to present with metastatic disease and have lower 5-year survival rates.8
Melanoma is one of the most highly mutated malignancies.15 Fortunately, the most common mutation in melanoma, BRAF V600E, is now considered therapeutically targetable. However, there are still many mutations that are less often discussed and not well understood. Regardless of therapeutic implications, all mutations observed in melanoma are worth investigating because a tumor’s genomic profile also can provide prognostic and etiologic information. Developing comprehensive descriptions of melanoma mutational profiles in specific populations is critical to advancing etiologic understanding and informing prevention strategies.
Our results demonstrate the high prevalence of TERT promoter mutations with characteristic ultraviolet signature (C>T) in the study population. This aligns with general evidence that TERT promoter mutations are common in cutaneous melanomas: 77% of this study sample and up to 86% of all mutations are TERT promoter mutations, according to Davis et al.15 TERT promoter mutations are positively associated with the initiation, invasion, and metastasis of melanoma. In certain subtypes, there is evidence that the presence of TERT promoter mutations is significantly associated with risk for extranodal metastasis and death.16 The second-most common mutated gene in the veteran study population was CDKN2A/B (43%), and the third-most mutated gene was BRAF (37%).
In chronically sun-exposed skin NF1, NRAS, and occasionally BRAF V600K mutations tend to predominate. BRAF V600E mutations, on the other hand, are rare in these melanomas.15 In our study population, the most prevalent melanoma site was the trunk (31%), which is considered a location with an intermittent pattern of sun exposure.17
This study population also had a higher frequency of CDKN2A/B mutations. High frequencies of CDKN2A/B mutations have been reported in familial melanomas, but only 1 patient with CDKN2A/B mutations had a known family history of melanoma.15 Tumors in the study population showed significantly lower frequency of mutations in ROS1, GRIN2A, KDR, KMT2C (MLL3), KMT2D (MLL2), LRP1B, PTPRT, PTCH1, FAT4, and PREX2 (P < .05).
In this study the subgroup of veterans with AO exposure differed from the whole study population. As such, CDKN2A/B mutations were observed with the same frequency as NF1 mutations (46% each); however, BRAF mutations constituted only 31% of the mutations. In addition, the frequency of NF1 mutations was significantly higher in the AO subgroup compared with the general population, but not in the whole study population.
Our sample also differed from the reference population by showing a significantly higher frequency of TMB-high (ie, ≥ 10 mut/Mb) tumors (71% vs 49%; P = .01).12 Interestingly, no significant difference in the frequency of TMB-high tumors was observed between the AO subgroup and the reference population (69% vs 49%; P = .16). There also was no statistically significant difference between the frequency of MSI-H tumors in our study population and the reference population (P = .64).13
One patient in the study population had uveal melanoma. Mutations encountered in this patient’s tumor differed from the general mutational profile of tumors. None of the 21 mutations depicted in Table 2 were present in this sample.10,11 On the other hand, those mutations frequently observed in intraocular melanomas, BAP1 and GNA11, were present in this patient.18 Additionally, this particular melanoma possessed mutations in genes RICTOR, RAD21, and PIK3R1.
Limitations
This study population consisted exclusively of male patients, introducing sex as a potential confounder in analyzing differences between the study population and the general population. As noted in a 2020 systematic review, there were no sex-based differences in the frequency of mutations in BRAF, NRAS, and KIT genes.19
Regarding NF1 mutations, only NF1-mutated acral and mucosal melanomas were more frequently observed in female patients, whereas nonacral NF1-mutated melanomas were more frequently observed in male patients.20 However, there is currently no clear evidence of whether the mutational landscapes of cutaneous melanoma differ by sex.21 Among the 11 cases with NF1-mutatation, site of origin was known in 6, 5 of which originated at nonacral sites. Although the AO subgroup also consisted entirely of male patients, this does not explain the observed increased frequency of NF1 mutations relative to the general population. No such difference was observed between the whole study population, which also consisted exclusively of male patients, and the general population. The similar frequencies of nonacral location in the whole study population (3 acral, 18 nonacral, 14 unknown site of origin) and AO subgroup (1 acral, 7 nonacral, 5 unknown site of origin) preclude location as an explanation.
The Cancer Genome Atlas Network proposed a framework for genomic classification of melanoma into 4 subtypes based on the pattern of the most prevalent significantly mutated genes: mutant BRAF, mutant RAS, mutant NF1, and triple–wild-type. According to that study, BRAF mutations were indeed associated with younger age, in contrast to the NF1-mutant genomic subtype, which was more prevalent in older individuals with higher TMB.22 This emphasizes the need to interpret the potential association of AO exposure and NF1 mutation in melanoma with caution, although additional studies are required to observe the difference between the veteran population and age-matched general population.
On the other hand, Yu et al reported no significant differences of TMB values between patients aged < 60 and ≥ 60 years with melanoma.23 In short, the observed differences we report in our limited study warrant additional investigation with larger sample sizes, sex-matched controlling, and age-matched controlling. The study was limited by its small sample size and the single location.
Conclusion
The genomic profile of melanomas in the veteran population appears to be similar to that of the general population with a few possible differences. Melanomas in the veteran study population showed a higher frequency of CDKN2A/B mutations; lower frequency of ROS1, GRIN2A, KDR, KMT2C (MLL3), KMT2D (MLL2), LRP1B, PTPRT, PTCH1, FAT4, and PREX2 mutations; and higher TMB. In addition, melanomas in the AO subgroup showed higher frequencies of NF1 mutations. The significance of such findings remains to be determined by further investigation.
- Bytnar JA, McGlynn KA, et al. Cancer incidence in the US military: An updated analysis. Cancer. 2024;130(1):96-106. doi:10.1002/cncr.34978
- Singer DS. A new phase of the Cancer Moonshot to end cancer as we know it. Nat Med. 2022;28(7):1345-1347. doi:10.1038/s41591-022-01881-5
- Koczkodaj P, Sulkowska U, Didkowska J, et al. Melanoma mortality trends in 28 European countries: a retrospective analysis for the years 1960-2020. Cancers (Basel). 2023;15(5):1514. Published 2023 Feb 28. doi:10.3390/cancers15051514
- Okobi OE, Abreo E, Sams NP, et al. Trends in melanoma incidence, prevalence, stage at diagnosis, and survival: an analysis of the United States Cancer Statistics (USCS) database. Cureus. 2024;16(10):e70697. doi:10.7759/cureus.70697
- Bartling SJ, Rivard SC, Meyerle JH. Melanoma in an active duty marine. Mil Med. 2017;182:e2034-e2039. doi:10.7205/MILMED-D-17-00127
- American Cancer Society. Cancer facts & figures 2023. American Cancer Society; 2023. Accessed June 20, 2025. https://www.cancer.org/content/dam/cancer-org/research/cancer-facts-and-statistics/annual-cancer-facts-and-figures/2023/2023-cancer-facts-and-figures.pdf
- Rezaei SJ, Kim J, Onyeka S, et al. Skin cancer and other dermatologic conditions among US veterans. JAMA Dermatol. 2024;160(10):1107-1111. doi:10.1001/jamadermatol.2024.3043
- Chang MS, La J, Trepanowski N, et al. Increased relative proportions of advanced melanoma among veterans: a comparative analysis with the Surveillance, Epidemiology, and End Results registry. J Am Acad Dermatol. 2022;87:72-79. doi:10.1016/j.jaad.2022.02.063
- Riemenschneider K, Liu J, Powers JG. Skin cancer in the military: a systematic review of melanoma and nonmelanoma skin cancer incidence, prevention, and screening among active duty and veteran personnel. J Am Acad Dermatol. 2018;78:1185-1192. doi:10.1016/j.jaad.2017.11.062
- Huang FW, Hodis E, Xu MJ, et al. Highly recurrent TERT promoter mutations in human melanoma. Science. 2013;339:957-959. doi:10.1126/science.1229259
- Tate JG, Bamford S, Jubb HC, et al. COSMIC: the Catalogue of Somatic Mutations in Cancer. Nucleic Acids Res. 2019;47:D941-D947. doi:10.1093/nar/gky1015
- Li M, Gao X, Wang X. Identification of tumor mutation burden-associated molecular and clinical features in cancer by analyzing multi-omics data. Front Immunol. 2023;14:1090838. doi:10.3389/fimmu.2023.1090838
- Bonneville R, Krook MA, Kautto EA, et al. Landscape of microsatellite instability across 39 cancer types. JCO Precis Oncol. 2017;2017:PO.17.00073. doi:10.1200/PO.17.00073
- Lui AJ, Pagadala MS, Zhong AY, et al. Agent Orange exposure and prostate cancer risk in the Million Veteran Program. medRxiv [Preprint]. 2023:2023.06.14.23291413. doi:10.1101/2023.06.14.23291413
- Davis EJ, Johnson DB, Sosman JA, et al. Melanoma: what do all the mutations mean? Cancer. 2018;124:3490-3499. doi:10.1002/cncr.31345
- Guo Y, Chen Y, Zhang L, et al. TERT promoter mutations and telomerase in melanoma. J Oncol. 2022;2022:6300329. doi:10.1155/2022/6300329
- Whiteman DC, Stickley M, Watt P, et al. Anatomic site, sun exposure, and risk of cutaneous melanoma. J Clin Oncol. 2006;24:3172-3177. doi:10.1200/JCO.2006.06.1325
- Decatur CL, Ong E, Garg N, et al. Driver mutations in uveal melanoma: associations with gene expression profile and patient outcomes. JAMA Ophthalmol. 2016;134:728-733. doi:10.1001/jamaophthalmol.2016.0903
- Gutiérrez-Castañeda LD, Nova JA, Tovar-Parra JD. Frequency of mutations in BRAF, NRAS, and KIT in different populations and histological subtypes of melanoma: a systemic review. Melanoma Res. 2020;30:62- 70. doi:10.1097/CMR.0000000000000628
- Thielmann CM, Chorti E, Matull J, et al. NF1-mutated melanomas reveal distinct clinical characteristics depending on tumour origin and respond favourably to immune checkpoint inhibitors. Eur J Cancer. 2021;159:113-124. doi:10.1016/j.ejca.2021.09.035
- D’Ecclesiis O, Caini S, Martinoli C, et al. Gender-dependent specificities in cutaneous melanoma predisposition, risk factors, somatic mutations, prognostic and predictive factors: a systematic review. Int J Environ Res Public Health. 2021;18:7945. doi:10.3390/ijerph18157945
- Cancer Genome Atlas Network. Genomic classification of cutaneous melanoma. Cell. 2015;161:1681-1696. doi:10.1016/j.cell.2015.05.044
- Yu Z, Wang J, Feng L, et al. Association of tumor mutational burden with age in solid tumors. J Clin Oncol. 2020;38:e13590-e13590. doi:10.1200/JCO.2020.38.15_suppl.e13590
Comprehensive Genomic Profiles of Melanoma in Veterans Compared to Reference Databases
Comprehensive Genomic Profiles of Melanoma in Veterans Compared to Reference Databases


Colorectal Cancer Characteristics and Mortality From Propensity Score-Matched Cohorts of Urban and Rural Veterans
Colorectal Cancer Characteristics and Mortality From Propensity Score-Matched Cohorts of Urban and Rural Veterans
Colorectal cancer (CRC) is the second-leading cause of cancer-related deaths in the United States, with an estimated 52,550 deaths in 2023.1 However, the disease burden varies among different segments of the population.2 While both CRC incidence and mortality have been decreasing due to screening and advances in treatment, there are disparities in incidence and mortality across the sociodemographic spectrum including race, ethnicity, education, and income.1-4 While CRC incidence is decreasing for older adults, it is increasing among those aged < 55 years.5 The incidence of CRC in adults aged 40 to 54 years has increased by 0.5% to 1.3% annually since the mid-1990s.6 The US Preventive Services Task Force now recommends starting CRC screening at age 45 years for asymptomatic adults with average risk.7
Disparities also exist across geographical boundaries and living environment. Rural Americans faces additional challenges in health and lifestyle that can affect CRC outcomes. Compared to their urban counterparts, rural residents are more likely to be older, have lower levels of education, higher levels of poverty, lack health insurance, and less access to health care practitioners (HCPs).8-10 Geographic proximity, defined as travel time or physical distance to a health facility, has been recognized as a predictor of inferior outcomes.11 These aspects of rural living may pose challenges for accessing care for CRC screening and treatment.11-13 National and local studies have shown disparities in CRC screening rates, incidence, and mortality between rural and urban populations.14-16
It is unclear whether rural/urban disparities persist under the Veterans Health Administration (VHA) health care delivery model. This study examined differences in baseline characteristics and mortality between rural and urban veterans newly diagnosed with CRC. We also focused on a subpopulation aged ≤ 45 years.
Methods
This study extracted national data from the US Department of Veterans Affairs (VA) Corporate Data Warehouse (CDW) hosted in the VA Informatics and Computing Infrastructure (VINCI) environment. VINCI is an initiative to improve access to VA data and facilitate the analysis of these data while ensuring veterans’ privacy and data security.17 CDW is the VHA business intelligence information repository, which extracts data from clinical and nonclinical sources following prescribed and validated protocols. Data extracted included demographics, diagnosis, and procedure codes for both inpatient and outpatient encounters, vital signs, and vital status. This study used data previously extracted from a national cohort of veterans that encompassed all patients who received a group of commonly prescribed medications, such as statins, proton pump inhibitors, histamine-2 blockers, acetaminophen-containing products, and hydrocortisone-containing skin applications. This cohort encompassed 8,648,754 veterans, from whom 2,460,727 had encounters during fiscal years (FY) 2016 to 2021 (study period). The cohort was used to ensure that subjects were VHA patients, allowing them to adequately capture their clinical profiles.
Patients were identified as rural or urban based on their residence address at the date of their first diagnosis of CRC. The Geospatial Service Support Center (GSSC) aggregates and updates veterans’ residence address records for all enrolled veterans from the National Change of Address database. The data contain 1 record per enrollee. GSSC Geocoded Enrollee File contains enrollee addresses and their rurality indicators, categorized as urban, rural, or highly rural.18 Rurality is defined by the Rural Urban Commuting Area (RUCA) categories developed by the Department of Agriculture and the Health Resources and Services Administration of the US Department of Health and Human Services.19 Urban areas had RUCA codes of 1.0 to 1.1, and highly rural areas had RUCA scores of 10.0. All other areas were classified as rural. Since the proportion of veterans from highly rural areas was small, we included residents from highly rural areas in the rural residents’ group.
Inclusion and Exclusion Criteria
All veterans newly diagnosed with CRC from FY 2016 to 2021 were included. We used the ninth and tenth clinical modification revisions of the International Classification of Diseases (ICD-9-CM and ICD-10-CM) to define CRC diagnosis (Supplemental materials).4,20 To ensure that patients were newly diagnosed with CRC, this study excluded patients with a previous ICD-9-CM code for CRC diagnosis since FY 2003.
Comorbidities were identified using diagnosis and procedure codes from inpatient and outpatient encounters, which were used to calculate the Charlson Comorbidity Index (CCI) at the time of CRC diagnosis using the weighted method described by Schneeweiss et al.21 We defined CRC high-risk conditions and CRC screening tests, including flexible sigmoidoscopy and stool tests, as described in previous studies (Supplemental materials).20
The main outcome was total mortality. The date of death was extracted from the VHA Death Ascertainment File, which contains mortality data from the Master Person Index file in CDW and the Social Security Administration Death Master File. We used the date of death from any cause, as cause of death was not available.
A propensity score (PS) was created to match rural (including highly rural) and urban residents at a ratio of 1:1. Using a standard procedure described in prior publications, multivariable logistic regression used all baseline characteristics to estimate the PS and perform nearest-number matching without replacement.22,23 A caliper of 0.01 maximized the matched cohort size and achieved balance (Supplemental materials). We then examined the balance of baseline characteristics between PS-matched groups.
Analyses
Cox proportional hazards regression analysis estimated the hazard ratio (HR) of death in rural residents compared to urban residents in the PS-matched cohort. The outcome event was the date of death during the study’s follow-up period (defined as period from first CRC diagnosis to death or study end), with censoring at the study’s end date (September 30, 2021). The proportional hazards assumption was assessed by inspecting the Kaplan-Meier curves. Multiple analyses examined the HR of total mortality in the PS-matched cohort, stratified by sex, race, and ethnicity. We also examined the HR of total mortality stratified by duration of follow-up.
Another PS-matching analysis among veterans aged ≤ 45 years was performed using the same techniques described earlier in this article. We performed a Cox proportional hazards regression analysis to compare mortality in PS-matched urban and rural veterans aged ≤ 45 years. The HR of death in all veterans aged ≤ 45 years (before PS-matching) was estimated using Cox proportional hazard regression analysis, adjusting for PS.
Dichotomous variables were compared using X2 tests and continuous variables were compared using t tests. Baseline characteristics with missing values were converted into categorical variables and the proportion of subjects with missing values was equalized between treatment groups after PS-matching. For subgroup analysis, we examined the HR of total mortality in each subgroup using separate Cox proportional hazards regression models similar to the primary analysis but adjusted for PS. Due to multiple comparisons in the subgroup analysis, the findings should be considered exploratory. Statistical tests were 2-tailed, and significance was defined as P < .05. Data management and statistical analyses were conducted from June 2022 to January 2023 using STATA, Version 17. The VA Orlando Healthcare System Institutional Review Board approved the study and waived requirements for informed consent because only deidentified data were used.
Results
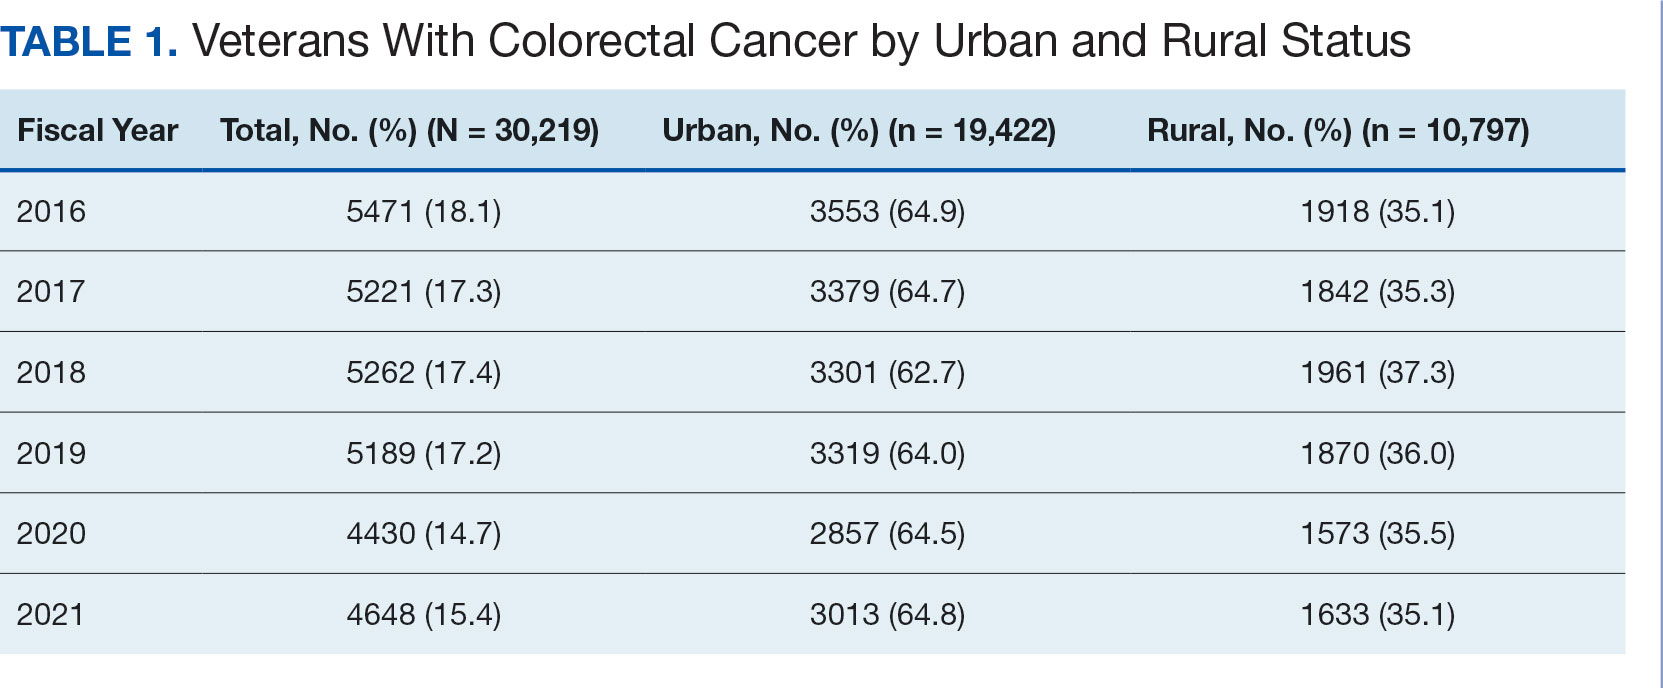
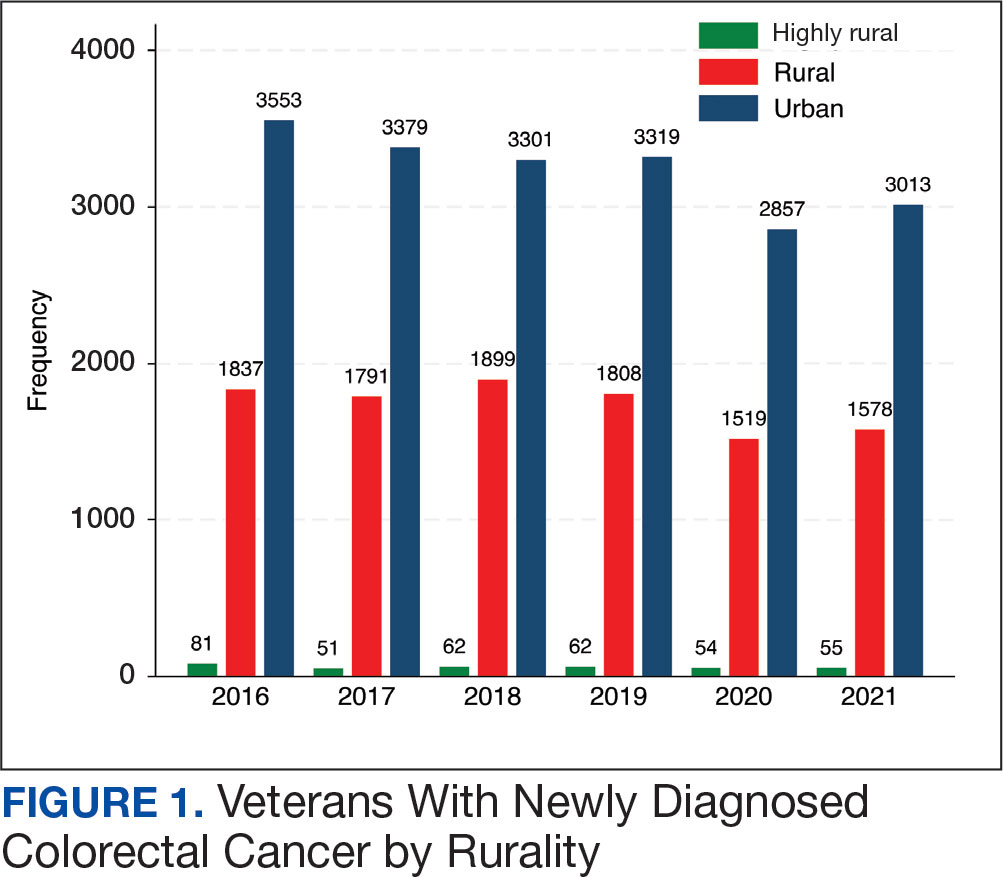
After excluding 49 patients (Supplemental materials, available at doi:10.12788/fp.0560), we identified 30,219 veterans with newly diagnosed CRC between FY 2016 to 2021 (Table 1). Of these, 19,422 (64.3%) resided in urban areas and 10,797 (35.7%) resided in rural areas (Table 2). The mean (SD) duration from the first CRC diagnosis to death or study end was 832 (640) days, and the median (IQR) was 723 (246–1330) days. Overall, incident CRC diagnoses were numerically highest in FY 2016 and lowest in FY 2020 (Figure 1). Patients with CRC in rural areas vs urban areas were significantly older (mean, 71.2 years vs 70.8 years, respectively; P < .001), more likely to be male (96.7% vs 95.7%, respectively; P < .001), more likely to be White (83.6% vs 67.8%, respectively; P < .001) and more likely to be non-Hispanic (92.2% vs 87.5%, respectively; P < .001). In terms of general health, rural veterans with CRC were more likely to be overweight or obese (81.5% rural vs 78.5% urban; P < .001) but had fewer mean comorbidities as measured by CCI (5.66 rural vs 5.90 urban; P < .001). A higher proportion of rural veterans with CRC had received stool-based (fecal occult blood test or fecal immunochemical test) CRC screening tests (61.6% rural vs 57.2% urban; P < .001). Fewer rural patients presented with systemic symptoms or signs within 1 year of CRC diagnosis (54.4% rural vs 57.5% urban, P < .001). Among urban patients with CRC, 6959 (35.8%) deaths were observed, compared with 3766 (34.9%) among rural patients (P = .10).
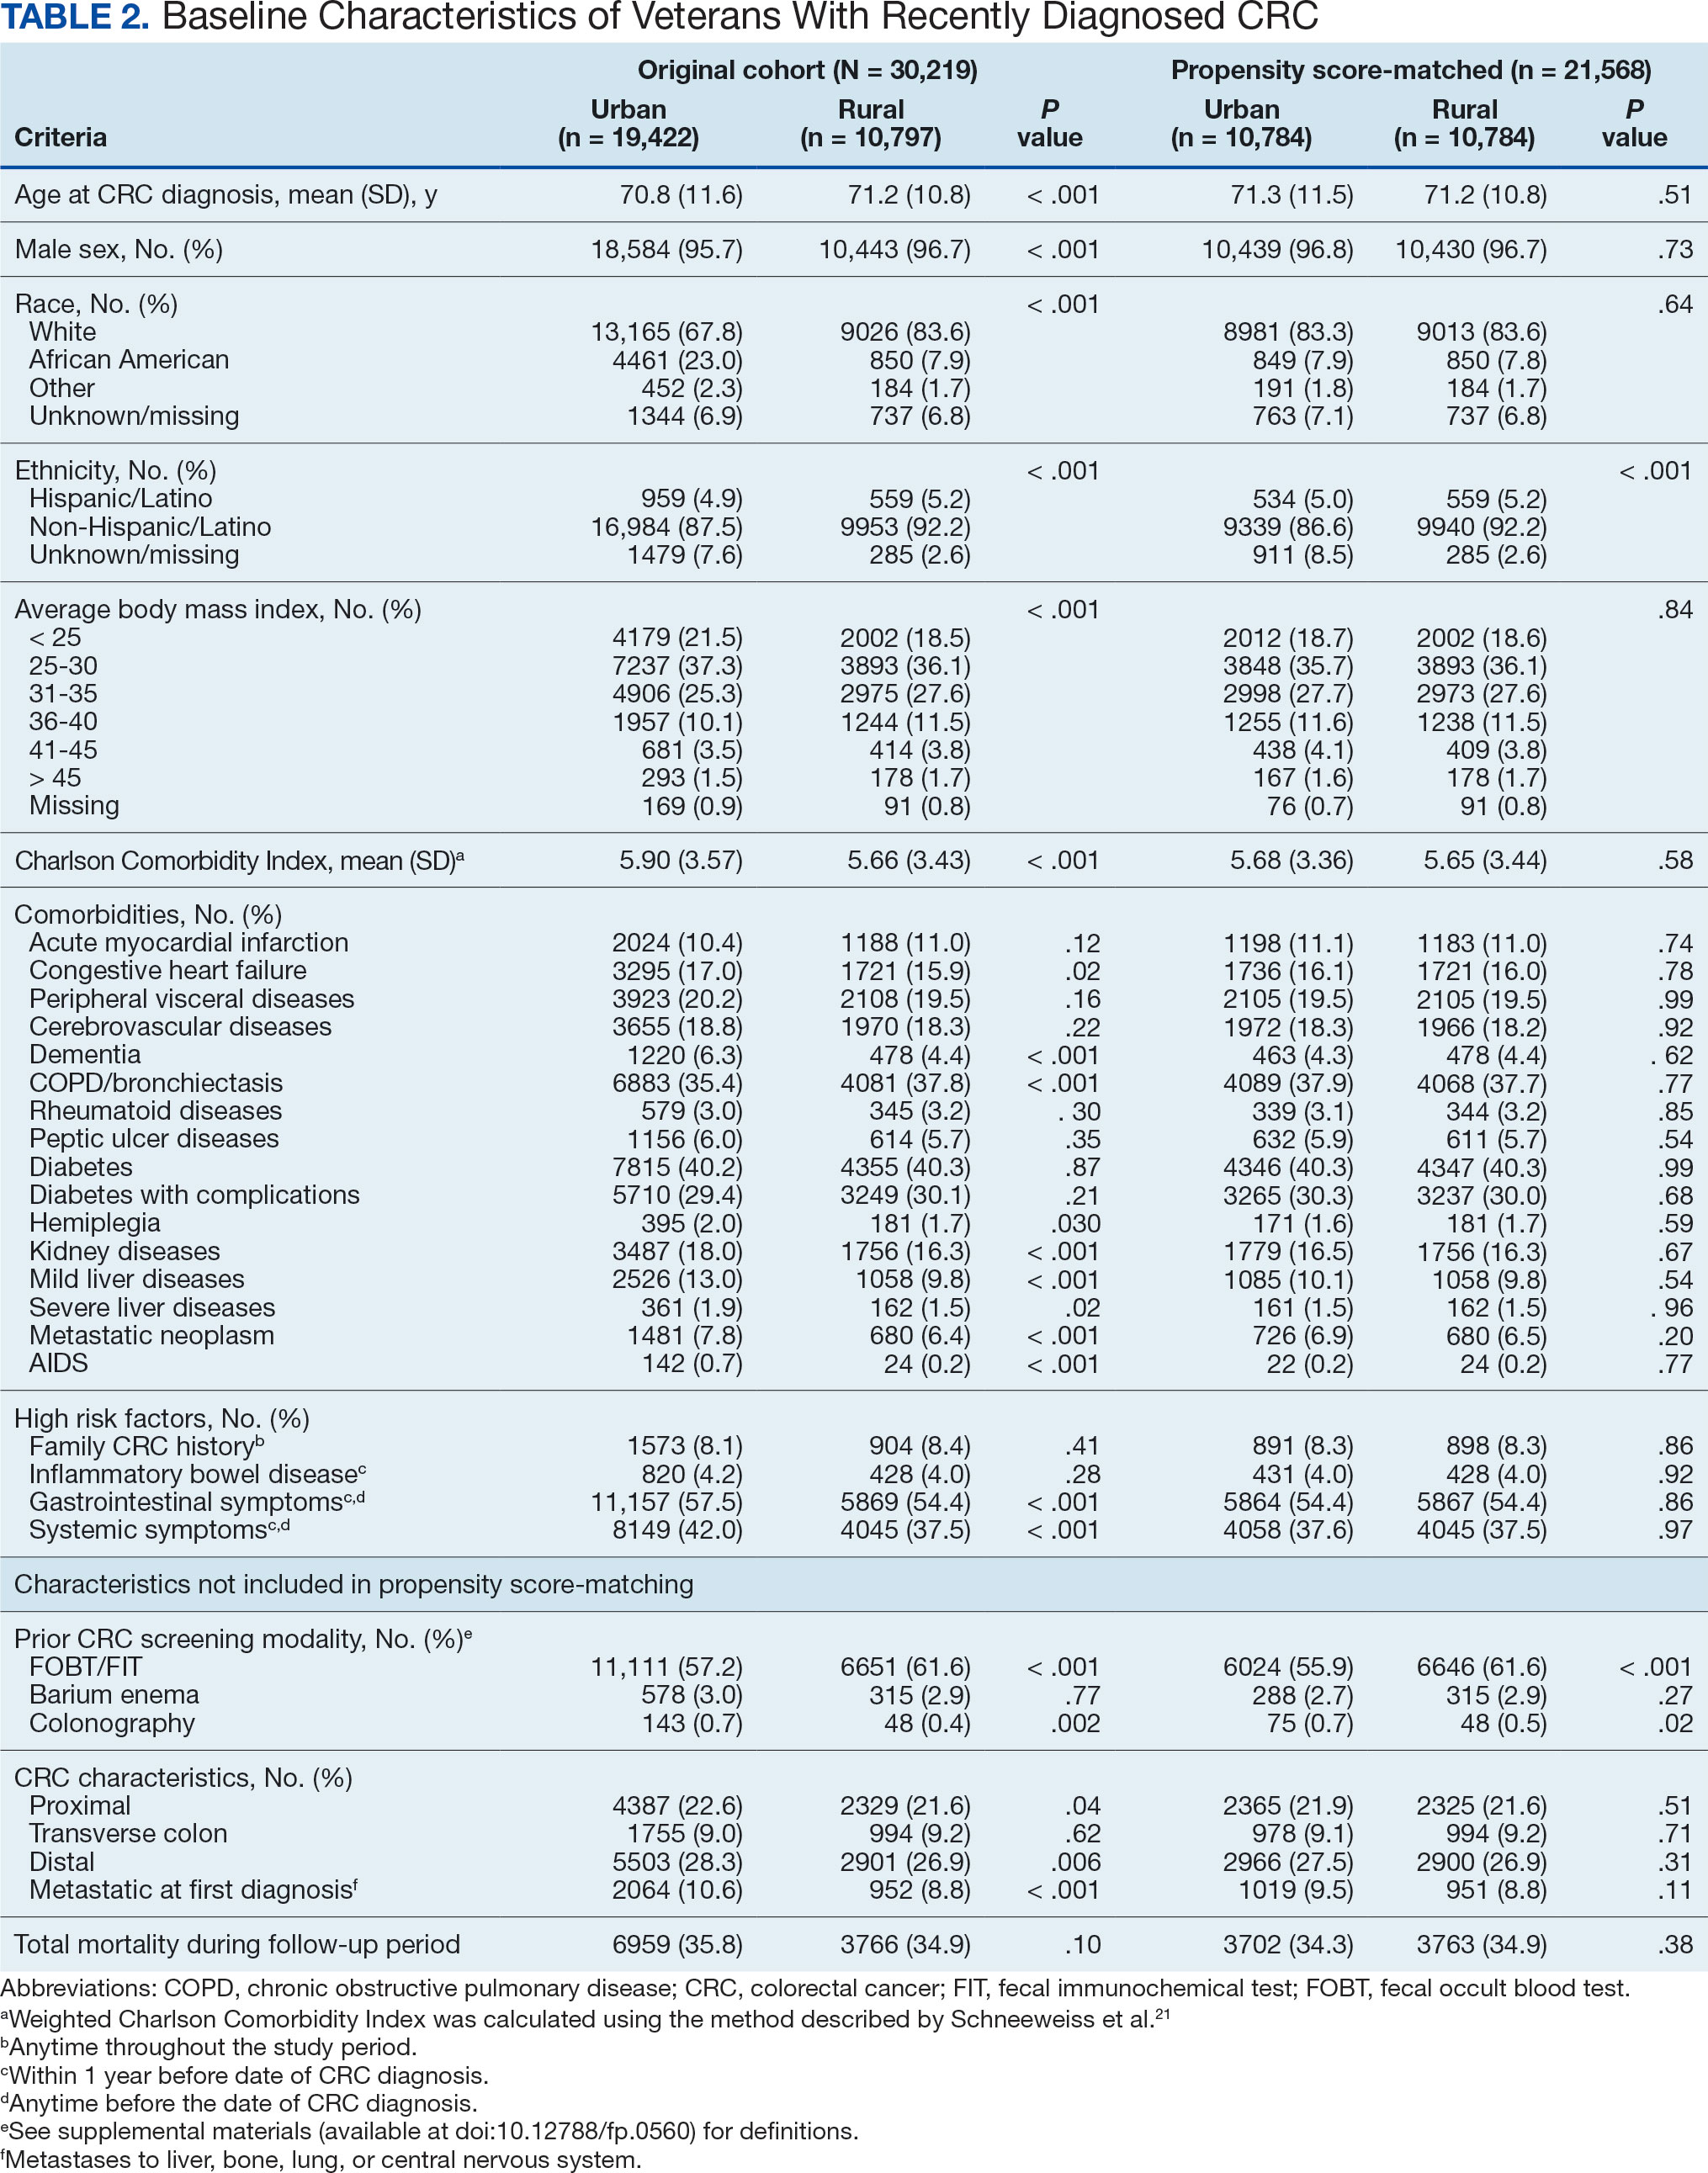
There were 21,568 PS-matched veterans: 10,784 in each group. In the PS-matched cohort, baseline characteristics were similar between veterans in urban and rural communities, including age, sex, race/ethnicity, body mass index, and comorbidities. Among rural patients with CRC, 3763 deaths (34.9%) were observed compared with 3702 (34.3%) among urban veterans. There was no significant difference in the HR of mortality between rural and urban CRC residents (HR, 1.01; 95% CI, 0.97-1.06; P = .53) (Figure 2).
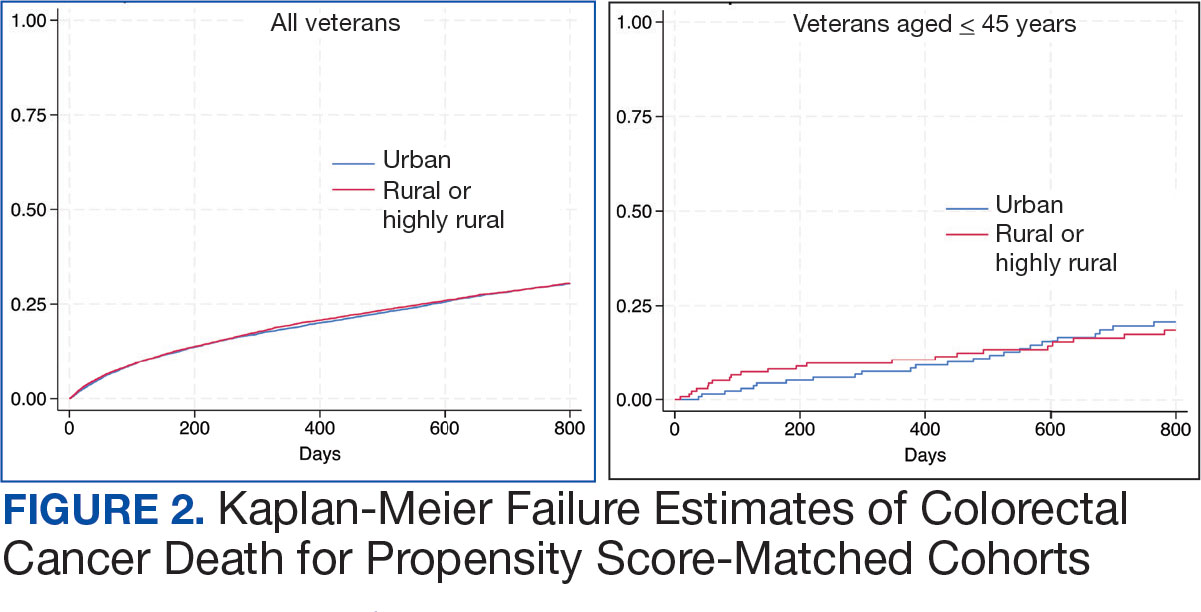
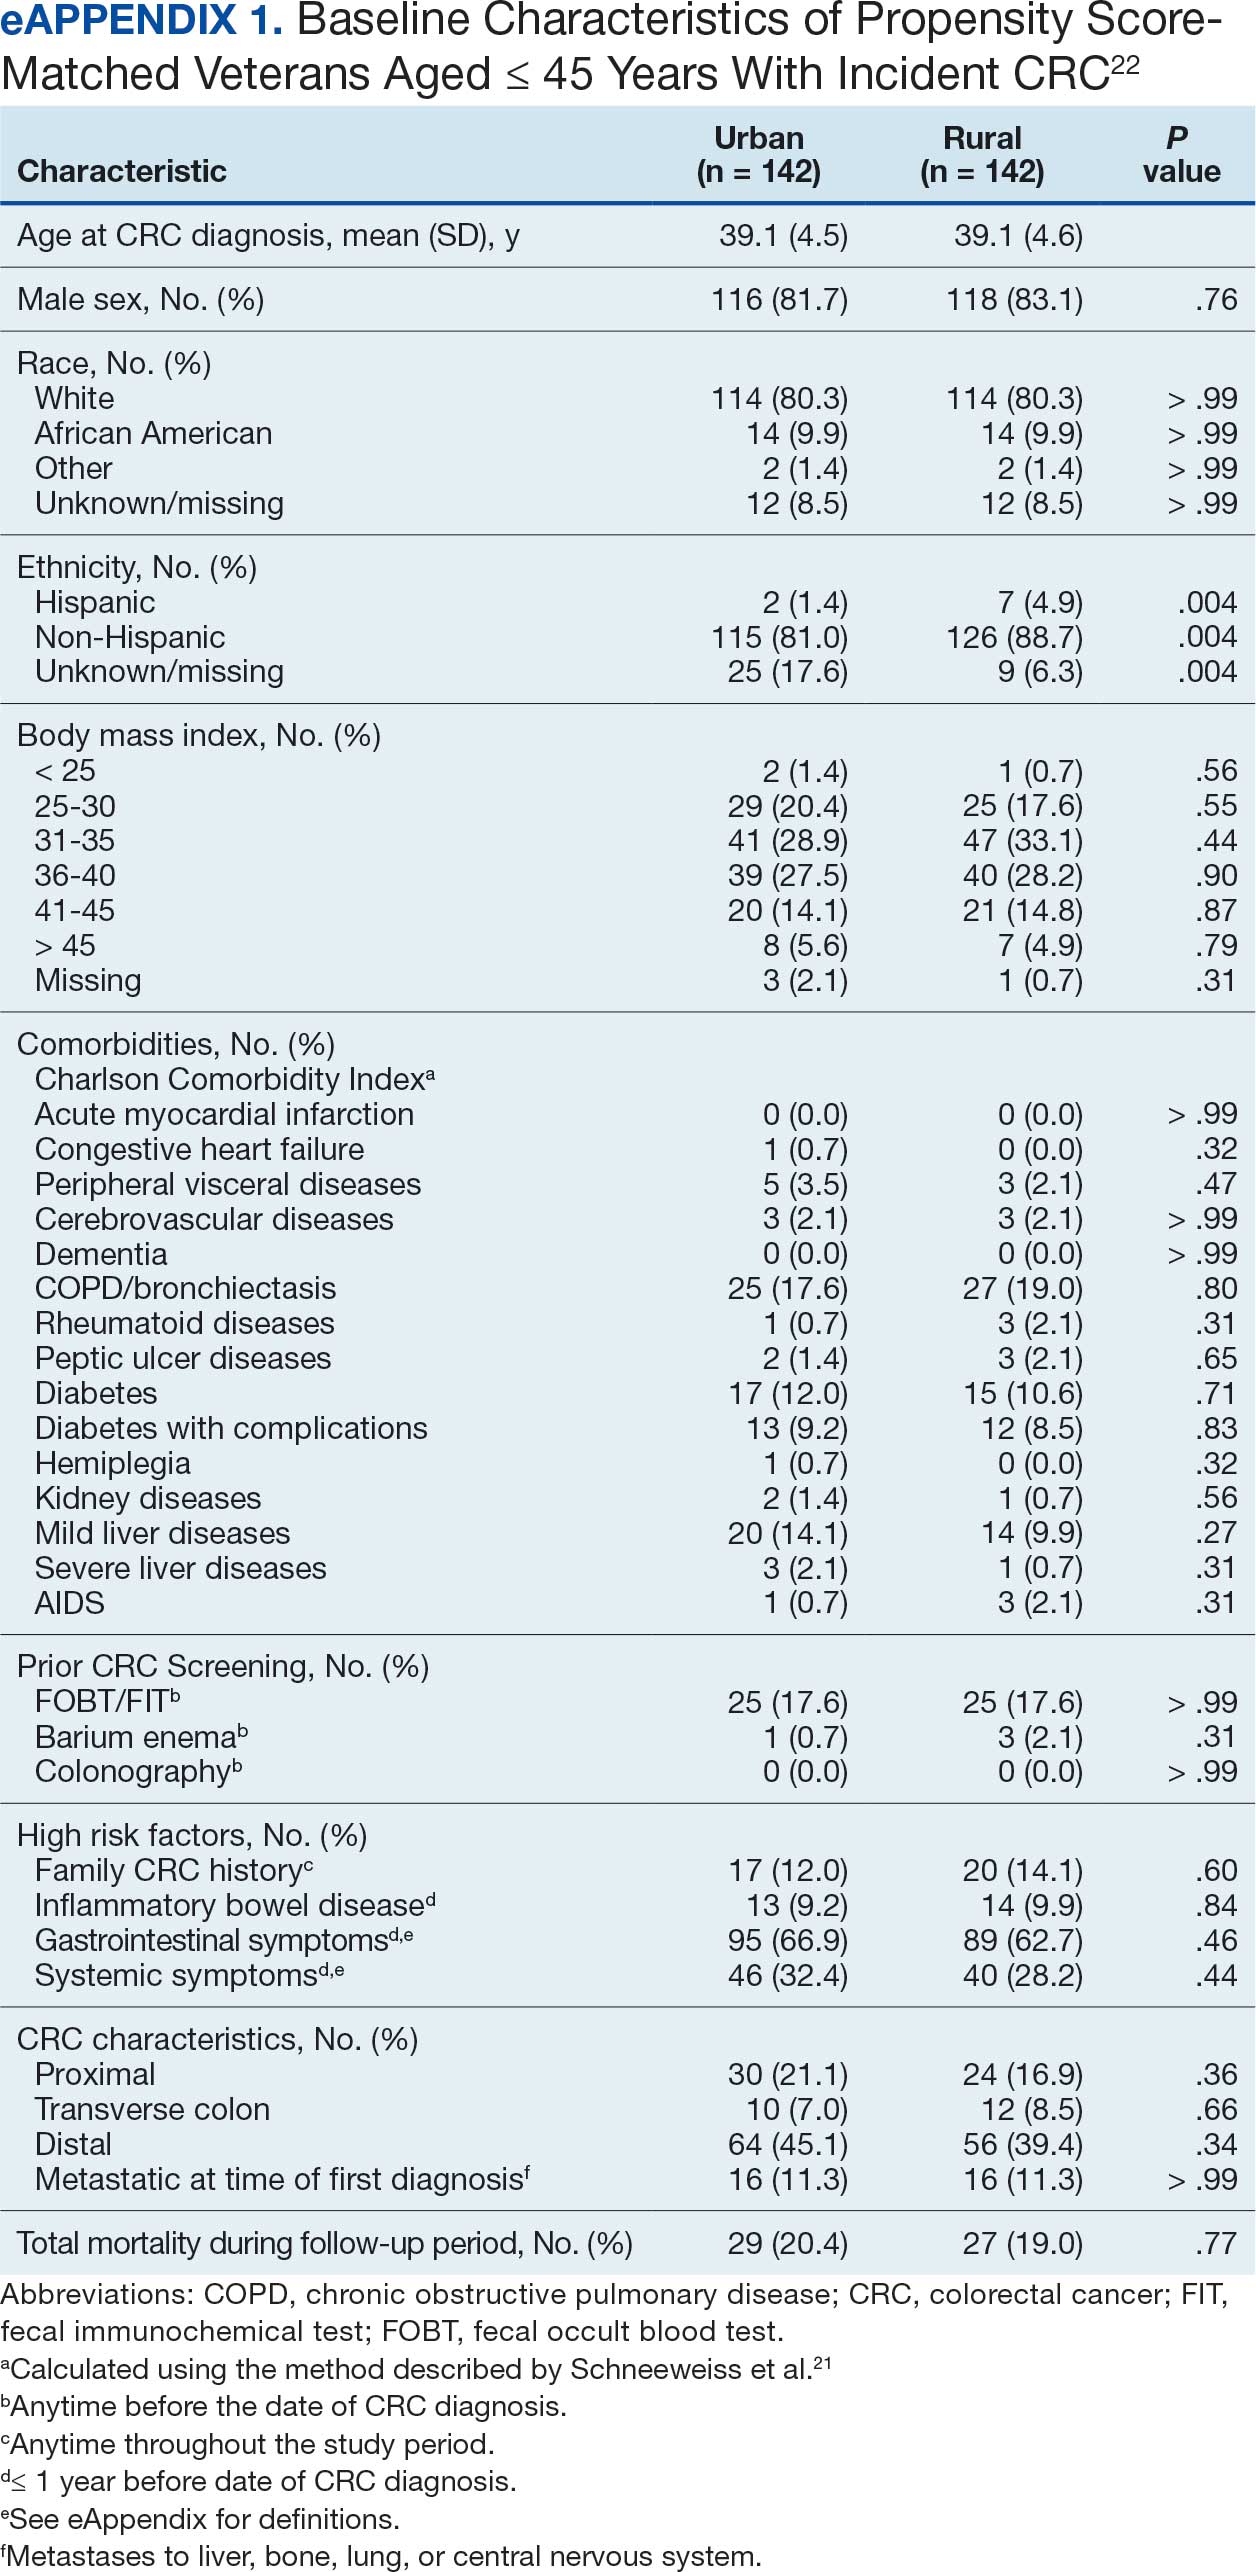
Among veterans aged ≤ 45 years, 551 were diagnosed with CRC (391 urban and 160 rural). We PS-matched 142 pairs of urban and rural veterans without residual differences in baseline characteristics (eAppendix 1). There was no significant difference in the HR of mortality between rural and urban veterans aged ≤ 45 years (HR, 0.97; 95% CI, 0.57-1.63; P = .90) (Figure 2). Similarly, no difference in mortality was observed adjusting for PS between all rural and urban veterans aged ≤ 45 years (HR, 1.03; 95% CI, 0.67-1.59; P = .88).
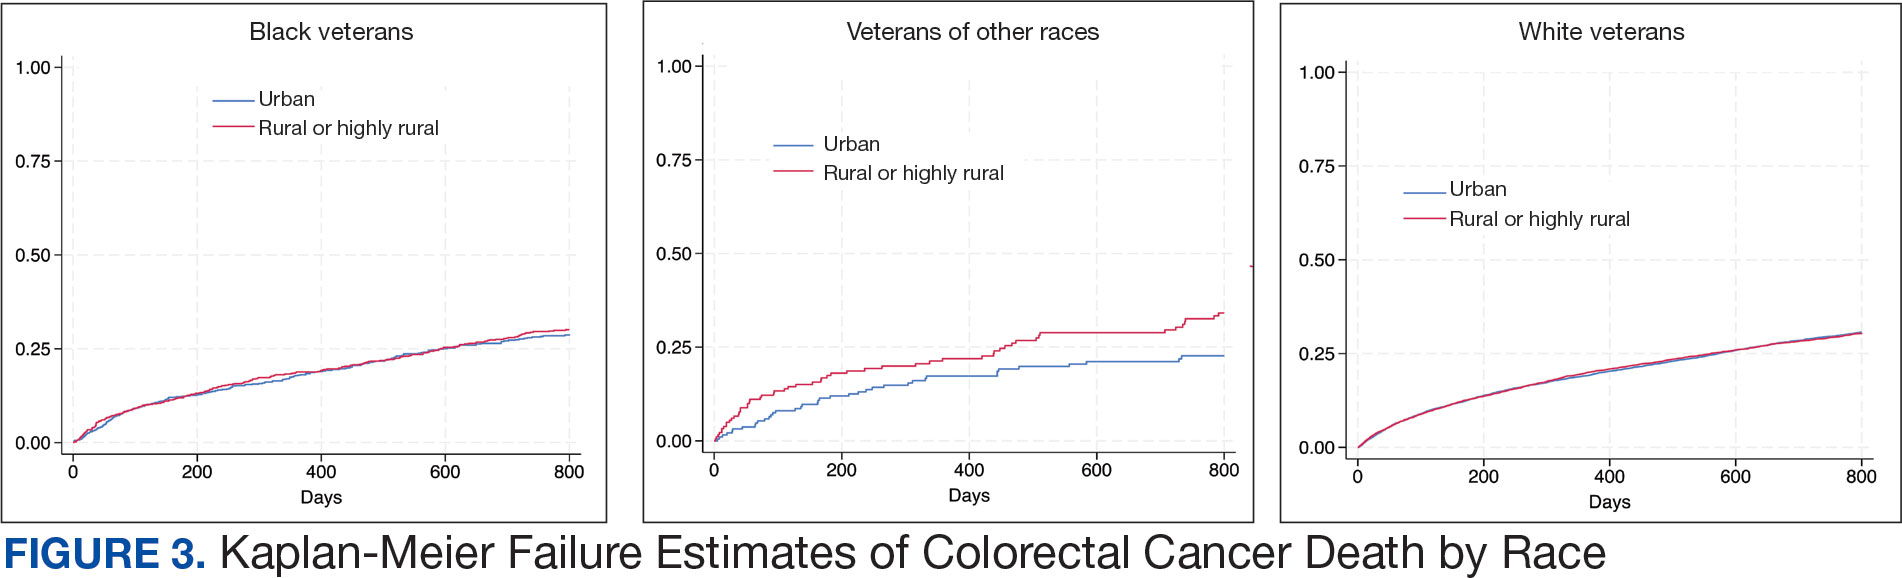
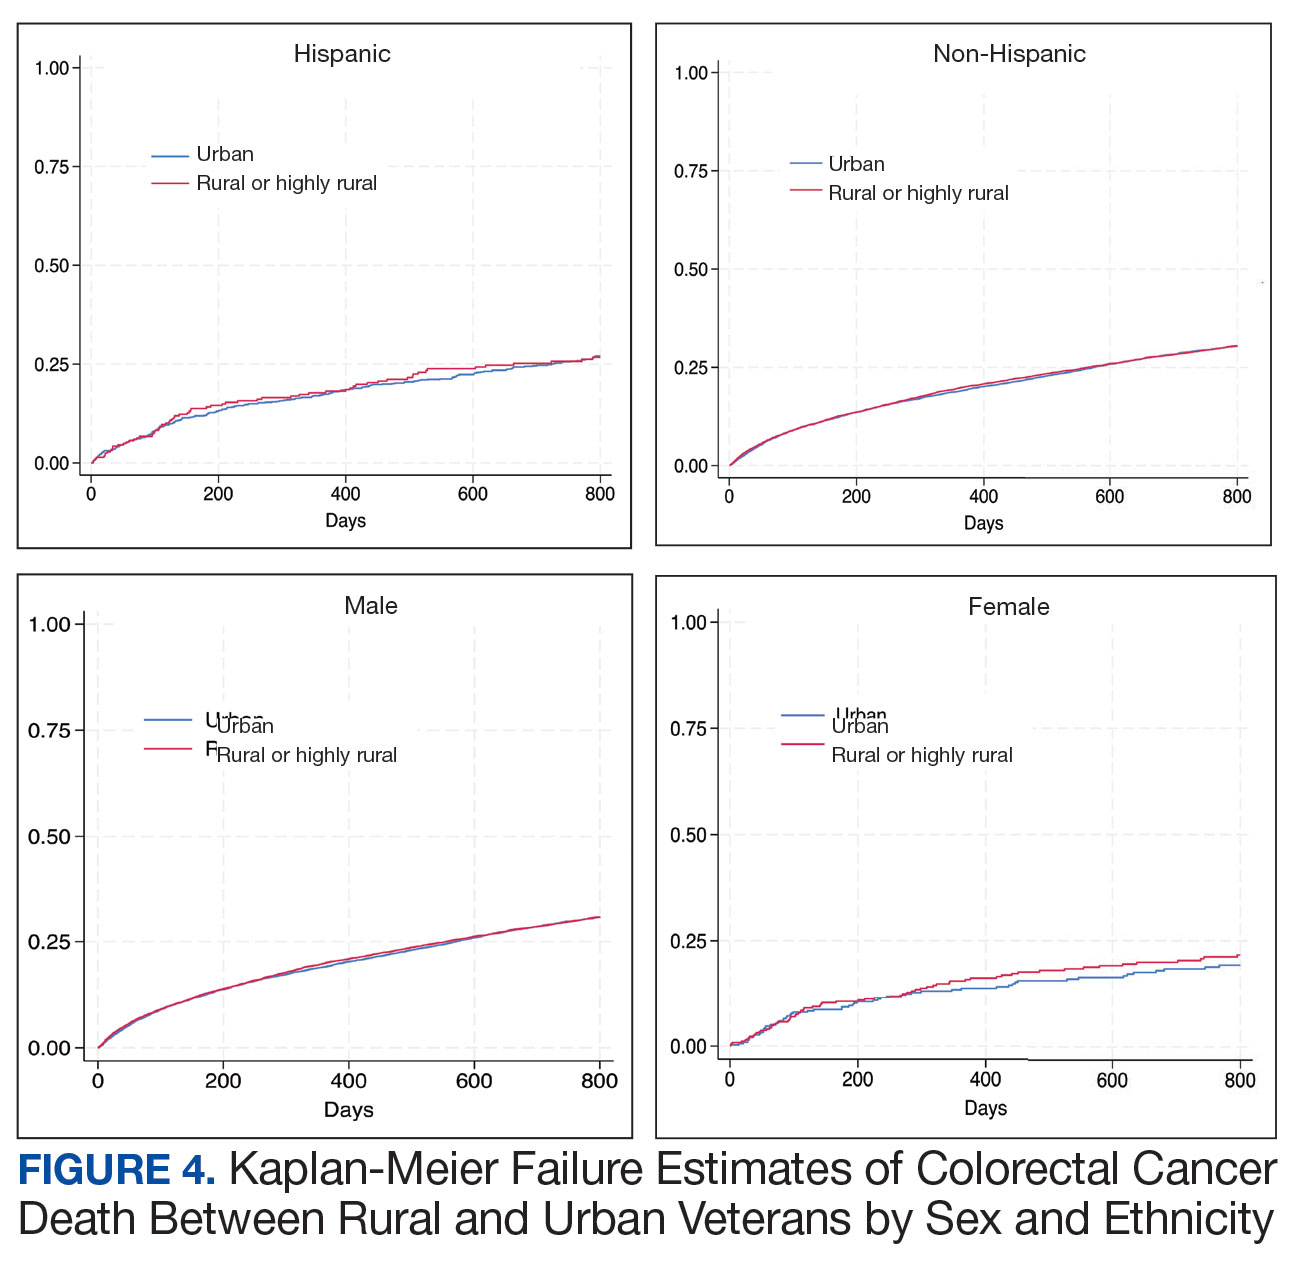
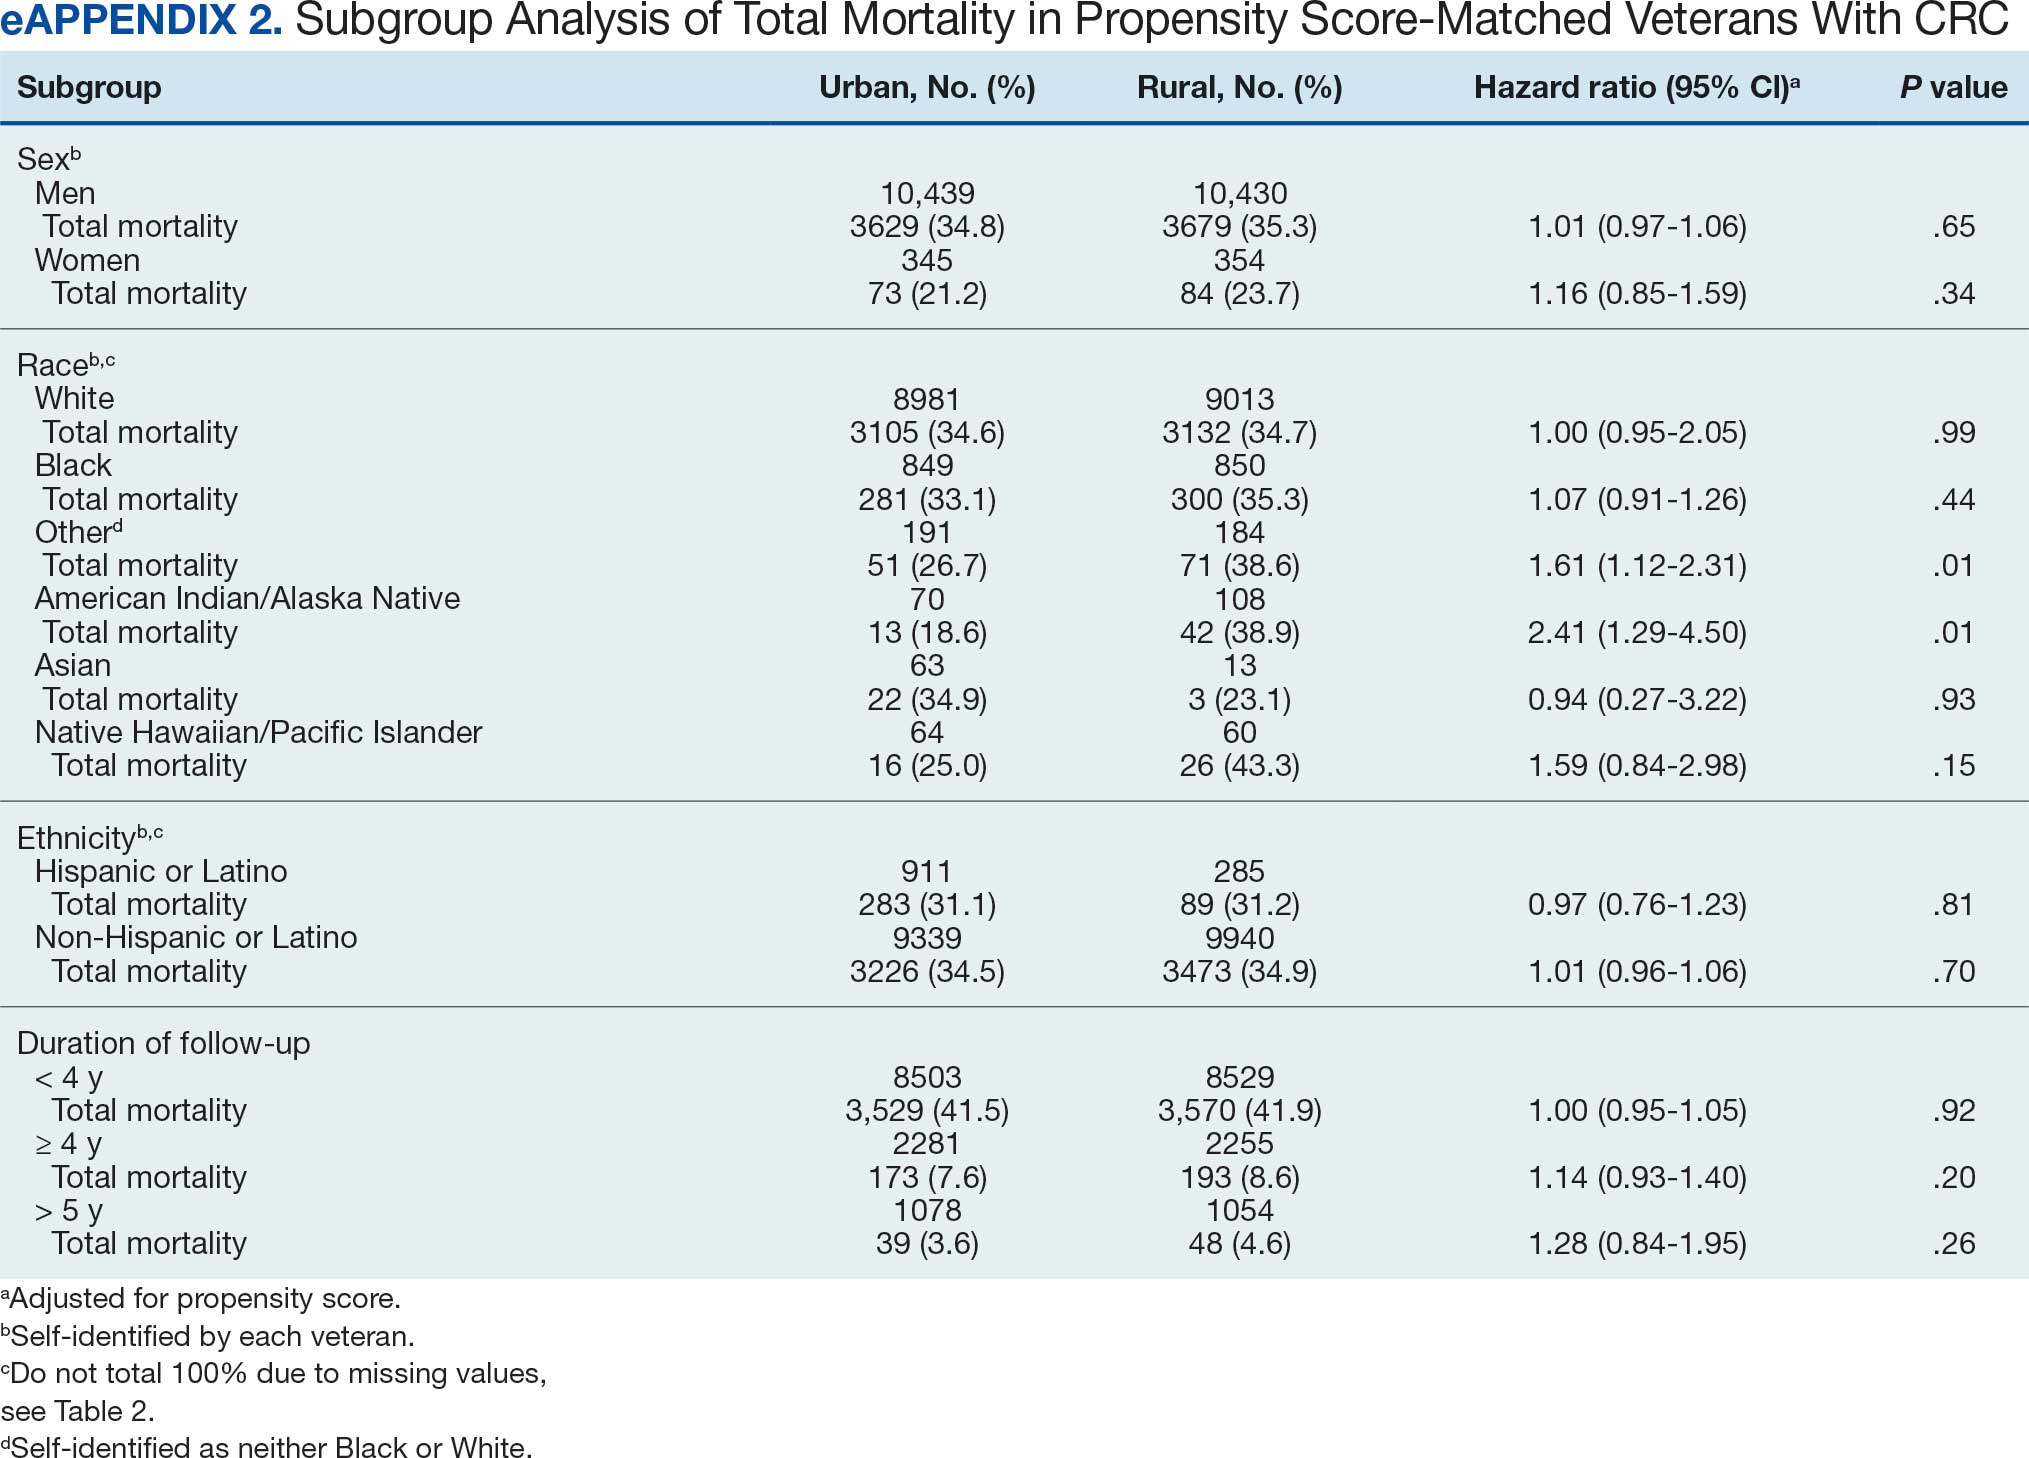
There was no difference in total mortality between rural and urban veterans in any subgroup except for American Indian or Alaska Native veterans (HR, 2.41; 95% CI, 1.29-4.50; P = .006) (eAppendix 2).
Discussion
This study examined characteristics of patients with CRC between urban and rural areas among veterans who were VHA patients. Similar to other studies, rural veterans with CRC were older, more likely to be White, and were obese, but exhibited fewer comorbidities (lower CCI and lower incidence of congestive heart failure, dementia, hemiplegia, kidney diseases, liver diseases and AIDS, but higher incidence of chronic obstructive lung disease).8,16 The incidence of CRC in this study population was lowest in FY 2020, which was reported by the Centers for Disease Control and Prevention and is attributed to COVID-19 pandemic disruption of health services.24 The overall mortality in this study was similar to rates reported in other studies from the VA Central Cancer Registry.4 In the PS-matched cohort, where baseline characteristics were similar between urban and rural patients with CRC, we found no disparities in CRC-specific mortality between veterans in rural and urban areas. Additionally, when analysis was restricted to veterans aged ≤ 45 years, the results remained consistent.
Subgroup analyses showed no significant difference in mortality between rural and urban areas by sex, race or ethnicity, except rural American Indian or Alaska Native veterans who had double the mortality of their urban counterparts (HR, 2.41; 95% CI, 1.29-4.50; P = .006). This finding is difficult to interpret due to the small number of events and the wide CI. While with a Bonferroni correction the adjusted P value was .08, which is not statistically significant, a previous study found that although CRC incidence was lower overall in American Indian or Alaska Native populations compared to non-Hispanic White populations, CRC incidence was higher among American Indian or Alaska Native individuals in some areas such as Alaska and the Northern Plains.25,26 Studies have noted that rural American Indian/Alaska Native populations experience greater poverty, less access to broadband internet, and limited access to care, contributing to poorer cancer outcomes and lower survival.27 Thus, the finding of disparity in mortality between rural and urban American Indian or Alaska Native veterans warrants further study.
Other studies have raised concerns that CRC disproportionately affects adults in rural areas with higher mortality rates.14-16 These disparities arise from sociodemographic factors and modifiable risk factors, including physical activity, dietary patterns, access to cancer screening, and gaps in quality treatment resources.16,28 These factors operate at multiple levels: from individual, local health system, to community and policy.2,27 For example, a South Carolina study (1996–2016) found that residents in rural areas were more likely to be diagnosed with advanced CRC, possibly indicating lower rates of CRC screening in rural areas. They also had higher likelihood of death from CRC.15 However, the study did not include any clinical parameters, such as comorbidities or obesity. A statewide, population-based study in Utah showed that rural men experienced a lower CRC survival in their unadjusted analysis.16 However, the study was small, with only 3948 urban and 712 rural residents. Additionally, there was no difference in total mortality in the whole cohort (HR, 0.96; 95% CI, 0.86-1.07) or in CRC-specific death (HR, 0.93; 95% CI, 0.81-1.08). A nationwide study also showed that CRC mortality rates were 8% higher in nonmetropolitan or rural areas than in the most urbanized areas containing large metropolitan counties.29 However, this study did not include descriptions of clinical confounders, such as comorbidities, making it difficult to ascertain whether the difference in CRC mortality was due to rurality or differences in baseline risk characteristics.
In this study, the lack of CRC-specific mortality disparities may be attributed to the structures and practices of VHA health care. Recent studies have noted that mortality of several chronic medical conditions treated at the VHA was lower than at non-VHA hospitals.30,31 One study that measured the quality of nonmetastatic CRC care based on National Comprehensive Cancer Network guidelines showed that > 72% of VHA patients received guideline-concordant care for each diagnostic and therapeutic measure, except for follow-up colonoscopy timing, which appear to be similar or superior to that of the private sector.30,32,33 Some of the VA initiative for CRC screening may bypass the urban-rurality divide such as the mailed fecal immunochemical test program for CRC. This program was implemented at the onset of the COVID-19 pandemic to avoid disruptions of medical care.34 Rural patients are more likely to undergo fecal immunochemical testing when compared to urban patients in this data. Beyond clinical care, the VHA uses processes to tackle social determinants of health such as housing, food security, and transportation, promoting equal access to health care, and promoting cultural competency among HCPs.35-37
The results suggest that solutions to CRC disparities between rural and urban areas need to consider known barriers to rural health care, including transportation, diminished rural health care workforce, and other social determinants of health.9,10,27,38 VHA makes considerable efforts to provide equitable care to all enrolled veterans, including specific programs for rural veterans, including ongoing outreach.39 This study demonstrated lack of disparity in CRC-specific mortality in veterans receiving VHA care, highlighting the importance of these efforts.
Strengths and Limitations
This study used the VHA cohort to compare patient characteristics and mortality between patients with CRC residing in rural and urban areas. The study provides nationwide perspectives on CRC across the geographical spectrum and used a longitudinal cohort with prolonged follow-up to account for comorbidities.
However, the study compared a cohort of rural and urban veterans enrolled in the VHA; hence, the results may not reflect CRC outcomes in veterans without access to VHA care. Rurality has been independently associated with decreased likelihood of meeting CRC screening guidelines among veterans and military service members.38 This study lacked sufficient information to compare CRC staging or treatment modalities among veterans. Although the data cannot identify CRC stage, the proportions of patients with metastatic CRC at diagnosis and CRC location were similar between groups. The study did not have information on their care outside of VHA setting.
This study could not ascertain whether disparities existed in CRC treatment modality since rural residence may result in referral to community-based CRC care, which did not appear in the data. To address these limitations, we used death from any cause as the primary outcome, since death is a hard outcome and is not subject to ascertainment bias. The relatively short follow-up time is another limitation, though subgroup analysis by follow-up did not show significant differences. Despite PS matching, residual unmeasured confounding may exist between urban and rural groups. The predominantly White, male VHA population with high CCI may limit the generalizability of the results.
Conclusions
Rural VHA enrollees had similar survival rates after CRC diagnosis compared to their urban counterparts in a PS-matched analysis. The VHA models of care—including mailed CRC screening tools, several socioeconomic determinants of health (housing, food security, and transportation), and promoting equal access to health care, as well as cultural competency among HCPs—HCPs—may help alleviate disparities across the rural-urban spectrum. The VHA should continue efforts to enroll veterans and provide comprehensive coordinated care in community partnerships.
- Siegel RL, Wagle NS, Cercek A, Smith RA, Jemal A. Colorectal cancer statistics, 2023. CA Cancer J Clin. 2023;73(3):233-254. doi:10.3322/caac.21772
- Carethers JM, Doubeni CA. Causes of socioeconomic disparities in colorectal cancer and intervention framework and strategies. Gastroenterology. 2020;158(2):354-367. doi:10.1053/j.gastro.2019.10.029
- Murphy G, Devesa SS, Cross AJ, Inskip PD, McGlynn KA, Cook MB. Sex disparities in colorectal cancer incidence by anatomic subsite, race and age. Int J Cancer. 2011;128(7):1668-75. doi:10.1002/ijc.25481
- Zullig LL, Smith VA, Jackson GL, et al. Colorectal cancer statistics from the Veterans Affairs central cancer registry. Clin Colorectal Cancer. 2016;15(4):e199-e204. doi:10.1016/j.clcc.2016.04.005
- Lin JS, Perdue LA, Henrikson NB, Bean SI, Blasi PR. Screening for Colorectal Cancer: An Evidence Update for the US Preventive Services Task Force. 2021. U.S. Preventive Services Task Force Evidence Syntheses, formerly Systematic Evidence Reviews:Chapter 1. Agency for Healthcare Research and Quality (US); 2021. Accessed February 18, 2025. https://www.ncbi.nlm.nih.gov/books/NBK570917/
- Siegel RL, Fedewa SA, Anderson WF, et al. Colorectal cancer incidence patterns in the United States, 1974-2013. J Natl Cancer Inst. 2017;109(8). doi:10.1093/jnci/djw322
- Davidson KW, Barry MJ, Mangione CM, et al. Screening for colorectal cancer: US Preventive Services Task Force recommendation statement. JAMA. 2021;325(19):1965-1977. doi:10.1001/jama.2021.6238
- Hines R, Markossian T, Johnson A, Dong F, Bayakly R. Geographic residency status and census tract socioeconomic status as determinants of colorectal cancer outcomes. Am J Public Health. 2014;104(3):e63-e71. doi:10.2105/AJPH.2013.301572
- Cauwels J. The many barriers to high-quality rural health care. 2022;(9):1-32. NEJM Catal Innov Care Deliv. Accessed April 24, 2025. https://catalyst.nejm.org/doi/pdf/10.1056/CAT.22.0254
- Gong G, Phillips SG, Hudson C, Curti D, Philips BU. Higher US rural mortality rates linked to socioeconomic status, physician shortages, and lack of health insurance. Health Aff (Millwood);38(12):2003-2010. doi:10.1377/hlthaff.2019.00722
- Aboagye JK, Kaiser HE, Hayanga AJ. Rural-urban differences in access to specialist providers of colorectal cancer care in the United States: a physician workforce issue. JAMA Surg. 2014;149(6):537-543. doi:10.1001/jamasurg.2013.5062
- Lyckholm LJ, Hackney MH, Smith TJ. Ethics of rural health care. Crit Rev Oncol Hematol. 2001;40(2):131-138. doi:10.1016/s1040-8428(01)00139-1
- Krieger N, Williams DR, Moss NE. Measuring social class in US public health research: concepts, methodologies, and guidelines. Annu Rev Public Health. 1997;18:341-378. doi:10.1146/annurev.publhealth.18.1.341
- Singh GK, Jemal A. Socioeconomic and racial/ethnic disparities in cancer mortality, incidence, and survival in the United States, 1950-2014: over six decades of changing patterns and widening inequalities. J Environ Public Health. 2017;2017:2819372. doi:10.1155/2017/2819372
- Adams SA, Zahnd WE, Ranganathan R, et al. Rural and racial disparities in colorectal cancer incidence and mortality in South Carolina, 1996 - 2016. J Rural Health. 2022;38(1):34-39. doi:10.1111/jrh.12580
- Rogers CR, Blackburn BE, Huntington M, et al. Rural- urban disparities in colorectal cancer survival and risk among men in Utah: a statewide population-based study. Cancer Causes Control. 2020;31(3):241-253. doi:10.1007/s10552-020-01268-2
- US Department of Veterans Affairs. VA Informatics and Computing Infrastructure (VINCI), VA HSR RES 13-457. https://vincicentral.vinci.med.va.gov [Source not verified]
- US Department of Veterans Affairs Information Resource Center. VIReC Research User Guide: PSSG Geocoded Enrollee Files, 2015 Edition. US Department of Veterans Affairs, Health Services Research & Development Service, Information Resource Center; May. 2016. [source not verified]
- Goldsmith HF, Puskin DS, Stiles DJ. Improving the operational definition of “rural areas” for federal programs. US Department of Health and Human Services; 1993. Accessed February 27, 2025. https://www.ruralhealthinfo.org/pdf/improving-the-operational-definition-of-rural-areas.pdf
- Adams MA, Kerr EA, Dominitz JA, et al. Development and validation of a new ICD-10-based screening colonoscopy overuse measure in a large integrated healthcare system: a retrospective observational study. BMJ Qual Saf. 2023;32(7):414-424. doi:10.1136/bmjqs-2021-014236
- Schneeweiss S, Wang PS, Avorn J, Glynn RJ. Improved comorbidity adjustment for predicting mortality in Medicare populations. Health Serv Res. 2003;38(4):1103-1120. doi:10.1111/1475-6773.00165
- Becker S, Ichino A. Estimation of average treatment effects based on propensity scores. The Stata Journal. 2002;2(4):358-377.
- Leuven E, Sianesi B. PSMATCH2: Stata module to perform full Mahalanobis and propensity score matching, common support graphing, and covariate imbalance testing. Statistical software components. Revised February 1, 2018. Accessed February 27, 2025. https://ideas.repec.org/c/boc/bocode/s432001.html.
- US Cancer Statistics Working Group. US cancer statistics data visualizations tool. Centers for Disease Control and Prevention. June 2024. Accessed February 27, 2025. https://www.cdc.gov/cancer/dataviz
- Cao J, Zhang S. Multiple Comparison Procedures. JAMA. 2014;312(5):543-544. doi:10.1001/jama.2014.9440
- Gopalani SV, Janitz AE, Martinez SA, et al. Trends in cancer incidence among American Indians and Alaska Natives and Non-Hispanic Whites in the United States, 1999-2015. Epidemiology. 2020;31(2):205-213. doi:10.1097/EDE.0000000000001140
- Zahnd WE, Murphy C, Knoll M, et al. The intersection of rural residence and minority race/ethnicity in cancer disparities in the United States. Int J Environ Res Public Health. 2021;18(4). doi:10.3390/ijerph18041384
- Blake KD, Moss JL, Gaysynsky A, Srinivasan S, Croyle RT. Making the case for investment in rural cancer control: an analysis of rural cancer incidence, mortality, and funding trends. Cancer Epidemiol Biomarkers Prev. 2017;26(7):992-997. doi:10.1158/1055-9965.EPI-17-0092
- Singh GK, Williams SD, Siahpush M, Mulhollen A. Socioeconomic, rural-urban, and racial inequalities in US cancer mortality: part i-all cancers and lung cancer and part iicolorectal, prostate, breast, and cervical cancers. J Cancer Epidemiol. 2011;2011:107497. doi:10.1155/2011/107497
- Jackson GL, Melton LD, Abbott DH, et al. Quality of nonmetastatic colorectal cancer care in the Department of Veterans Affairs. J Clin Oncol. 2010;28(19):3176-3181. doi:10.1200/JCO.2009.26.7948
- Yoon J, Phibbs CS, Ong MK, et al. Outcomes of veterans treated in Veterans Affairs hospitals vs non-Veterans Affairs hospitals. JAMA Netw Open. 2023;6(12):e2345898. doi:10.1001/jamanetworkopen.2023.45898
- Malin JL, Schneider EC, Epstein AM, Adams J, Emanuel EJ, Kahn KL. Results of the National Initiative for Cancer Care Quality: how can we improve the quality of cancer care in the United States? J Clin Oncol. 2006;24(4):626-634. doi:10.1200/JCO.2005.03.3365
- Levin B, Lieberman DA, McFarland B, et al. Screening and surveillance for the early detection of colorectal cancer and adenomatous polyps, 2008: a joint guideline from the American Cancer Society, the US Multi-Society Task Force on Colorectal Cancer, and the American College of Radiology. Gastroenterology. 2008;134(5):1570-1595. doi:10.1053/j.gastro.2008.02.002
- Deeds SA, Moore CB, Gunnink EJ, et al. Implementation of a mailed faecal immunochemical test programme for colorectal cancer screening among Veterans. BMJ Open Qual. 2022;11(4). doi:10.1136/bmjoq-2022-001927
- Yehia BR, Greenstone CL, Hosenfeld CB, Matthews KL, Zephyrin LC. The role of VA community care in addressing health and health care disparities. Med Care. 2017;55(Suppl 9 suppl 2):S4-S5. doi:10.1097/MLR.0000000000000768
- Wright BN, MacDermid Wadsworth S, Wellnitz A, Eicher- Miller HA. Reaching rural veterans: a new mechanism to connect rural, low-income US Veterans with resources and improve food security. J Public Health (Oxf). 2019;41(4):714-723. doi:10.1093/pubmed/fdy203
- Nelson RE, Byrne TH, Suo Y, et al. Association of temporary financial assistance with housing stability among US veterans in the supportive services for veteran families program. JAMA Netw Open. 2021;4(2):e2037047. doi:10.1001/jamanetworkopen.2020.37047
- McDaniel JT, Albright D, Lee HY, et al. Rural–urban disparities in colorectal cancer screening among military service members and Veterans. J Mil Veteran Fam Health. 2019;5(1):40-48. doi:10.3138/jmvfh.2018-0013
- US Department of Veterans Affairs, Office of Rural Health. The rural veteran outreach toolkit. Updated February 12, 2025. Accessed February 18, 2025. https://www.ruralhealth.va.gov/partners/toolkit.asp
Colorectal cancer (CRC) is the second-leading cause of cancer-related deaths in the United States, with an estimated 52,550 deaths in 2023.1 However, the disease burden varies among different segments of the population.2 While both CRC incidence and mortality have been decreasing due to screening and advances in treatment, there are disparities in incidence and mortality across the sociodemographic spectrum including race, ethnicity, education, and income.1-4 While CRC incidence is decreasing for older adults, it is increasing among those aged < 55 years.5 The incidence of CRC in adults aged 40 to 54 years has increased by 0.5% to 1.3% annually since the mid-1990s.6 The US Preventive Services Task Force now recommends starting CRC screening at age 45 years for asymptomatic adults with average risk.7
Disparities also exist across geographical boundaries and living environment. Rural Americans faces additional challenges in health and lifestyle that can affect CRC outcomes. Compared to their urban counterparts, rural residents are more likely to be older, have lower levels of education, higher levels of poverty, lack health insurance, and less access to health care practitioners (HCPs).8-10 Geographic proximity, defined as travel time or physical distance to a health facility, has been recognized as a predictor of inferior outcomes.11 These aspects of rural living may pose challenges for accessing care for CRC screening and treatment.11-13 National and local studies have shown disparities in CRC screening rates, incidence, and mortality between rural and urban populations.14-16
It is unclear whether rural/urban disparities persist under the Veterans Health Administration (VHA) health care delivery model. This study examined differences in baseline characteristics and mortality between rural and urban veterans newly diagnosed with CRC. We also focused on a subpopulation aged ≤ 45 years.
Methods
This study extracted national data from the US Department of Veterans Affairs (VA) Corporate Data Warehouse (CDW) hosted in the VA Informatics and Computing Infrastructure (VINCI) environment. VINCI is an initiative to improve access to VA data and facilitate the analysis of these data while ensuring veterans’ privacy and data security.17 CDW is the VHA business intelligence information repository, which extracts data from clinical and nonclinical sources following prescribed and validated protocols. Data extracted included demographics, diagnosis, and procedure codes for both inpatient and outpatient encounters, vital signs, and vital status. This study used data previously extracted from a national cohort of veterans that encompassed all patients who received a group of commonly prescribed medications, such as statins, proton pump inhibitors, histamine-2 blockers, acetaminophen-containing products, and hydrocortisone-containing skin applications. This cohort encompassed 8,648,754 veterans, from whom 2,460,727 had encounters during fiscal years (FY) 2016 to 2021 (study period). The cohort was used to ensure that subjects were VHA patients, allowing them to adequately capture their clinical profiles.
Patients were identified as rural or urban based on their residence address at the date of their first diagnosis of CRC. The Geospatial Service Support Center (GSSC) aggregates and updates veterans’ residence address records for all enrolled veterans from the National Change of Address database. The data contain 1 record per enrollee. GSSC Geocoded Enrollee File contains enrollee addresses and their rurality indicators, categorized as urban, rural, or highly rural.18 Rurality is defined by the Rural Urban Commuting Area (RUCA) categories developed by the Department of Agriculture and the Health Resources and Services Administration of the US Department of Health and Human Services.19 Urban areas had RUCA codes of 1.0 to 1.1, and highly rural areas had RUCA scores of 10.0. All other areas were classified as rural. Since the proportion of veterans from highly rural areas was small, we included residents from highly rural areas in the rural residents’ group.
Inclusion and Exclusion Criteria
All veterans newly diagnosed with CRC from FY 2016 to 2021 were included. We used the ninth and tenth clinical modification revisions of the International Classification of Diseases (ICD-9-CM and ICD-10-CM) to define CRC diagnosis (Supplemental materials).4,20 To ensure that patients were newly diagnosed with CRC, this study excluded patients with a previous ICD-9-CM code for CRC diagnosis since FY 2003.
Comorbidities were identified using diagnosis and procedure codes from inpatient and outpatient encounters, which were used to calculate the Charlson Comorbidity Index (CCI) at the time of CRC diagnosis using the weighted method described by Schneeweiss et al.21 We defined CRC high-risk conditions and CRC screening tests, including flexible sigmoidoscopy and stool tests, as described in previous studies (Supplemental materials).20
The main outcome was total mortality. The date of death was extracted from the VHA Death Ascertainment File, which contains mortality data from the Master Person Index file in CDW and the Social Security Administration Death Master File. We used the date of death from any cause, as cause of death was not available.
A propensity score (PS) was created to match rural (including highly rural) and urban residents at a ratio of 1:1. Using a standard procedure described in prior publications, multivariable logistic regression used all baseline characteristics to estimate the PS and perform nearest-number matching without replacement.22,23 A caliper of 0.01 maximized the matched cohort size and achieved balance (Supplemental materials). We then examined the balance of baseline characteristics between PS-matched groups.
Analyses
Cox proportional hazards regression analysis estimated the hazard ratio (HR) of death in rural residents compared to urban residents in the PS-matched cohort. The outcome event was the date of death during the study’s follow-up period (defined as period from first CRC diagnosis to death or study end), with censoring at the study’s end date (September 30, 2021). The proportional hazards assumption was assessed by inspecting the Kaplan-Meier curves. Multiple analyses examined the HR of total mortality in the PS-matched cohort, stratified by sex, race, and ethnicity. We also examined the HR of total mortality stratified by duration of follow-up.
Another PS-matching analysis among veterans aged ≤ 45 years was performed using the same techniques described earlier in this article. We performed a Cox proportional hazards regression analysis to compare mortality in PS-matched urban and rural veterans aged ≤ 45 years. The HR of death in all veterans aged ≤ 45 years (before PS-matching) was estimated using Cox proportional hazard regression analysis, adjusting for PS.
Dichotomous variables were compared using X2 tests and continuous variables were compared using t tests. Baseline characteristics with missing values were converted into categorical variables and the proportion of subjects with missing values was equalized between treatment groups after PS-matching. For subgroup analysis, we examined the HR of total mortality in each subgroup using separate Cox proportional hazards regression models similar to the primary analysis but adjusted for PS. Due to multiple comparisons in the subgroup analysis, the findings should be considered exploratory. Statistical tests were 2-tailed, and significance was defined as P < .05. Data management and statistical analyses were conducted from June 2022 to January 2023 using STATA, Version 17. The VA Orlando Healthcare System Institutional Review Board approved the study and waived requirements for informed consent because only deidentified data were used.
Results
After excluding 49 patients (Supplemental materials, available at doi:10.12788/fp.0560), we identified 30,219 veterans with newly diagnosed CRC between FY 2016 to 2021 (Table 1). Of these, 19,422 (64.3%) resided in urban areas and 10,797 (35.7%) resided in rural areas (Table 2). The mean (SD) duration from the first CRC diagnosis to death or study end was 832 (640) days, and the median (IQR) was 723 (246–1330) days. Overall, incident CRC diagnoses were numerically highest in FY 2016 and lowest in FY 2020 (Figure 1). Patients with CRC in rural areas vs urban areas were significantly older (mean, 71.2 years vs 70.8 years, respectively; P < .001), more likely to be male (96.7% vs 95.7%, respectively; P < .001), more likely to be White (83.6% vs 67.8%, respectively; P < .001) and more likely to be non-Hispanic (92.2% vs 87.5%, respectively; P < .001). In terms of general health, rural veterans with CRC were more likely to be overweight or obese (81.5% rural vs 78.5% urban; P < .001) but had fewer mean comorbidities as measured by CCI (5.66 rural vs 5.90 urban; P < .001). A higher proportion of rural veterans with CRC had received stool-based (fecal occult blood test or fecal immunochemical test) CRC screening tests (61.6% rural vs 57.2% urban; P < .001). Fewer rural patients presented with systemic symptoms or signs within 1 year of CRC diagnosis (54.4% rural vs 57.5% urban, P < .001). Among urban patients with CRC, 6959 (35.8%) deaths were observed, compared with 3766 (34.9%) among rural patients (P = .10).
There were 21,568 PS-matched veterans: 10,784 in each group. In the PS-matched cohort, baseline characteristics were similar between veterans in urban and rural communities, including age, sex, race/ethnicity, body mass index, and comorbidities. Among rural patients with CRC, 3763 deaths (34.9%) were observed compared with 3702 (34.3%) among urban veterans. There was no significant difference in the HR of mortality between rural and urban CRC residents (HR, 1.01; 95% CI, 0.97-1.06; P = .53) (Figure 2).
Among veterans aged ≤ 45 years, 551 were diagnosed with CRC (391 urban and 160 rural). We PS-matched 142 pairs of urban and rural veterans without residual differences in baseline characteristics (eAppendix 1). There was no significant difference in the HR of mortality between rural and urban veterans aged ≤ 45 years (HR, 0.97; 95% CI, 0.57-1.63; P = .90) (Figure 2). Similarly, no difference in mortality was observed adjusting for PS between all rural and urban veterans aged ≤ 45 years (HR, 1.03; 95% CI, 0.67-1.59; P = .88).
There was no difference in total mortality between rural and urban veterans in any subgroup except for American Indian or Alaska Native veterans (HR, 2.41; 95% CI, 1.29-4.50; P = .006) (eAppendix 2).
Discussion
This study examined characteristics of patients with CRC between urban and rural areas among veterans who were VHA patients. Similar to other studies, rural veterans with CRC were older, more likely to be White, and were obese, but exhibited fewer comorbidities (lower CCI and lower incidence of congestive heart failure, dementia, hemiplegia, kidney diseases, liver diseases and AIDS, but higher incidence of chronic obstructive lung disease).8,16 The incidence of CRC in this study population was lowest in FY 2020, which was reported by the Centers for Disease Control and Prevention and is attributed to COVID-19 pandemic disruption of health services.24 The overall mortality in this study was similar to rates reported in other studies from the VA Central Cancer Registry.4 In the PS-matched cohort, where baseline characteristics were similar between urban and rural patients with CRC, we found no disparities in CRC-specific mortality between veterans in rural and urban areas. Additionally, when analysis was restricted to veterans aged ≤ 45 years, the results remained consistent.
Subgroup analyses showed no significant difference in mortality between rural and urban areas by sex, race or ethnicity, except rural American Indian or Alaska Native veterans who had double the mortality of their urban counterparts (HR, 2.41; 95% CI, 1.29-4.50; P = .006). This finding is difficult to interpret due to the small number of events and the wide CI. While with a Bonferroni correction the adjusted P value was .08, which is not statistically significant, a previous study found that although CRC incidence was lower overall in American Indian or Alaska Native populations compared to non-Hispanic White populations, CRC incidence was higher among American Indian or Alaska Native individuals in some areas such as Alaska and the Northern Plains.25,26 Studies have noted that rural American Indian/Alaska Native populations experience greater poverty, less access to broadband internet, and limited access to care, contributing to poorer cancer outcomes and lower survival.27 Thus, the finding of disparity in mortality between rural and urban American Indian or Alaska Native veterans warrants further study.
Other studies have raised concerns that CRC disproportionately affects adults in rural areas with higher mortality rates.14-16 These disparities arise from sociodemographic factors and modifiable risk factors, including physical activity, dietary patterns, access to cancer screening, and gaps in quality treatment resources.16,28 These factors operate at multiple levels: from individual, local health system, to community and policy.2,27 For example, a South Carolina study (1996–2016) found that residents in rural areas were more likely to be diagnosed with advanced CRC, possibly indicating lower rates of CRC screening in rural areas. They also had higher likelihood of death from CRC.15 However, the study did not include any clinical parameters, such as comorbidities or obesity. A statewide, population-based study in Utah showed that rural men experienced a lower CRC survival in their unadjusted analysis.16 However, the study was small, with only 3948 urban and 712 rural residents. Additionally, there was no difference in total mortality in the whole cohort (HR, 0.96; 95% CI, 0.86-1.07) or in CRC-specific death (HR, 0.93; 95% CI, 0.81-1.08). A nationwide study also showed that CRC mortality rates were 8% higher in nonmetropolitan or rural areas than in the most urbanized areas containing large metropolitan counties.29 However, this study did not include descriptions of clinical confounders, such as comorbidities, making it difficult to ascertain whether the difference in CRC mortality was due to rurality or differences in baseline risk characteristics.
In this study, the lack of CRC-specific mortality disparities may be attributed to the structures and practices of VHA health care. Recent studies have noted that mortality of several chronic medical conditions treated at the VHA was lower than at non-VHA hospitals.30,31 One study that measured the quality of nonmetastatic CRC care based on National Comprehensive Cancer Network guidelines showed that > 72% of VHA patients received guideline-concordant care for each diagnostic and therapeutic measure, except for follow-up colonoscopy timing, which appear to be similar or superior to that of the private sector.30,32,33 Some of the VA initiative for CRC screening may bypass the urban-rurality divide such as the mailed fecal immunochemical test program for CRC. This program was implemented at the onset of the COVID-19 pandemic to avoid disruptions of medical care.34 Rural patients are more likely to undergo fecal immunochemical testing when compared to urban patients in this data. Beyond clinical care, the VHA uses processes to tackle social determinants of health such as housing, food security, and transportation, promoting equal access to health care, and promoting cultural competency among HCPs.35-37
The results suggest that solutions to CRC disparities between rural and urban areas need to consider known barriers to rural health care, including transportation, diminished rural health care workforce, and other social determinants of health.9,10,27,38 VHA makes considerable efforts to provide equitable care to all enrolled veterans, including specific programs for rural veterans, including ongoing outreach.39 This study demonstrated lack of disparity in CRC-specific mortality in veterans receiving VHA care, highlighting the importance of these efforts.
Strengths and Limitations
This study used the VHA cohort to compare patient characteristics and mortality between patients with CRC residing in rural and urban areas. The study provides nationwide perspectives on CRC across the geographical spectrum and used a longitudinal cohort with prolonged follow-up to account for comorbidities.
However, the study compared a cohort of rural and urban veterans enrolled in the VHA; hence, the results may not reflect CRC outcomes in veterans without access to VHA care. Rurality has been independently associated with decreased likelihood of meeting CRC screening guidelines among veterans and military service members.38 This study lacked sufficient information to compare CRC staging or treatment modalities among veterans. Although the data cannot identify CRC stage, the proportions of patients with metastatic CRC at diagnosis and CRC location were similar between groups. The study did not have information on their care outside of VHA setting.
This study could not ascertain whether disparities existed in CRC treatment modality since rural residence may result in referral to community-based CRC care, which did not appear in the data. To address these limitations, we used death from any cause as the primary outcome, since death is a hard outcome and is not subject to ascertainment bias. The relatively short follow-up time is another limitation, though subgroup analysis by follow-up did not show significant differences. Despite PS matching, residual unmeasured confounding may exist between urban and rural groups. The predominantly White, male VHA population with high CCI may limit the generalizability of the results.
Conclusions
Rural VHA enrollees had similar survival rates after CRC diagnosis compared to their urban counterparts in a PS-matched analysis. The VHA models of care—including mailed CRC screening tools, several socioeconomic determinants of health (housing, food security, and transportation), and promoting equal access to health care, as well as cultural competency among HCPs—HCPs—may help alleviate disparities across the rural-urban spectrum. The VHA should continue efforts to enroll veterans and provide comprehensive coordinated care in community partnerships.
- Siegel RL, Wagle NS, Cercek A, Smith RA, Jemal A. Colorectal cancer statistics, 2023. CA Cancer J Clin. 2023;73(3):233-254. doi:10.3322/caac.21772
- Carethers JM, Doubeni CA. Causes of socioeconomic disparities in colorectal cancer and intervention framework and strategies. Gastroenterology. 2020;158(2):354-367. doi:10.1053/j.gastro.2019.10.029
- Murphy G, Devesa SS, Cross AJ, Inskip PD, McGlynn KA, Cook MB. Sex disparities in colorectal cancer incidence by anatomic subsite, race and age. Int J Cancer. 2011;128(7):1668-75. doi:10.1002/ijc.25481
- Zullig LL, Smith VA, Jackson GL, et al. Colorectal cancer statistics from the Veterans Affairs central cancer registry. Clin Colorectal Cancer. 2016;15(4):e199-e204. doi:10.1016/j.clcc.2016.04.005
- Lin JS, Perdue LA, Henrikson NB, Bean SI, Blasi PR. Screening for Colorectal Cancer: An Evidence Update for the US Preventive Services Task Force. 2021. U.S. Preventive Services Task Force Evidence Syntheses, formerly Systematic Evidence Reviews:Chapter 1. Agency for Healthcare Research and Quality (US); 2021. Accessed February 18, 2025. https://www.ncbi.nlm.nih.gov/books/NBK570917/
- Siegel RL, Fedewa SA, Anderson WF, et al. Colorectal cancer incidence patterns in the United States, 1974-2013. J Natl Cancer Inst. 2017;109(8). doi:10.1093/jnci/djw322
- Davidson KW, Barry MJ, Mangione CM, et al. Screening for colorectal cancer: US Preventive Services Task Force recommendation statement. JAMA. 2021;325(19):1965-1977. doi:10.1001/jama.2021.6238
- Hines R, Markossian T, Johnson A, Dong F, Bayakly R. Geographic residency status and census tract socioeconomic status as determinants of colorectal cancer outcomes. Am J Public Health. 2014;104(3):e63-e71. doi:10.2105/AJPH.2013.301572
- Cauwels J. The many barriers to high-quality rural health care. 2022;(9):1-32. NEJM Catal Innov Care Deliv. Accessed April 24, 2025. https://catalyst.nejm.org/doi/pdf/10.1056/CAT.22.0254
- Gong G, Phillips SG, Hudson C, Curti D, Philips BU. Higher US rural mortality rates linked to socioeconomic status, physician shortages, and lack of health insurance. Health Aff (Millwood);38(12):2003-2010. doi:10.1377/hlthaff.2019.00722
- Aboagye JK, Kaiser HE, Hayanga AJ. Rural-urban differences in access to specialist providers of colorectal cancer care in the United States: a physician workforce issue. JAMA Surg. 2014;149(6):537-543. doi:10.1001/jamasurg.2013.5062
- Lyckholm LJ, Hackney MH, Smith TJ. Ethics of rural health care. Crit Rev Oncol Hematol. 2001;40(2):131-138. doi:10.1016/s1040-8428(01)00139-1
- Krieger N, Williams DR, Moss NE. Measuring social class in US public health research: concepts, methodologies, and guidelines. Annu Rev Public Health. 1997;18:341-378. doi:10.1146/annurev.publhealth.18.1.341
- Singh GK, Jemal A. Socioeconomic and racial/ethnic disparities in cancer mortality, incidence, and survival in the United States, 1950-2014: over six decades of changing patterns and widening inequalities. J Environ Public Health. 2017;2017:2819372. doi:10.1155/2017/2819372
- Adams SA, Zahnd WE, Ranganathan R, et al. Rural and racial disparities in colorectal cancer incidence and mortality in South Carolina, 1996 - 2016. J Rural Health. 2022;38(1):34-39. doi:10.1111/jrh.12580
- Rogers CR, Blackburn BE, Huntington M, et al. Rural- urban disparities in colorectal cancer survival and risk among men in Utah: a statewide population-based study. Cancer Causes Control. 2020;31(3):241-253. doi:10.1007/s10552-020-01268-2
- US Department of Veterans Affairs. VA Informatics and Computing Infrastructure (VINCI), VA HSR RES 13-457. https://vincicentral.vinci.med.va.gov [Source not verified]
- US Department of Veterans Affairs Information Resource Center. VIReC Research User Guide: PSSG Geocoded Enrollee Files, 2015 Edition. US Department of Veterans Affairs, Health Services Research & Development Service, Information Resource Center; May. 2016. [source not verified]
- Goldsmith HF, Puskin DS, Stiles DJ. Improving the operational definition of “rural areas” for federal programs. US Department of Health and Human Services; 1993. Accessed February 27, 2025. https://www.ruralhealthinfo.org/pdf/improving-the-operational-definition-of-rural-areas.pdf
- Adams MA, Kerr EA, Dominitz JA, et al. Development and validation of a new ICD-10-based screening colonoscopy overuse measure in a large integrated healthcare system: a retrospective observational study. BMJ Qual Saf. 2023;32(7):414-424. doi:10.1136/bmjqs-2021-014236
- Schneeweiss S, Wang PS, Avorn J, Glynn RJ. Improved comorbidity adjustment for predicting mortality in Medicare populations. Health Serv Res. 2003;38(4):1103-1120. doi:10.1111/1475-6773.00165
- Becker S, Ichino A. Estimation of average treatment effects based on propensity scores. The Stata Journal. 2002;2(4):358-377.
- Leuven E, Sianesi B. PSMATCH2: Stata module to perform full Mahalanobis and propensity score matching, common support graphing, and covariate imbalance testing. Statistical software components. Revised February 1, 2018. Accessed February 27, 2025. https://ideas.repec.org/c/boc/bocode/s432001.html.
- US Cancer Statistics Working Group. US cancer statistics data visualizations tool. Centers for Disease Control and Prevention. June 2024. Accessed February 27, 2025. https://www.cdc.gov/cancer/dataviz
- Cao J, Zhang S. Multiple Comparison Procedures. JAMA. 2014;312(5):543-544. doi:10.1001/jama.2014.9440
- Gopalani SV, Janitz AE, Martinez SA, et al. Trends in cancer incidence among American Indians and Alaska Natives and Non-Hispanic Whites in the United States, 1999-2015. Epidemiology. 2020;31(2):205-213. doi:10.1097/EDE.0000000000001140
- Zahnd WE, Murphy C, Knoll M, et al. The intersection of rural residence and minority race/ethnicity in cancer disparities in the United States. Int J Environ Res Public Health. 2021;18(4). doi:10.3390/ijerph18041384
- Blake KD, Moss JL, Gaysynsky A, Srinivasan S, Croyle RT. Making the case for investment in rural cancer control: an analysis of rural cancer incidence, mortality, and funding trends. Cancer Epidemiol Biomarkers Prev. 2017;26(7):992-997. doi:10.1158/1055-9965.EPI-17-0092
- Singh GK, Williams SD, Siahpush M, Mulhollen A. Socioeconomic, rural-urban, and racial inequalities in US cancer mortality: part i-all cancers and lung cancer and part iicolorectal, prostate, breast, and cervical cancers. J Cancer Epidemiol. 2011;2011:107497. doi:10.1155/2011/107497
- Jackson GL, Melton LD, Abbott DH, et al. Quality of nonmetastatic colorectal cancer care in the Department of Veterans Affairs. J Clin Oncol. 2010;28(19):3176-3181. doi:10.1200/JCO.2009.26.7948
- Yoon J, Phibbs CS, Ong MK, et al. Outcomes of veterans treated in Veterans Affairs hospitals vs non-Veterans Affairs hospitals. JAMA Netw Open. 2023;6(12):e2345898. doi:10.1001/jamanetworkopen.2023.45898
- Malin JL, Schneider EC, Epstein AM, Adams J, Emanuel EJ, Kahn KL. Results of the National Initiative for Cancer Care Quality: how can we improve the quality of cancer care in the United States? J Clin Oncol. 2006;24(4):626-634. doi:10.1200/JCO.2005.03.3365
- Levin B, Lieberman DA, McFarland B, et al. Screening and surveillance for the early detection of colorectal cancer and adenomatous polyps, 2008: a joint guideline from the American Cancer Society, the US Multi-Society Task Force on Colorectal Cancer, and the American College of Radiology. Gastroenterology. 2008;134(5):1570-1595. doi:10.1053/j.gastro.2008.02.002
- Deeds SA, Moore CB, Gunnink EJ, et al. Implementation of a mailed faecal immunochemical test programme for colorectal cancer screening among Veterans. BMJ Open Qual. 2022;11(4). doi:10.1136/bmjoq-2022-001927
- Yehia BR, Greenstone CL, Hosenfeld CB, Matthews KL, Zephyrin LC. The role of VA community care in addressing health and health care disparities. Med Care. 2017;55(Suppl 9 suppl 2):S4-S5. doi:10.1097/MLR.0000000000000768
- Wright BN, MacDermid Wadsworth S, Wellnitz A, Eicher- Miller HA. Reaching rural veterans: a new mechanism to connect rural, low-income US Veterans with resources and improve food security. J Public Health (Oxf). 2019;41(4):714-723. doi:10.1093/pubmed/fdy203
- Nelson RE, Byrne TH, Suo Y, et al. Association of temporary financial assistance with housing stability among US veterans in the supportive services for veteran families program. JAMA Netw Open. 2021;4(2):e2037047. doi:10.1001/jamanetworkopen.2020.37047
- McDaniel JT, Albright D, Lee HY, et al. Rural–urban disparities in colorectal cancer screening among military service members and Veterans. J Mil Veteran Fam Health. 2019;5(1):40-48. doi:10.3138/jmvfh.2018-0013
- US Department of Veterans Affairs, Office of Rural Health. The rural veteran outreach toolkit. Updated February 12, 2025. Accessed February 18, 2025. https://www.ruralhealth.va.gov/partners/toolkit.asp
Colorectal Cancer Characteristics and Mortality From Propensity Score-Matched Cohorts of Urban and Rural Veterans
Colorectal Cancer Characteristics and Mortality From Propensity Score-Matched Cohorts of Urban and Rural Veterans

Continuous Glucose Monitoring vs Fingerstick Monitoring for Hemoglobin A1c Control in Veterans
In the United States, 1 in 4 veterans lives with type 2 diabetes mellitus (T2DM), double the rate of the general population.1 Medications are important for the treatment of T2DM and preventing complications that may develop if not properly managed. Common classes of medications for diabetes include biguanides, sodiumglucose cotransporter-2 (SGLT-2) inhibitors, glucagon-like peptide-1 (GLP-1) receptor agonists, dipeptidyl peptidase-4 inhibitors, thiazolidinediones, sulfonylureas, and insulin. The selection of treatment depends on patient-specific factors including hemoglobin A1c (HbA1c) goal, potential effects on weight, risk of hypoglycemia, and comorbidities such as atherosclerotic cardiovascular disease, heart failure, or chronic kidney disease.2
HbA1c level reflects the mean blood glucose over the previous 3 months and serves as an indication of diabetes control. In patients with diabetes, it is recommended that HbA1c is checked ≥ 2 times annually for those meeting treatment goals, or more often if the patient needs to adjust medications to reach their HbA1c goal. The goal HbA1c level for most adults with diabetes is < 7%.3 This target can be adjusted based on age, comorbidities, or other patient factors. It is generally recommended that frequent glucose monitoring is not needed for patients with T2DM who are only taking oral agents and/or noninsulin injectables. However, for those on insulin regimens, it is advised to monitor glucose closely, with even more frequent testing for those with an intensive insulin regimen.3
Most patients with diabetes use fingerstick testing to self-monitor their blood glucose. However, continuous glucose monitors (CGMs) are becoming widely available and offer a solution to those who do not have the ability to check their glucose multiple times a day and throughout the night. The American Diabetes Association recommends that the frequency and timing of blood glucose monitoring, or the consideration of CGM use, should be based on the specific needs and goals of each patient.3 Guidelines also encourage those on intensive insulin regimens to check glucose levels when fasting, before and after meals, prior to exercise, and when hypoglycemia or hyperglycemia is suspected. Frequent testing can become a burden for patients, whereas once a CGM sensor is placed, it can be worn for 10 to 14 days. CGMs are also capable of transmitting glucose readings every 1 to 15 minutes to a receiver or mobile phone, allowing for further adaptability to a patient’s lifestyle.3
CGMs work by measuring the interstitial glucose with a small filament sensor and have demonstrated accuracy when compared to blood glucose readings. The ability of a CGM to accurately reflect HbA1c levels is a potential benefit, reducing the need for frequent testing to determine whether patients have achieved glycemic control.4 Another benefit of a CGM is the ease of sharing data; patient accounts can be linked with a health care site, allowing clinicians to access glucose data even if the patient is not able to be seen in clinic. This allows health care practitioners (HCPs) to more efficiently tailor medications and optimize regimens based on patient-specific data that was not available by fingerstick testing alone.
Vigersky and colleagues provided one of the few studies on the long-term effects of CGM in patients managing T2DM through diet and exercise alone, oral medications, or basal insulin and found significant improvement in HbA1c after only 3 months of CGM use.5
An important aspect of CGM use is the ability to alert the patient to low blood glucose readings, which can be dangerous for those unaware of hypoglycemia. Many studies have investigated the association between CGM use and acute metabolic events, demonstrating the potential for CGMs to prevent these emergencies. Karter and colleagues found a reduction in emergency department visits and hospitalizations for hypoglycemia associated with the use of CGMs in patients with type 1 DM (T1DM) and T2DM.6
There have been few studies on the use of CGM in veterans. Langford and colleagues found a reduction of HbA1c among veterans with T2DM using CGMs. However, > 50% of the patients in the study were not receiving insulin therapy, which currently is a US Department of Veterans Affairs (VA) CGM criteria for use.7 While current studies provide evidence that supports improvement in HbA1c levels with the use of CGMs, data are lacking for veterans with T2DM taking insulin. There is also minimal research that indicates which patients should be offered a CGM. The objective of this study was to evaluate glycemic control in veterans with T2DM on insulin using a CGM who were previously monitoring blood glucose with fingerstick testing. Secondary endpoints were explored to identify subgroups that may benefit from a CGM and other potential advantages of CGMs.
Methods
This was a retrospective study of veterans who transitioned from fingerstick testing to CGM for glucose monitoring. Each veteran served as their own control to limit confounding variables when comparing HbA1c levels. Veterans with an active or suspended CGM order were identified by reviewing outpatient prescription data. All data collection and analysis were done within the Veterans Affairs Sioux Falls Health Care System.
The primary objective of this study was to assess glycemic control from the use of a CGM by evaluating the change in HbA1c after transitioning to a CGM compared to the change in HbA1c with standard fingerstick monitoring. Three HbA1c values were collected for each veteran: before starting CGM, at initiation, and following CGM initiation (Figure 1). CGM start date was the date the CGM prescription order was placed. The pre-CGM HbA1c level was ≥ 1 year prior to the CGM start date or the HbA1c closest to 1 year. The start CGM HbA1c level was within 3 months before or 1 month after the CGM start date. The post-CGM HbA1c level was the most recent time of data collection and at least 6 months after CGM initiation. The change in HbA1c from fingerstick glucose monitoring was the difference between the pre-CGM and start CGM values. The change in HbA1c from use of a CGM was the difference between start CGM and post-CGM values, which were compared to determine HbA1c reduction from CGM use.
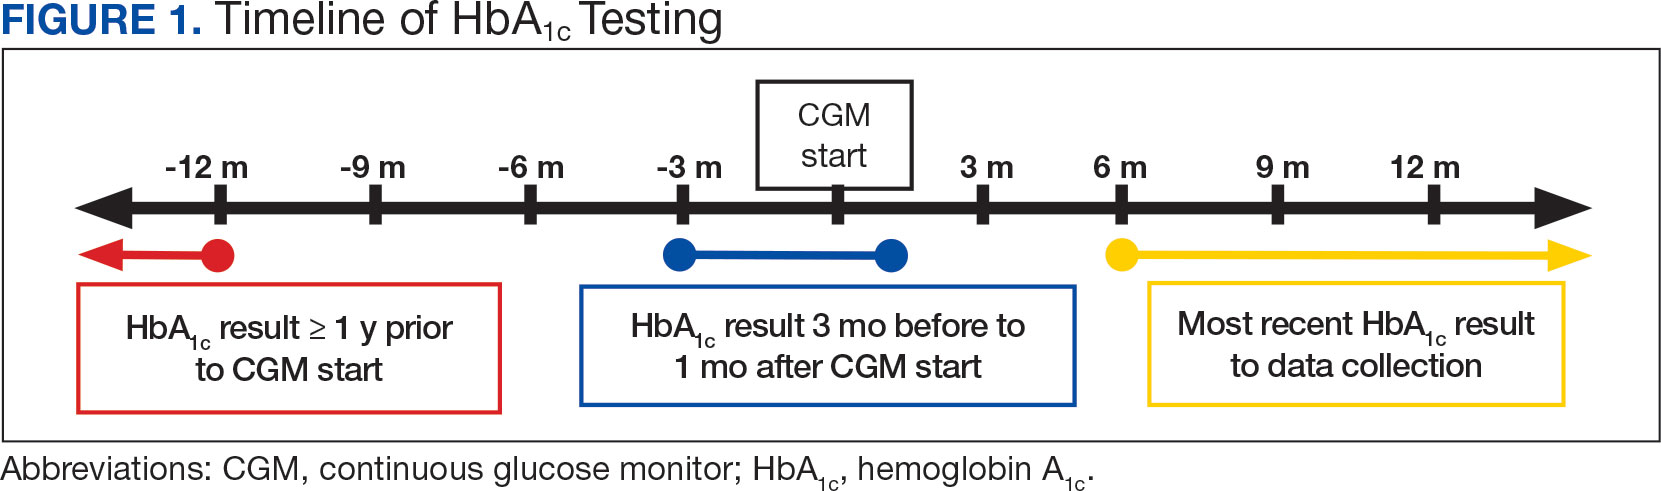
This study also explored secondary outcomes including changes in HbA1c by prescriber type, differences in HbA1c reduction based on age, and changes in diabetes medications, including total daily insulin doses. For secondary outcomes, diabetes medication information and the total daily dose of insulin were gathered at the start of CGM use and at the time of data collection. The most recent CGM order prescribed was also collected.
Veterans were included if they were aged ≥ 18 years, had an active order for a CGM, T2DM diagnosis, an insulin prescription, and previously used test strips for glucose monitoring. Patients with T1DM, those who accessed CGMs or care in the community, and patients without HbA1c values pre-CGM, were excluded.
Statistical Analysis
The primary endpoint of change in HbA1c level before and after CGM use was compared using a paired t test. A 0.5% change in HbA1c was considered clinically significant, as suggested in other studies.8,9 P < .05 was considered statistically significant. Analysis for continuous baseline characteristics, including age and total daily insulin, were reported as mean values. Nominal characteristics including sex, race, diabetes medications, and prescriber type are reported as percentages.
Results
A total of 402 veterans were identified with an active CGM at the time of initial data collection in January 2024 and 175 met inclusion criteria. Sixty patients were excluded due to diabetes managed through a community HCP, 38 had T1DM, and 129 lacked HbA1c within all specified time periods. The 175 veterans were randomized, and 150 were selected to perform a chart review for data collection. The mean age was 70 years, most were male and identified as White (Table 1). The majority of patients were managed by endocrinology (53.3%), followed by primary care (24.0%), and pharmacy (22.7%) (Table 2). The mean baseline HbA1c was 8.6%.
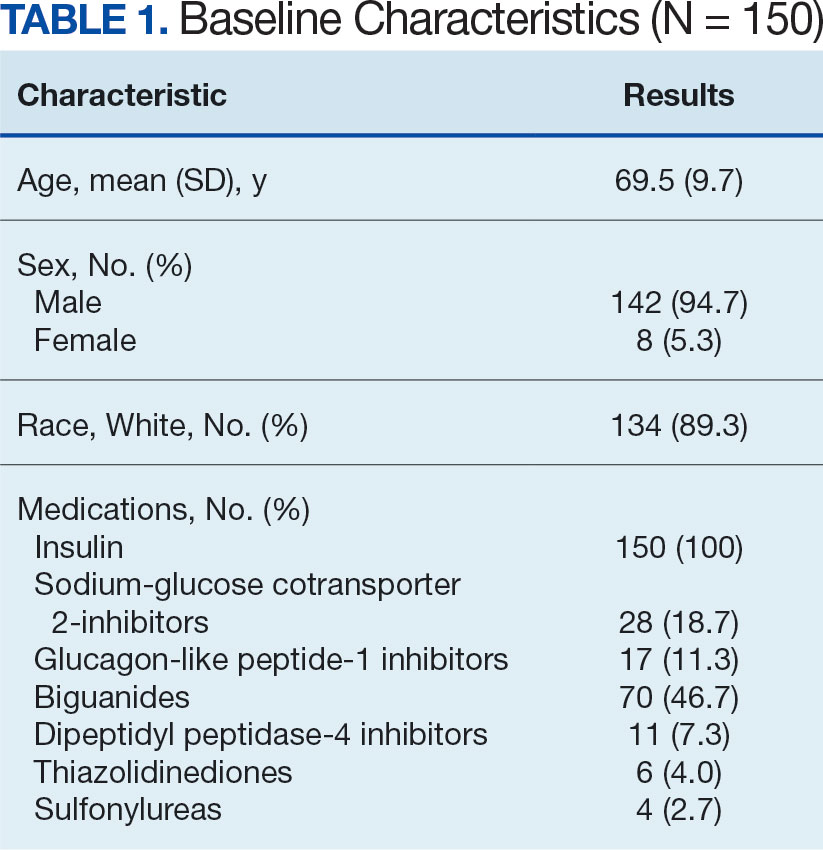
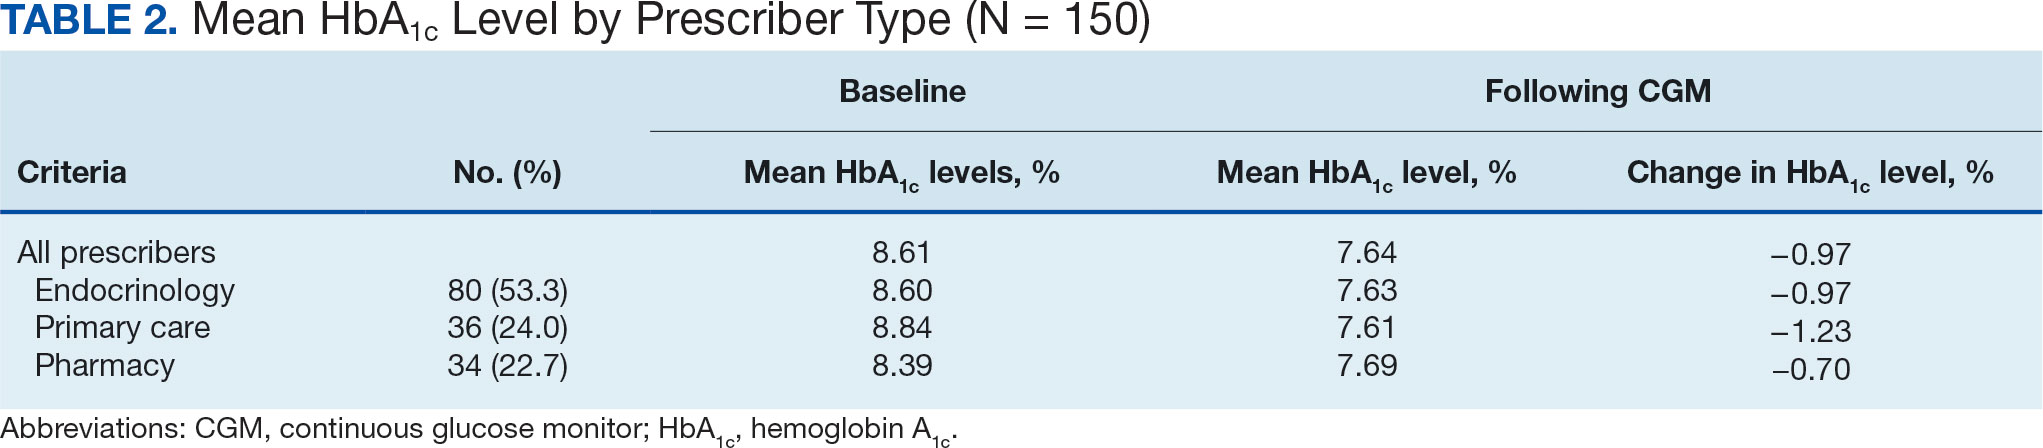
The difference in HbA1c before and after use of CGM was -0.97% (P = .0001). Prior to use of a CGM the change in HbA1c was minimal, with an increase of 0.003% with the use of selfmonitoring glucose. After use of a CGM, HbA1c decreased by 0.971%. This reduction in HbA1c would also be considered clinically significant as the change was > 0.5%. The mean pre-, at start, and post-CGM HbA1c levels were 8.6%, 8.6%, and 7.6%, respectively (Figure 2). Pharmacy prescribers had a 0.7% reduction in HbA1c post-CGM, the least of all prescribers. While most age groups saw a reduction in HbA1c, those aged ≥ 80 years had an increase of 0.18% (Table 3). There was an overall mean reduction in insulin of 22 units, which was similar between all prescribers.
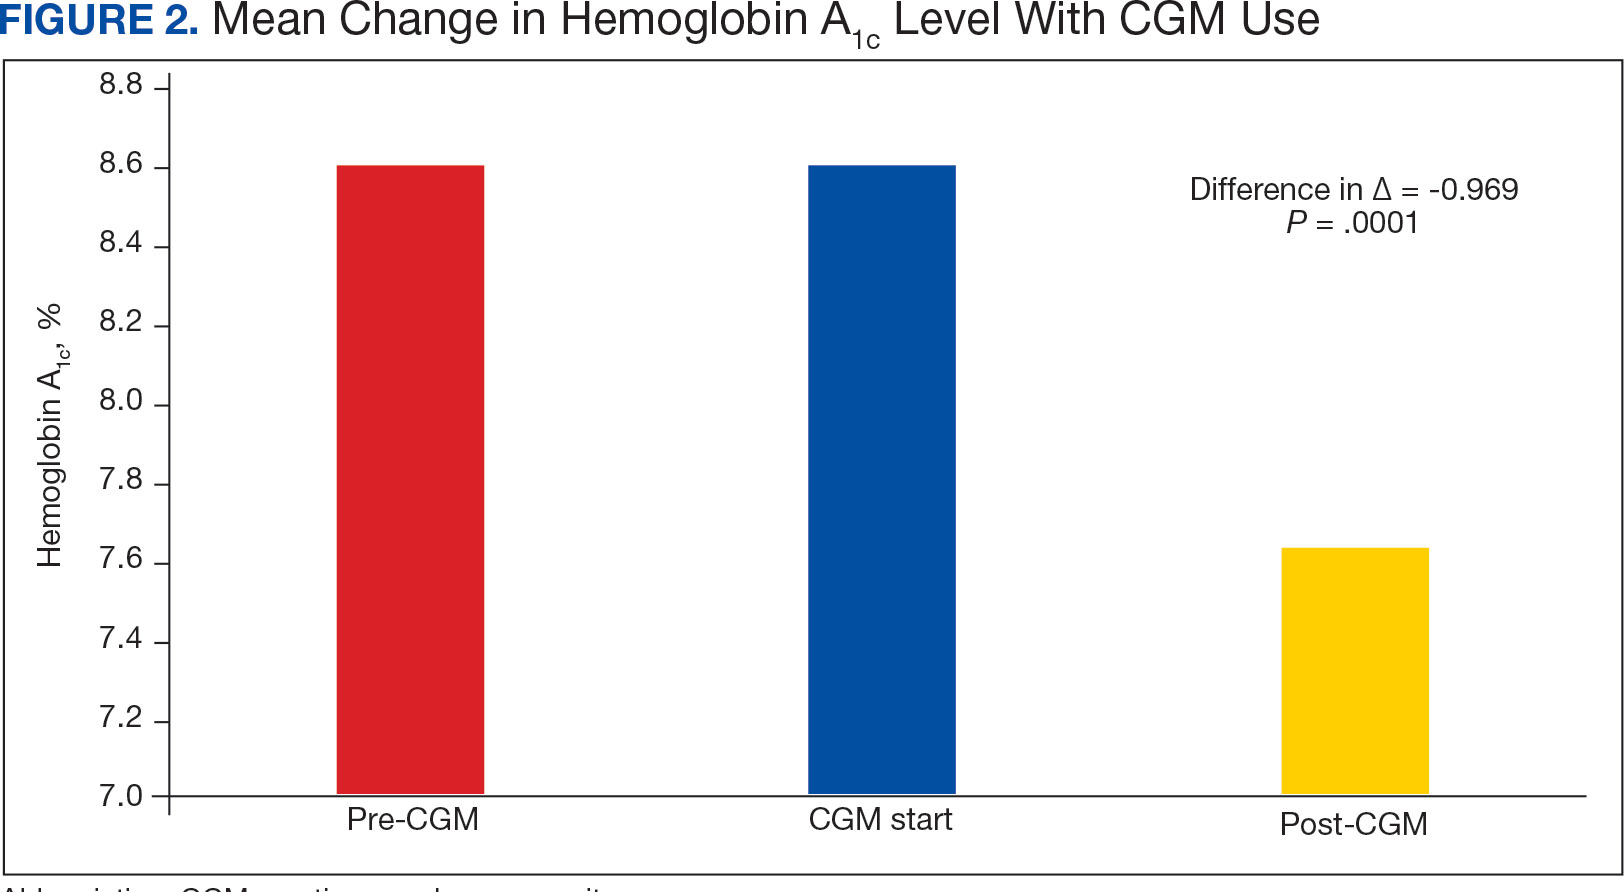
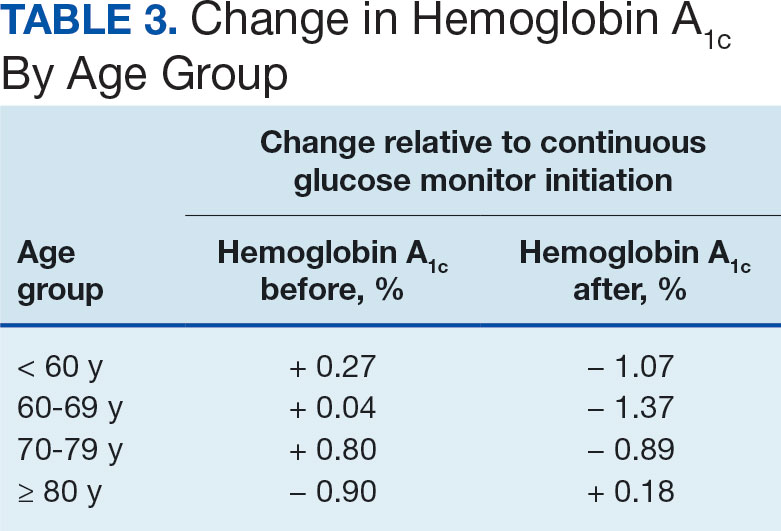
Discussion
The primary endpoint of difference in change of HbA1c before and after CGM use was found to be statistically and clinically significant, with a nearly 1% reduction in HbA1c, which was similar to the reduction found by Vigersky and colleagues. 5 Across all prescribers, post-CGM HbA1c levels were similar; however, patients with CGM prescribed by pharmacists had the smallest change in HbA1c. VA pharmacists primarily assess veterans taking insulin who have HbA1c levels that are below the goal with the aim of decreasing insulin to reduce the risk of hypoglycemia, which could result in increased HbA1c levels. This may also explain the observed increase in post-CGM HbA1c levels in patients aged ≥ 80 years. Patients under the care of pharmacists also had baseline mean HbA1c levels that were lower than primary care and endocrinology prescribers and were closer to their HbA1c goal at baseline, which likely was reflected in the smaller reduction in post-CGM HbA1c level.
While there was a decrease in HbA1c levels with CGM use, there were also changes to medications during this timeframe that also may have impacted HbA1c levels. The most common diabetes medications started during CGM use were GLP-1 agonists and SGLT2-inhibitors. Additionally, there was a reduction in the total daily dose of insulin in the study population. These results demonstrate the potential benefits of CGMs for prescribers who take advantage of the CGM glucose data available to assist with medication adjustments. Another consideration for differences in changes of HbA1c among prescriber types is the opportunity for more frequent follow- up visits with pharmacy or endocrinology compared with primary care. If veterans are followed more closely, it may be associated with improved HbA1c control. Further research investigating changes in HbA1c levels based on followup frequency may be useful.
Strengths and Limitations
The crossover design was a strength of this study. This design reduced confounding variables by having veterans serve as their own controls. In addition, the collection of multiple secondary outcomes adds to the knowledge base for future studies. This study focused on a unique population of veterans with T2DM who were taking insulin, an area that previously had very little data available to determine the benefits of CGM use.
Although the use of a CGM showed statistical significance in lowering HbA1c, many veterans were started on new diabetes medication during the period of CGM use, which also likely contributed to the reduction in HbA1c and may have confounded the results. The study was limited by its small population size due to time constraints of chart reviews and the limited generalizability of results outside of the VA system. The majority of patients were from a single site, male and identified as White, which may not be reflective of other VA and community health care systems. It was also noted that the time from the initiation of CGM use to the most recent HbA1c level varied from 6 months to several years. Additionally, veterans managed by community-based HCPs with complex diabetes cases were excluded.
Conclusions
This study demonstrated a clinically and statistically significant reduction in HbA1c with the use of a CGM compared to fingerstick monitoring in veterans with T2DM who were being treated with insulin. The change in post-CGM HbA1c levels across prescribers was similar. In the subgroup analysis of change in HbA1c among age groups, there was a lower HbA1c reduction in individuals aged ≥ 80 years. The results from this study support the idea that CGM use may be beneficial for patients who require a reduction in HbA1c by allowing more precise adjustments to medications and optimization of therapy, as well as the potential to reduce insulin requirements, which is especially valuable in the older adult veteran population.
- US Department of Veterans Affairs. VA supports veterans who have type 2 diabetes. VA News. Accessed September 30, 2024. https://news.va.gov/107579/va-supports-veterans-who-have-type-2-diabetes/
- ElSayed NA, Aleppo G, Aroda VR, et al. 9. Pharmacologic approaches to glycemic treatment: standards of care in diabetes-2023. Diabetes Care. 2023;46(Suppl 1):S140- S157. doi:10.2337/dc23-S009
- ElSayed NA, Aleppo G, Aroda VR, et al. 6. Glycemic targets: standards of care in diabetes-2023. Diabetes Care. 2023;46(Suppl 1):S97-S110. doi:10.2337/dc23-S006
- Miller E, Gavin JR, Kruger DF, Brunton SA. Continuous glucose monitoring: optimizing diabetes care: executive summary. Clin Diabetes. 2022;40(4):394-398. doi:10.2337/cd22-0043
- Vigersky RA, Fonda SJ, Chellappa M, Walker MS, Ehrhardt NM. Short- and long-term effects of real-time continuous glucose monitoring in patients with type 2 diabetes. Diabetes Care. 2012;35(1):32-38. doi:10.2337/dc11-1438
- Karter AJ, Parker MM, Moffet HH, Gilliam LK, Dlott R. Association of real-time continuous glucose monitoring with glycemic control and acute metabolic events among patients with insulin-treated diabetes. JAMA. 2021;325(22):2273-2284. doi:10.1001/JAMA.2021.6530
- Langford SN, Lane M, Karounos D. Continuous blood glucose monitoring outcomes in veterans with type 2 diabetes. Fed Pract. 2021;38(Suppl 4):S14-S17. doi:10.12788/fp.0189
- Radin MS. Pitfalls in hemoglobin A1c measurement: when results may be misleading. J Gen Intern Med. 2014;29(2):388-394. doi:10.1007/s11606-013-2595-x.
- Little RR, Rohlfing CL, Sacks DB; National Glycohemoglobin Standardization Program (NGSP) steering committee. Status of hemoglobin A1c measurement and goals for improvement: from chaos to order for improving diabetes care. Clin Chem. 2011;57(2):205-214. doi:10.1373/clinchem.2010.148841
In the United States, 1 in 4 veterans lives with type 2 diabetes mellitus (T2DM), double the rate of the general population.1 Medications are important for the treatment of T2DM and preventing complications that may develop if not properly managed. Common classes of medications for diabetes include biguanides, sodiumglucose cotransporter-2 (SGLT-2) inhibitors, glucagon-like peptide-1 (GLP-1) receptor agonists, dipeptidyl peptidase-4 inhibitors, thiazolidinediones, sulfonylureas, and insulin. The selection of treatment depends on patient-specific factors including hemoglobin A1c (HbA1c) goal, potential effects on weight, risk of hypoglycemia, and comorbidities such as atherosclerotic cardiovascular disease, heart failure, or chronic kidney disease.2
HbA1c level reflects the mean blood glucose over the previous 3 months and serves as an indication of diabetes control. In patients with diabetes, it is recommended that HbA1c is checked ≥ 2 times annually for those meeting treatment goals, or more often if the patient needs to adjust medications to reach their HbA1c goal. The goal HbA1c level for most adults with diabetes is < 7%.3 This target can be adjusted based on age, comorbidities, or other patient factors. It is generally recommended that frequent glucose monitoring is not needed for patients with T2DM who are only taking oral agents and/or noninsulin injectables. However, for those on insulin regimens, it is advised to monitor glucose closely, with even more frequent testing for those with an intensive insulin regimen.3
Most patients with diabetes use fingerstick testing to self-monitor their blood glucose. However, continuous glucose monitors (CGMs) are becoming widely available and offer a solution to those who do not have the ability to check their glucose multiple times a day and throughout the night. The American Diabetes Association recommends that the frequency and timing of blood glucose monitoring, or the consideration of CGM use, should be based on the specific needs and goals of each patient.3 Guidelines also encourage those on intensive insulin regimens to check glucose levels when fasting, before and after meals, prior to exercise, and when hypoglycemia or hyperglycemia is suspected. Frequent testing can become a burden for patients, whereas once a CGM sensor is placed, it can be worn for 10 to 14 days. CGMs are also capable of transmitting glucose readings every 1 to 15 minutes to a receiver or mobile phone, allowing for further adaptability to a patient’s lifestyle.3
CGMs work by measuring the interstitial glucose with a small filament sensor and have demonstrated accuracy when compared to blood glucose readings. The ability of a CGM to accurately reflect HbA1c levels is a potential benefit, reducing the need for frequent testing to determine whether patients have achieved glycemic control.4 Another benefit of a CGM is the ease of sharing data; patient accounts can be linked with a health care site, allowing clinicians to access glucose data even if the patient is not able to be seen in clinic. This allows health care practitioners (HCPs) to more efficiently tailor medications and optimize regimens based on patient-specific data that was not available by fingerstick testing alone.
Vigersky and colleagues provided one of the few studies on the long-term effects of CGM in patients managing T2DM through diet and exercise alone, oral medications, or basal insulin and found significant improvement in HbA1c after only 3 months of CGM use.5
An important aspect of CGM use is the ability to alert the patient to low blood glucose readings, which can be dangerous for those unaware of hypoglycemia. Many studies have investigated the association between CGM use and acute metabolic events, demonstrating the potential for CGMs to prevent these emergencies. Karter and colleagues found a reduction in emergency department visits and hospitalizations for hypoglycemia associated with the use of CGMs in patients with type 1 DM (T1DM) and T2DM.6
There have been few studies on the use of CGM in veterans. Langford and colleagues found a reduction of HbA1c among veterans with T2DM using CGMs. However, > 50% of the patients in the study were not receiving insulin therapy, which currently is a US Department of Veterans Affairs (VA) CGM criteria for use.7 While current studies provide evidence that supports improvement in HbA1c levels with the use of CGMs, data are lacking for veterans with T2DM taking insulin. There is also minimal research that indicates which patients should be offered a CGM. The objective of this study was to evaluate glycemic control in veterans with T2DM on insulin using a CGM who were previously monitoring blood glucose with fingerstick testing. Secondary endpoints were explored to identify subgroups that may benefit from a CGM and other potential advantages of CGMs.
Methods
This was a retrospective study of veterans who transitioned from fingerstick testing to CGM for glucose monitoring. Each veteran served as their own control to limit confounding variables when comparing HbA1c levels. Veterans with an active or suspended CGM order were identified by reviewing outpatient prescription data. All data collection and analysis were done within the Veterans Affairs Sioux Falls Health Care System.
The primary objective of this study was to assess glycemic control from the use of a CGM by evaluating the change in HbA1c after transitioning to a CGM compared to the change in HbA1c with standard fingerstick monitoring. Three HbA1c values were collected for each veteran: before starting CGM, at initiation, and following CGM initiation (Figure 1). CGM start date was the date the CGM prescription order was placed. The pre-CGM HbA1c level was ≥ 1 year prior to the CGM start date or the HbA1c closest to 1 year. The start CGM HbA1c level was within 3 months before or 1 month after the CGM start date. The post-CGM HbA1c level was the most recent time of data collection and at least 6 months after CGM initiation. The change in HbA1c from fingerstick glucose monitoring was the difference between the pre-CGM and start CGM values. The change in HbA1c from use of a CGM was the difference between start CGM and post-CGM values, which were compared to determine HbA1c reduction from CGM use.
This study also explored secondary outcomes including changes in HbA1c by prescriber type, differences in HbA1c reduction based on age, and changes in diabetes medications, including total daily insulin doses. For secondary outcomes, diabetes medication information and the total daily dose of insulin were gathered at the start of CGM use and at the time of data collection. The most recent CGM order prescribed was also collected.
Veterans were included if they were aged ≥ 18 years, had an active order for a CGM, T2DM diagnosis, an insulin prescription, and previously used test strips for glucose monitoring. Patients with T1DM, those who accessed CGMs or care in the community, and patients without HbA1c values pre-CGM, were excluded.
Statistical Analysis
The primary endpoint of change in HbA1c level before and after CGM use was compared using a paired t test. A 0.5% change in HbA1c was considered clinically significant, as suggested in other studies.8,9 P < .05 was considered statistically significant. Analysis for continuous baseline characteristics, including age and total daily insulin, were reported as mean values. Nominal characteristics including sex, race, diabetes medications, and prescriber type are reported as percentages.
Results
A total of 402 veterans were identified with an active CGM at the time of initial data collection in January 2024 and 175 met inclusion criteria. Sixty patients were excluded due to diabetes managed through a community HCP, 38 had T1DM, and 129 lacked HbA1c within all specified time periods. The 175 veterans were randomized, and 150 were selected to perform a chart review for data collection. The mean age was 70 years, most were male and identified as White (Table 1). The majority of patients were managed by endocrinology (53.3%), followed by primary care (24.0%), and pharmacy (22.7%) (Table 2). The mean baseline HbA1c was 8.6%.
The difference in HbA1c before and after use of CGM was -0.97% (P = .0001). Prior to use of a CGM the change in HbA1c was minimal, with an increase of 0.003% with the use of selfmonitoring glucose. After use of a CGM, HbA1c decreased by 0.971%. This reduction in HbA1c would also be considered clinically significant as the change was > 0.5%. The mean pre-, at start, and post-CGM HbA1c levels were 8.6%, 8.6%, and 7.6%, respectively (Figure 2). Pharmacy prescribers had a 0.7% reduction in HbA1c post-CGM, the least of all prescribers. While most age groups saw a reduction in HbA1c, those aged ≥ 80 years had an increase of 0.18% (Table 3). There was an overall mean reduction in insulin of 22 units, which was similar between all prescribers.
Discussion
The primary endpoint of difference in change of HbA1c before and after CGM use was found to be statistically and clinically significant, with a nearly 1% reduction in HbA1c, which was similar to the reduction found by Vigersky and colleagues. 5 Across all prescribers, post-CGM HbA1c levels were similar; however, patients with CGM prescribed by pharmacists had the smallest change in HbA1c. VA pharmacists primarily assess veterans taking insulin who have HbA1c levels that are below the goal with the aim of decreasing insulin to reduce the risk of hypoglycemia, which could result in increased HbA1c levels. This may also explain the observed increase in post-CGM HbA1c levels in patients aged ≥ 80 years. Patients under the care of pharmacists also had baseline mean HbA1c levels that were lower than primary care and endocrinology prescribers and were closer to their HbA1c goal at baseline, which likely was reflected in the smaller reduction in post-CGM HbA1c level.
While there was a decrease in HbA1c levels with CGM use, there were also changes to medications during this timeframe that also may have impacted HbA1c levels. The most common diabetes medications started during CGM use were GLP-1 agonists and SGLT2-inhibitors. Additionally, there was a reduction in the total daily dose of insulin in the study population. These results demonstrate the potential benefits of CGMs for prescribers who take advantage of the CGM glucose data available to assist with medication adjustments. Another consideration for differences in changes of HbA1c among prescriber types is the opportunity for more frequent follow- up visits with pharmacy or endocrinology compared with primary care. If veterans are followed more closely, it may be associated with improved HbA1c control. Further research investigating changes in HbA1c levels based on followup frequency may be useful.
Strengths and Limitations
The crossover design was a strength of this study. This design reduced confounding variables by having veterans serve as their own controls. In addition, the collection of multiple secondary outcomes adds to the knowledge base for future studies. This study focused on a unique population of veterans with T2DM who were taking insulin, an area that previously had very little data available to determine the benefits of CGM use.
Although the use of a CGM showed statistical significance in lowering HbA1c, many veterans were started on new diabetes medication during the period of CGM use, which also likely contributed to the reduction in HbA1c and may have confounded the results. The study was limited by its small population size due to time constraints of chart reviews and the limited generalizability of results outside of the VA system. The majority of patients were from a single site, male and identified as White, which may not be reflective of other VA and community health care systems. It was also noted that the time from the initiation of CGM use to the most recent HbA1c level varied from 6 months to several years. Additionally, veterans managed by community-based HCPs with complex diabetes cases were excluded.
Conclusions
This study demonstrated a clinically and statistically significant reduction in HbA1c with the use of a CGM compared to fingerstick monitoring in veterans with T2DM who were being treated with insulin. The change in post-CGM HbA1c levels across prescribers was similar. In the subgroup analysis of change in HbA1c among age groups, there was a lower HbA1c reduction in individuals aged ≥ 80 years. The results from this study support the idea that CGM use may be beneficial for patients who require a reduction in HbA1c by allowing more precise adjustments to medications and optimization of therapy, as well as the potential to reduce insulin requirements, which is especially valuable in the older adult veteran population.
- US Department of Veterans Affairs. VA supports veterans who have type 2 diabetes. VA News. Accessed September 30, 2024. https://news.va.gov/107579/va-supports-veterans-who-have-type-2-diabetes/
- ElSayed NA, Aleppo G, Aroda VR, et al. 9. Pharmacologic approaches to glycemic treatment: standards of care in diabetes-2023. Diabetes Care. 2023;46(Suppl 1):S140- S157. doi:10.2337/dc23-S009
- ElSayed NA, Aleppo G, Aroda VR, et al. 6. Glycemic targets: standards of care in diabetes-2023. Diabetes Care. 2023;46(Suppl 1):S97-S110. doi:10.2337/dc23-S006
- Miller E, Gavin JR, Kruger DF, Brunton SA. Continuous glucose monitoring: optimizing diabetes care: executive summary. Clin Diabetes. 2022;40(4):394-398. doi:10.2337/cd22-0043
- Vigersky RA, Fonda SJ, Chellappa M, Walker MS, Ehrhardt NM. Short- and long-term effects of real-time continuous glucose monitoring in patients with type 2 diabetes. Diabetes Care. 2012;35(1):32-38. doi:10.2337/dc11-1438
- Karter AJ, Parker MM, Moffet HH, Gilliam LK, Dlott R. Association of real-time continuous glucose monitoring with glycemic control and acute metabolic events among patients with insulin-treated diabetes. JAMA. 2021;325(22):2273-2284. doi:10.1001/JAMA.2021.6530
- Langford SN, Lane M, Karounos D. Continuous blood glucose monitoring outcomes in veterans with type 2 diabetes. Fed Pract. 2021;38(Suppl 4):S14-S17. doi:10.12788/fp.0189
- Radin MS. Pitfalls in hemoglobin A1c measurement: when results may be misleading. J Gen Intern Med. 2014;29(2):388-394. doi:10.1007/s11606-013-2595-x.
- Little RR, Rohlfing CL, Sacks DB; National Glycohemoglobin Standardization Program (NGSP) steering committee. Status of hemoglobin A1c measurement and goals for improvement: from chaos to order for improving diabetes care. Clin Chem. 2011;57(2):205-214. doi:10.1373/clinchem.2010.148841

VA Cancer Clinical Trials as a Strategy for Increasing Accrual of Racial and Ethnic Underrepresented Groups
Background
Cancer clinical trials (CCTs) are central to improving cancer care. However, generalizability of findings from CCTs is difficult due to the lack of diversity in most United States CCTs. Clinical trial accrual of underrepresented groups, is low throughout the United States and is approximately 4-5% in most CCTs. Reasons for low accrual in this population are multifactorial. Despite numerous factors related to accruing racial and ethnic underrepresented groups, many institutions have sought to address these barriers. We conducted a scoping review to identify evidence-based approaches to increase participation in cancer treatment clinical trials.
Methods
We reviewed the Salisbury VA Medical Center Oncology clinical trial database from October 2019 to June 2024. The participants in these clinical trials required consent. These clinical trials included treatment interventional as well as non-treatment interventional. Fifteen studies were included and over 260 Veterans participated.
Results
Key themes emerged that included a focus on patient education, cultural competency, and building capacity in the clinics to care for the Veteran population at three separate sites in the Salisbury VA system. The Black Veteran accrual rate of 29% was achieved. This accrual rate is representative of our VA catchment population of 33% for Black Veterans, and is five times the national average.
Conclusions
The research team’s success in enrolling Black Veterans in clinical trials is attributed to several factors. The demographic composition of Veterans served by the Salisbury, Charlotte, and Kernersville VA provided a diverse population that included a 33% Black group. The type of clinical trials focused on patients who were most impacted by the disease. The VA did afford less barriers to access to health care.

Anticoagulation Stewardship Efforts Via Indication Reviews at a Veterans Affairs Health Care System
Anticoagulation Stewardship Efforts Via Indication Reviews at a Veterans Affairs Health Care System
Due to the underlying mechanism of atrial fibrillation (Afib), clots can form within the left atrial appendage. Clots that become dislodged may lead to ischemic stroke and possibly death. The 2023 guidelines for atrial fibrillation from the American College of Cardiology and American Heart Association recommend anticoagulation therapy for patients with an Afib diagnosis and a CHA2DS2-VASc (congestive heart failure, hypertension, age ≥ 75 years, diabetes, stroke/vascular disease, age 65 to 74 years, and female sex) score pertinent for ≥ 1 non–sex-related factor (score ≥ 2 for women; ≥ 1 for men) to prevent stroke-related complications. The CHA2DS2-VASc score is a 9-point scoring tool based on comorbidities and conditions that increase risk of stroke in patients with Afib. Each value correlates to an annualized stroke risk percentage that increases as the score increases.
In clinical practice, patients meeting these thresholds are indicated for anticoagulation and are considered for indefinite use unless ≥ 1 of the following conditions are present: bleeding risk outweighs the stroke prevention benefit, Afib is episodic (< 48 hours) or a nonpharmacologic intervention, such as a left atrial appendage occlusion (LAAO) device is present.1
In patients with a diagnosed venous thromboembolism (VTE), such as deep vein thrombosis or pulmonary embolism, anticoagulation is used to treat the current thrombosis and prevent embolization that can ultimately lead to death. The 2021 guideline for VTE from the American College of Chest Physicians identifies certain risk factors that increase risk for VTE and categorizes them as transient or persistent. Transient risk factors include hospitalization > 3 days, major trauma, surgery, cast immobilization, hormone therapy, pregnancy, or prolonged travel > 8 hours. Persistent risk factors include malignancy, thrombophilia, and certain medications.
The guideline recommends therapy durations based on event frequency, the presence and classification of provoking risk factors, and bleeding risk. As the risk of recurrent thrombosis and other potential complications is greatest in the first 3 to 6 months after a diagnosed event, at least 3 months anticoagulation therapy is recommended following VTE diagnosis. At the 3-month mark, all regimens are suggested to be re-evaluated and considered for extended treatment duration if the event was unprovoked, recurrent, secondary to a persistent risk factor, or low bleed risk.2Anticoagulation is an important guideline-recommended pharmacologic intervention for various disease states, although its use is not without risks. The Institute for Safe Medication Practices has classified oral anticoagulants as high-alert medications. This designation was made because anticoagulant medications have the potential to cause harm when used or omitted in error and lead to life-threatening bleed or thrombotic complications.3Anticoagulation stewardship ensures that anticoagulation therapy is appropriately initiated, maintained, and discontinued when indicated. Because of the potential for harm, anticoagulation stewardship is an important part of Afib and VTE management. Pharmacists can help verify and evaluate anticoagulation therapies. Research suggests that pharmacist-led anticoagulation stewardship efforts may play a role in ensuring safer patient outcomes.4The purpose of this quality improvement (QI) study was to implement pharmacist-led anticoagulation stewardship practices at Veterans Affairs Phoenix Health Care System (VAPHCS) to identify veterans with Afib not currently on anticoagulation, as well as to identify veterans with a history of VTE events who have completed a sufficient treatment duration.
Methods
Anticoagulation stewardship efforts were implemented in 2 cohorts of patients: those with Afib who may be indicated to initiate anticoagulation, and those with a history of VTE events who may be indicated to consider anticoagulation discontinuation. Patient records were reviewed using a standardized note template, and recommendations to either initiate or discontinue anticoagulation therapy were documented. The VAPHCS Research Service reviewed this study and determined that it was not research and was exempt from institutional review board review.
Atrial Fibrillation Cohort
A population health dashboard created by the Stroke Prevention in Atrial Fibrillation/Flutter Targeting the uNTreated: a focus on health care disparities (SPAFF-TNT-D) national VA study team was used to identify veterans at VAPHCS with a diagnosis of Afib without an active VA prescription for an anticoagulant. The dashboard filtered and produced data points from the medical record that correlated to the components of the CHA2DS2-VASc score. All veterans identified by the dashboard with scores of 7 or 8 were included. No patients had a score of 9. Comprehensive chart reviews of available VA and non–VA-provided care records were conducted by the investigators, and a standardized note template designed by the SPAFF-TNT-D team (eAppendix 1) was used to document findings within the electronic health record (EHR). If anticoagulation was deemed to be indicated, the assigned primary care practitioner (PCP) as listed in the EHR was alerted to the note by the investigators for further evaluation and consideration of prescribing anticoagulation.
Venous Thromboembolism Cohort
VAPHCS pharmacy informatics pulled data that included veterans with documented VTE and an active VA anticoagulant prescription between November 2022 and November 2023. Veterans were reviewed in chronological order based on when the anticoagulant prescription was written. All veterans were included until an equal number of charts were reviewed in both the Afib and VTE cohorts. Comprehensive chart review of available VA- and non–VA-provided care records was conducted by the investigators, and a standardized note template as designed by the investigators (eAppendix 2) was used to document findings within the EHR. If the duration of anticoagulation therapy was deemed sufficient, the assigned anticoagulation clinical pharmacist practitioner (CPP) was alerted to the note by the investigators for further evaluation and consideration of discontinuing anticoagulation.
EHR reviews were conducted in October and November 2023 and lasted about 10 to 20 minutes per patient. To evaluate completeness and accuracy of the documented findings within the EHR, both investigators reviewed and cosigned the completed note template and verified the correct PCP was alerted to the recommendation for appropriate continuity of care. Results were reviewed in March 2024.
Outcomes
Atrial fibrillation cohort. The primary outcome was the number of veterans with Afib who were recommended to start anticoagulation therapy. Additional outcomes evaluated included the number of interventions completed, action taken by PCPs in response to the provided recommendation, and reasons provided by the investigators for not recommending initiation of anticoagulation therapy in specific veteran cases.
Venous thromboembolism cohort. The primary outcome was the number of veterans with a history of VTE events recommended to discontinue anticoagulation therapy. Additional outcomes included number of interventions completed, action taken by the anticoagulation CPP in response to the provided recommendation, and reasons provided by the investigators for not recommending discontinuation of anticoagulation therapy in specific veteran cases.
Analysis
Sample size was determined by the inclusion criteria and was not designed to attain statistical power. Data embedded in the Afib cohort standardized note template, also known as health factors, were later used for data analysis. Recommendations in the VTE cohort were manually tracked and recorded by the investigators. Results for this study were analyzed using descriptive statistics.
Results
A total of 114 veterans were reviewed and included in this study: 57 in each cohort. Seven recommendations were made regarding anticoagulation initiation for patients with Afib and 7 were made for anticoagulation discontinuation for patients with VTE (Table 1).
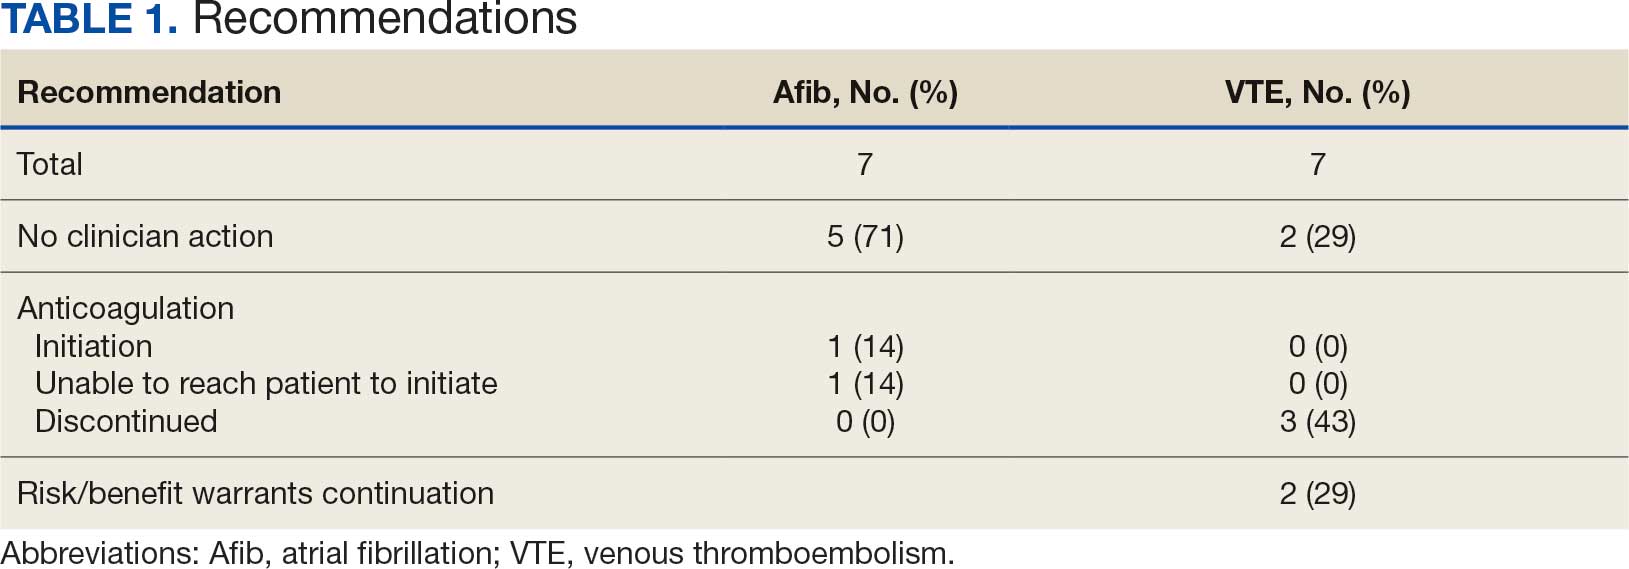
In the Afib cohort, 1 veteran was successfully initiated on anticoagulation therapy and 1 veteran was deemed appropriate for initiation of anticoagulation but was not reachable. Of the 5 recommendations with no action taken, 4 PCPs acknowledged the alert with no further documentation, and 1 PCP deferred the decision to cardiology with no further documentation. In the VTE cohort, 3 veterans successfully discontinued anticoagulation therapy and 2 veterans were further evaluated by the anticoagulation CPP and deemed appropriate to continue therapy based on potential for malignancy. Of the 2 recommendations with no action taken, 1 anticoagulation CPP acknowledged the alert with no further documentation and 1 anticoagulation CPP suggested further evaluation by PCP with no further documentation.
In the Afib cohort, a nonpharmacologic approach was defined as documentation of a LAAO device. An inaccurate diagnosis was defined as an Afib diagnosis being used in a previous visit, although there was no further confirmation of diagnosis via chart review. Veterans classified as already being on anticoagulation had documentation of non–VA-written anticoagulant prescriptions or receiving a supply of anticoagulants from a facility such as a nursing home. Anticoagulation was defined as unfavorable if a documented risk/benefit conversation was found via EHR review. Anticoagulation was defined as not indicated if the Afib was documented as transient, episodic, or historical (Table 2).
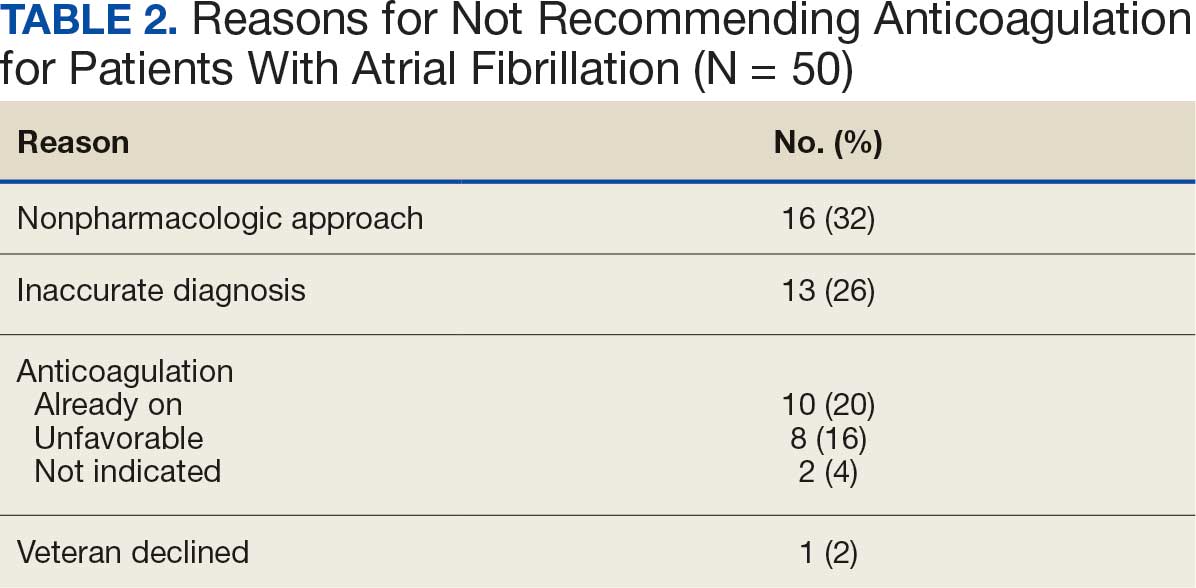
In the VTE cohort, no recommendations for discontinuation were made for veterans indicated to continue anticoagulation due to a concurrent Afib diagnosis. Chronic or recurrent events were defined as documentation of multiple VTE events and associated dates in the EHR. Persistent risk factors included malignancy or medications contributing to hypercoagulable states. Thrombophilia was defined as having documentation of a diagnosis in the EHR. An unprovoked event was defined as VTE without any documented transient risk factors (eg, hospitalization, trauma, surgery, cast immobilization, hormone therapy, pregnancy, or prolonged travel). Anticoagulation had already been discontinued in 1 veteran after the data were collected but before chart review occurred (Table 3).
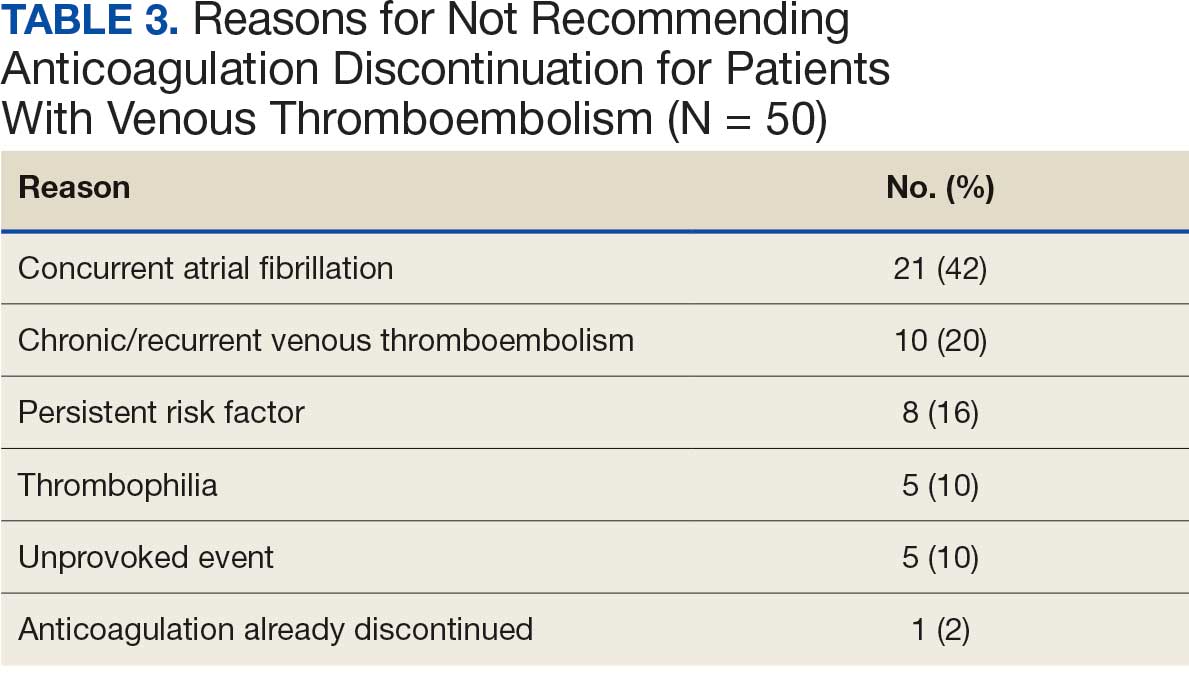
Discussion
Pharmacy-led indication reviews resulted in appropriate recommendations for anticoagulation use in veterans with Afib and a history of VTE events. Overall, 12.3% of chart reviews in each cohort resulted in a recommendation being made, which was similar to the rate found by Koolian et al.5 In that study, 10% of recommendations were related to initiation or interruption of anticoagulation. This recommendation category consisted of several subcategories, including “suggesting therapeutic anticoagulation when none is currently ordered” and “suggesting anticoagulation cessation if no longer indicated,” but specific numerical prevalence was not provided.5
Online dashboard use allowed for greater population health management and identification of veterans with Afib who were not on active anticoagulation, providing opportunities to prevent stroke-related complications. Wang et al completed a similarly designed study that included a population health tool to identify patients with Afib who were not on anticoagulation and implemented pharmacist-led chart review and facilitation of recommendations to the responsible clinician. This study reviewed 1727 patients and recommended initiation of anticoagulation therapy for 75 (4.3%).6 The current study had a higher percentage of patients with recommendations for changes despite its smaller size.
Evaluating the duration of therapy for anticoagulation in veterans with a history of VTE events provided an opportunity to reduce unnecessary exposure to anticoagulation and minimize bleeding risks. Using a chart review process and standardized note template enabled the documentation of pertinent information that could be readily reviewed by the PCP. This process is a step toward ensuring VAPHCS PCPs provide guideline-recommended care and actively prevent stroke and bleeding complications. Adoption of this process into the current VAPHCS Anticoagulation Clinic workflow for review of veterans with either Afib or VTE could lead to more EHRs being reviewed and recommendations made, ultimately improving patient outcomes.
Therapeutic interventions based on the recommendations were completed for 1 of 7 veterans (14%) and 3 of 7 veterans (43%) in the Afib and VTE cohorts, respectively. The prevalence of completed interventions in this anticoagulation stewardship study was higher than those in Wang et al, who found only 9% of their recommendations resulted in PCPs considering action related to anticoagulation, and only 4% were successfully initiated.6
In the Afib cohort, veterans identified by the dashboard with a CHA2DS2-VASc of 7 or 8 were prioritized for review. Reviewing these veterans ensured that patients with the highest stroke risk were sufficiently evaluated and started on anticoagulation as needed to reduce stroke-related complications. In contrast, because these veterans had higher CHA2DS2-VASc scores, they may have already been evaluated for anticoagulation in the past and had a documented rationale for not being placed on anticoagulation (LAAO device placement was the most common rationale). Focusing on veterans with a lower CHA2DS2-VASc score such as 1 for men or 2 for women could potentially include more opportunities for recommendations. Although stroke risk may be lower in this population compared with those with higher CHA2DS2-VASc scores, guideline-recommended anticoagulation use may be missed for these patients.
In the VTE cohort, veterans with an anticoagulant prescription written 12 months before data collection were prioritized for review. Reviewing these veterans ensured that anticoagulation therapy met guideline recommendations of at least 3 months, with potential for extended duration upon further evaluation by a provider at that time. Based on collected results, most veterans were already reevaluated and had documented reasons why anticoagulation was still indicated; concurrent Afib was most common followed by chronic or recurrent VTE. Reviewing veterans with more recent prescriptions just over the recommended 3-month duration could potentially include more opportunities for recommendations to be made. It is more likely that by 3 months another PCP had not already weighed in on the duration of therapy, and the anticoagulation CPP could ensure a thorough review is conducted with guideline-based recommendations.
Most published literature on anticoagulation stewardship efforts is focused on inpatient management and policy changes, or concentrate on attributes of therapy such as appropriate dosing and drug interactions. This study highlighted that gaps in care related to anticoagulation use and discontinuation are present in the VAPHCS population and can be appropriately addressed via pharmacist-led indication reviews. Future studies designed to focus on initiating anticoagulation where appropriate, and discontinuing where a sufficient treatment period has been completed, are warranted to minimize this gap in care and allow health systems to work toward process changes to ensure safe and optimized care is provided for the patients they serve.
Limitations
In the Afib cohort, 5 of 7 recommendations (71%) had no further action taken by the PCP, which may represent a barrier to care. In contrast, 2 of 7 recommendations (29%) had no further action in the VTE cohort. It is possible that the difference can be attributed to the anticoagulation CPP receiving VTE alerts and PCPs receiving Afib alerts. The anticoagulation CPP was familiar with this QI study and may have better understood the purpose of the chart review and the need to provide a timely response. PCPs may have been less likely to take action because they were unfamiliar with the anticoagulation stewardship initiative and standardized note template or overwhelmed by too many EHR alerts.
The lack of PCP response to a virtual alert or message also was observed by Wang et al, whereas Koolian et al reported higher intervention completion rates, with verbal recommendations being made to the responsible clinicians. To further ensure these pertinent recommendations for anticoagulation initiation in veterans with Afib are properly reviewed and evaluated, future research could include intentional follow-up with the PCP regarding the alert, PCP-specific education about the anticoagulation stewardship initiative and the role of the standardized note template, and collaboration with PCPs to identify alternative ways to relay recommendations in a way that would ensure the completion of appropriate and timely review.
Conclusions
This study identified gaps in care related to anticoagulation needs in the VAPHCS veteran population. Utilizing a standardized indication review process allows pharmacists to evaluate anticoagulant use for both appropriate indication and duration of therapy. Providing recommendations via chart review notes and alerting respective PCPs and CPPs results in veterans receiving safe and optimized care regarding their anticoagulation needs.
- Joglar JA, Chung MK, Armbruster AL, et al. 2023 ACC/AHA/ACCP/HRS guideline for the diagnosis and management of atrial fibrillation: a report of the American College of Cardiology/American Heart Association Joint Committee on Clinical Practice Guidelines. Circulation. 2024;149:e1-e156. doi:10.1161/CIR.0000000000001193
- Stevens SM, Woller SC, Kreuziger LB, et al. Antithrombotic therapy for VTE disease: second update of the CHEST guideline and expert panel report. Chest. 2021;160:e545-e608. doi:10.1016/j.chest.2021.07.055
- Institute for Safe Medication Practices (ISMP). List of high-alert medications in community/ambulatory care settings. ISMP. September 30, 2021. Accessed September 11, 2025. https://home.ecri.org/blogs/ismp-resources/high-alert-medications-in-community-ambulatory-care-settings
- Burnett AE, Barnes GD. A call to action for anticoagulation stewardship. Res Pract Thromb Haemost. 2022;6:e12757. doi:10.1002/rth2.12757
- Koolian M, Wiseman D, Mantzanis H, et al. Anticoagulation stewardship: descriptive analysis of a novel approach to appropriate anticoagulant prescription. Res Pract Thromb Haemost. 2022;6:e12758. doi:10.1002/rth2.12758
- Wang SV, Rogers JR, Jin Y, et al. Stepped-wedge randomised trial to evaluate population health intervention designed to increase appropriate anticoagulation in patients with atrial fibrillation. BMJ Qual Saf. 2019;28:835-842. doi:10.1136/bmjqs-2019-009367
Due to the underlying mechanism of atrial fibrillation (Afib), clots can form within the left atrial appendage. Clots that become dislodged may lead to ischemic stroke and possibly death. The 2023 guidelines for atrial fibrillation from the American College of Cardiology and American Heart Association recommend anticoagulation therapy for patients with an Afib diagnosis and a CHA2DS2-VASc (congestive heart failure, hypertension, age ≥ 75 years, diabetes, stroke/vascular disease, age 65 to 74 years, and female sex) score pertinent for ≥ 1 non–sex-related factor (score ≥ 2 for women; ≥ 1 for men) to prevent stroke-related complications. The CHA2DS2-VASc score is a 9-point scoring tool based on comorbidities and conditions that increase risk of stroke in patients with Afib. Each value correlates to an annualized stroke risk percentage that increases as the score increases.
In clinical practice, patients meeting these thresholds are indicated for anticoagulation and are considered for indefinite use unless ≥ 1 of the following conditions are present: bleeding risk outweighs the stroke prevention benefit, Afib is episodic (< 48 hours) or a nonpharmacologic intervention, such as a left atrial appendage occlusion (LAAO) device is present.1
In patients with a diagnosed venous thromboembolism (VTE), such as deep vein thrombosis or pulmonary embolism, anticoagulation is used to treat the current thrombosis and prevent embolization that can ultimately lead to death. The 2021 guideline for VTE from the American College of Chest Physicians identifies certain risk factors that increase risk for VTE and categorizes them as transient or persistent. Transient risk factors include hospitalization > 3 days, major trauma, surgery, cast immobilization, hormone therapy, pregnancy, or prolonged travel > 8 hours. Persistent risk factors include malignancy, thrombophilia, and certain medications.
The guideline recommends therapy durations based on event frequency, the presence and classification of provoking risk factors, and bleeding risk. As the risk of recurrent thrombosis and other potential complications is greatest in the first 3 to 6 months after a diagnosed event, at least 3 months anticoagulation therapy is recommended following VTE diagnosis. At the 3-month mark, all regimens are suggested to be re-evaluated and considered for extended treatment duration if the event was unprovoked, recurrent, secondary to a persistent risk factor, or low bleed risk.2Anticoagulation is an important guideline-recommended pharmacologic intervention for various disease states, although its use is not without risks. The Institute for Safe Medication Practices has classified oral anticoagulants as high-alert medications. This designation was made because anticoagulant medications have the potential to cause harm when used or omitted in error and lead to life-threatening bleed or thrombotic complications.3Anticoagulation stewardship ensures that anticoagulation therapy is appropriately initiated, maintained, and discontinued when indicated. Because of the potential for harm, anticoagulation stewardship is an important part of Afib and VTE management. Pharmacists can help verify and evaluate anticoagulation therapies. Research suggests that pharmacist-led anticoagulation stewardship efforts may play a role in ensuring safer patient outcomes.4The purpose of this quality improvement (QI) study was to implement pharmacist-led anticoagulation stewardship practices at Veterans Affairs Phoenix Health Care System (VAPHCS) to identify veterans with Afib not currently on anticoagulation, as well as to identify veterans with a history of VTE events who have completed a sufficient treatment duration.
Methods
Anticoagulation stewardship efforts were implemented in 2 cohorts of patients: those with Afib who may be indicated to initiate anticoagulation, and those with a history of VTE events who may be indicated to consider anticoagulation discontinuation. Patient records were reviewed using a standardized note template, and recommendations to either initiate or discontinue anticoagulation therapy were documented. The VAPHCS Research Service reviewed this study and determined that it was not research and was exempt from institutional review board review.
Atrial Fibrillation Cohort
A population health dashboard created by the Stroke Prevention in Atrial Fibrillation/Flutter Targeting the uNTreated: a focus on health care disparities (SPAFF-TNT-D) national VA study team was used to identify veterans at VAPHCS with a diagnosis of Afib without an active VA prescription for an anticoagulant. The dashboard filtered and produced data points from the medical record that correlated to the components of the CHA2DS2-VASc score. All veterans identified by the dashboard with scores of 7 or 8 were included. No patients had a score of 9. Comprehensive chart reviews of available VA and non–VA-provided care records were conducted by the investigators, and a standardized note template designed by the SPAFF-TNT-D team (eAppendix 1) was used to document findings within the electronic health record (EHR). If anticoagulation was deemed to be indicated, the assigned primary care practitioner (PCP) as listed in the EHR was alerted to the note by the investigators for further evaluation and consideration of prescribing anticoagulation.
Venous Thromboembolism Cohort
VAPHCS pharmacy informatics pulled data that included veterans with documented VTE and an active VA anticoagulant prescription between November 2022 and November 2023. Veterans were reviewed in chronological order based on when the anticoagulant prescription was written. All veterans were included until an equal number of charts were reviewed in both the Afib and VTE cohorts. Comprehensive chart review of available VA- and non–VA-provided care records was conducted by the investigators, and a standardized note template as designed by the investigators (eAppendix 2) was used to document findings within the EHR. If the duration of anticoagulation therapy was deemed sufficient, the assigned anticoagulation clinical pharmacist practitioner (CPP) was alerted to the note by the investigators for further evaluation and consideration of discontinuing anticoagulation.
EHR reviews were conducted in October and November 2023 and lasted about 10 to 20 minutes per patient. To evaluate completeness and accuracy of the documented findings within the EHR, both investigators reviewed and cosigned the completed note template and verified the correct PCP was alerted to the recommendation for appropriate continuity of care. Results were reviewed in March 2024.
Outcomes
Atrial fibrillation cohort. The primary outcome was the number of veterans with Afib who were recommended to start anticoagulation therapy. Additional outcomes evaluated included the number of interventions completed, action taken by PCPs in response to the provided recommendation, and reasons provided by the investigators for not recommending initiation of anticoagulation therapy in specific veteran cases.
Venous thromboembolism cohort. The primary outcome was the number of veterans with a history of VTE events recommended to discontinue anticoagulation therapy. Additional outcomes included number of interventions completed, action taken by the anticoagulation CPP in response to the provided recommendation, and reasons provided by the investigators for not recommending discontinuation of anticoagulation therapy in specific veteran cases.
Analysis
Sample size was determined by the inclusion criteria and was not designed to attain statistical power. Data embedded in the Afib cohort standardized note template, also known as health factors, were later used for data analysis. Recommendations in the VTE cohort were manually tracked and recorded by the investigators. Results for this study were analyzed using descriptive statistics.
Results
A total of 114 veterans were reviewed and included in this study: 57 in each cohort. Seven recommendations were made regarding anticoagulation initiation for patients with Afib and 7 were made for anticoagulation discontinuation for patients with VTE (Table 1).
In the Afib cohort, 1 veteran was successfully initiated on anticoagulation therapy and 1 veteran was deemed appropriate for initiation of anticoagulation but was not reachable. Of the 5 recommendations with no action taken, 4 PCPs acknowledged the alert with no further documentation, and 1 PCP deferred the decision to cardiology with no further documentation. In the VTE cohort, 3 veterans successfully discontinued anticoagulation therapy and 2 veterans were further evaluated by the anticoagulation CPP and deemed appropriate to continue therapy based on potential for malignancy. Of the 2 recommendations with no action taken, 1 anticoagulation CPP acknowledged the alert with no further documentation and 1 anticoagulation CPP suggested further evaluation by PCP with no further documentation.
In the Afib cohort, a nonpharmacologic approach was defined as documentation of a LAAO device. An inaccurate diagnosis was defined as an Afib diagnosis being used in a previous visit, although there was no further confirmation of diagnosis via chart review. Veterans classified as already being on anticoagulation had documentation of non–VA-written anticoagulant prescriptions or receiving a supply of anticoagulants from a facility such as a nursing home. Anticoagulation was defined as unfavorable if a documented risk/benefit conversation was found via EHR review. Anticoagulation was defined as not indicated if the Afib was documented as transient, episodic, or historical (Table 2).
In the VTE cohort, no recommendations for discontinuation were made for veterans indicated to continue anticoagulation due to a concurrent Afib diagnosis. Chronic or recurrent events were defined as documentation of multiple VTE events and associated dates in the EHR. Persistent risk factors included malignancy or medications contributing to hypercoagulable states. Thrombophilia was defined as having documentation of a diagnosis in the EHR. An unprovoked event was defined as VTE without any documented transient risk factors (eg, hospitalization, trauma, surgery, cast immobilization, hormone therapy, pregnancy, or prolonged travel). Anticoagulation had already been discontinued in 1 veteran after the data were collected but before chart review occurred (Table 3).
Discussion
Pharmacy-led indication reviews resulted in appropriate recommendations for anticoagulation use in veterans with Afib and a history of VTE events. Overall, 12.3% of chart reviews in each cohort resulted in a recommendation being made, which was similar to the rate found by Koolian et al.5 In that study, 10% of recommendations were related to initiation or interruption of anticoagulation. This recommendation category consisted of several subcategories, including “suggesting therapeutic anticoagulation when none is currently ordered” and “suggesting anticoagulation cessation if no longer indicated,” but specific numerical prevalence was not provided.5
Online dashboard use allowed for greater population health management and identification of veterans with Afib who were not on active anticoagulation, providing opportunities to prevent stroke-related complications. Wang et al completed a similarly designed study that included a population health tool to identify patients with Afib who were not on anticoagulation and implemented pharmacist-led chart review and facilitation of recommendations to the responsible clinician. This study reviewed 1727 patients and recommended initiation of anticoagulation therapy for 75 (4.3%).6 The current study had a higher percentage of patients with recommendations for changes despite its smaller size.
Evaluating the duration of therapy for anticoagulation in veterans with a history of VTE events provided an opportunity to reduce unnecessary exposure to anticoagulation and minimize bleeding risks. Using a chart review process and standardized note template enabled the documentation of pertinent information that could be readily reviewed by the PCP. This process is a step toward ensuring VAPHCS PCPs provide guideline-recommended care and actively prevent stroke and bleeding complications. Adoption of this process into the current VAPHCS Anticoagulation Clinic workflow for review of veterans with either Afib or VTE could lead to more EHRs being reviewed and recommendations made, ultimately improving patient outcomes.
Therapeutic interventions based on the recommendations were completed for 1 of 7 veterans (14%) and 3 of 7 veterans (43%) in the Afib and VTE cohorts, respectively. The prevalence of completed interventions in this anticoagulation stewardship study was higher than those in Wang et al, who found only 9% of their recommendations resulted in PCPs considering action related to anticoagulation, and only 4% were successfully initiated.6
In the Afib cohort, veterans identified by the dashboard with a CHA2DS2-VASc of 7 or 8 were prioritized for review. Reviewing these veterans ensured that patients with the highest stroke risk were sufficiently evaluated and started on anticoagulation as needed to reduce stroke-related complications. In contrast, because these veterans had higher CHA2DS2-VASc scores, they may have already been evaluated for anticoagulation in the past and had a documented rationale for not being placed on anticoagulation (LAAO device placement was the most common rationale). Focusing on veterans with a lower CHA2DS2-VASc score such as 1 for men or 2 for women could potentially include more opportunities for recommendations. Although stroke risk may be lower in this population compared with those with higher CHA2DS2-VASc scores, guideline-recommended anticoagulation use may be missed for these patients.
In the VTE cohort, veterans with an anticoagulant prescription written 12 months before data collection were prioritized for review. Reviewing these veterans ensured that anticoagulation therapy met guideline recommendations of at least 3 months, with potential for extended duration upon further evaluation by a provider at that time. Based on collected results, most veterans were already reevaluated and had documented reasons why anticoagulation was still indicated; concurrent Afib was most common followed by chronic or recurrent VTE. Reviewing veterans with more recent prescriptions just over the recommended 3-month duration could potentially include more opportunities for recommendations to be made. It is more likely that by 3 months another PCP had not already weighed in on the duration of therapy, and the anticoagulation CPP could ensure a thorough review is conducted with guideline-based recommendations.
Most published literature on anticoagulation stewardship efforts is focused on inpatient management and policy changes, or concentrate on attributes of therapy such as appropriate dosing and drug interactions. This study highlighted that gaps in care related to anticoagulation use and discontinuation are present in the VAPHCS population and can be appropriately addressed via pharmacist-led indication reviews. Future studies designed to focus on initiating anticoagulation where appropriate, and discontinuing where a sufficient treatment period has been completed, are warranted to minimize this gap in care and allow health systems to work toward process changes to ensure safe and optimized care is provided for the patients they serve.
Limitations
In the Afib cohort, 5 of 7 recommendations (71%) had no further action taken by the PCP, which may represent a barrier to care. In contrast, 2 of 7 recommendations (29%) had no further action in the VTE cohort. It is possible that the difference can be attributed to the anticoagulation CPP receiving VTE alerts and PCPs receiving Afib alerts. The anticoagulation CPP was familiar with this QI study and may have better understood the purpose of the chart review and the need to provide a timely response. PCPs may have been less likely to take action because they were unfamiliar with the anticoagulation stewardship initiative and standardized note template or overwhelmed by too many EHR alerts.
The lack of PCP response to a virtual alert or message also was observed by Wang et al, whereas Koolian et al reported higher intervention completion rates, with verbal recommendations being made to the responsible clinicians. To further ensure these pertinent recommendations for anticoagulation initiation in veterans with Afib are properly reviewed and evaluated, future research could include intentional follow-up with the PCP regarding the alert, PCP-specific education about the anticoagulation stewardship initiative and the role of the standardized note template, and collaboration with PCPs to identify alternative ways to relay recommendations in a way that would ensure the completion of appropriate and timely review.
Conclusions
This study identified gaps in care related to anticoagulation needs in the VAPHCS veteran population. Utilizing a standardized indication review process allows pharmacists to evaluate anticoagulant use for both appropriate indication and duration of therapy. Providing recommendations via chart review notes and alerting respective PCPs and CPPs results in veterans receiving safe and optimized care regarding their anticoagulation needs.
- Joglar JA, Chung MK, Armbruster AL, et al. 2023 ACC/AHA/ACCP/HRS guideline for the diagnosis and management of atrial fibrillation: a report of the American College of Cardiology/American Heart Association Joint Committee on Clinical Practice Guidelines. Circulation. 2024;149:e1-e156. doi:10.1161/CIR.0000000000001193
- Stevens SM, Woller SC, Kreuziger LB, et al. Antithrombotic therapy for VTE disease: second update of the CHEST guideline and expert panel report. Chest. 2021;160:e545-e608. doi:10.1016/j.chest.2021.07.055
- Institute for Safe Medication Practices (ISMP). List of high-alert medications in community/ambulatory care settings. ISMP. September 30, 2021. Accessed September 11, 2025. https://home.ecri.org/blogs/ismp-resources/high-alert-medications-in-community-ambulatory-care-settings
- Burnett AE, Barnes GD. A call to action for anticoagulation stewardship. Res Pract Thromb Haemost. 2022;6:e12757. doi:10.1002/rth2.12757
- Koolian M, Wiseman D, Mantzanis H, et al. Anticoagulation stewardship: descriptive analysis of a novel approach to appropriate anticoagulant prescription. Res Pract Thromb Haemost. 2022;6:e12758. doi:10.1002/rth2.12758
- Wang SV, Rogers JR, Jin Y, et al. Stepped-wedge randomised trial to evaluate population health intervention designed to increase appropriate anticoagulation in patients with atrial fibrillation. BMJ Qual Saf. 2019;28:835-842. doi:10.1136/bmjqs-2019-009367
Anticoagulation Stewardship Efforts Via Indication Reviews at a Veterans Affairs Health Care System
Anticoagulation Stewardship Efforts Via Indication Reviews at a Veterans Affairs Health Care System

The Role of Dermatologists in Developing AI Tools for Diagnosis and Classification of Skin Disease
The Role of Dermatologists in Developing AI Tools for Diagnosis and Classification of Skin Disease
Use of artificial intelligence (AI) in dermatology has increased over the past decade, likely driven by advances in deep learning algorithms, computing hardware, and machine learning.1 Studies comparing the performance of AI algorithms to dermatologists in classifying skin disorders have shown conflicting results.2,3 In this study, we aimed to analyze AI tools used for diagnosing and classifying skin disease and evaluate the role of dermatologists in the creation of AI technology. We also investigated the number of clinical images used in datasets to train AI programs and compared tools that were created with dermatologist input to those created without dermatologist/clinician involvement.
Methods
A search of PubMed articles indexed for MEDLINE using the terms machine learning, artificial intelligence, and dermatology was conducted on September 18, 2022. Articles were included if they described full-length trials; used machine learning for diagnosis of or screening for dermatologic conditions; and used dermoscopic or gross image datasets of the skin, hair, or nails. Articles were categorized into 4 groups based on the conditions covered: chronic wounds, inflammatory skin diseases, mixed conditions, and pigmented skin lesions. Algorithms were sorted into 4 categories: convolutional/convoluted neural network, deep learning model/deep neural network, AI/artificial neural network, and other. Details regarding Fitzpatrick skin type and skin of color (SoC) inclusion in the articles or AI algorithm datasets were recorded. Univariate and multivariate analyses were performed using Microsoft Excel and SAS Studio 3.8. Sensitivity and specificity were calculated for all included AI technology. Sensitivity, specificity, and the number of clinical images were compared among the included articles using analysis of variance and t tests (α=0.05; P<.05 indicated statistical significance).
Results
Our search yielded 1016 articles, 58 of which met the inclusion criteria. Overall, 25.9% (15/58) of the articles utilized AI to diagnose or classify mixed skin diseases; 22.4% (13/58) for pigmented skin lesions; 19.0% (11/58) for wounds; 17.2% (10/58) for inflammatory skin diseases; and 5.2% (3/58) each for acne, psoriasis, and onychomycosis. Overall, 24.0% (14/58) of articles provided information about Fitzpatrick skin type, and 58.7% (34/58) included clinical images depicting SoC. Furthermore, we found that only 20.7% (12/58) of articles on deep learning models included descriptions of patient ethnicity or race in at least 1 dataset, and only 10.3% (6/58) of studies included any information about skin tone in the dataset. Studies with a dermatologist as the last author (most likely to be supervising the project) were more likely to include clinical images depicting SoC than those without (82.6% [19/23] and 16.7% [3/18], respectively [P=.0411]).
The mean (SD) number of clinical images in the study articles was 28,422 (84,050). Thirty-seven (63.8%) of the study articles included gross images, 17 (29.3%) used dermoscopic images, and 4 (6.9%) used both. Twenty-seven (46.6%) articles used convolutional/convoluted neural networks, 15 (25.9%) used deep learning model/deep neural networks, 8 (13.8%) used other algorithms, 6 (10.3%) used AI/artificial neural network, and 2 (3.4%) used fuzzy algorithms. Most studies were conducted in China (29.3% [17/58]), Germany (12.1% [7/58]), India (10.3% [6/58]), multiple nations (10.3% [6/58]), and the United States (10.3% [6/58]). Overall, 82.8% (48/58) of articles included at least 1 dermatologist coauthor. Sensitivity of the AI models was 0.85, and specificity was 0.85. The average percentage of images in the dataset correctly identified by a physician was 76.87% vs 81.62% of images correctly identified by AI. Average agreement between AI and physician assessment was 77.98%, defined as AI and physician both having the same diagnosis.
Articles authored by dermatologists contained more clinical images than those without dermatologists in key authorship roles (P<.0001)(eTable). Psoriasis-related algorithms had the fewest (mean [SD]: 3173 [4203]), and pigmented skin lesions had the most clinical images (mean [SD]: 53,19l [155,579]).
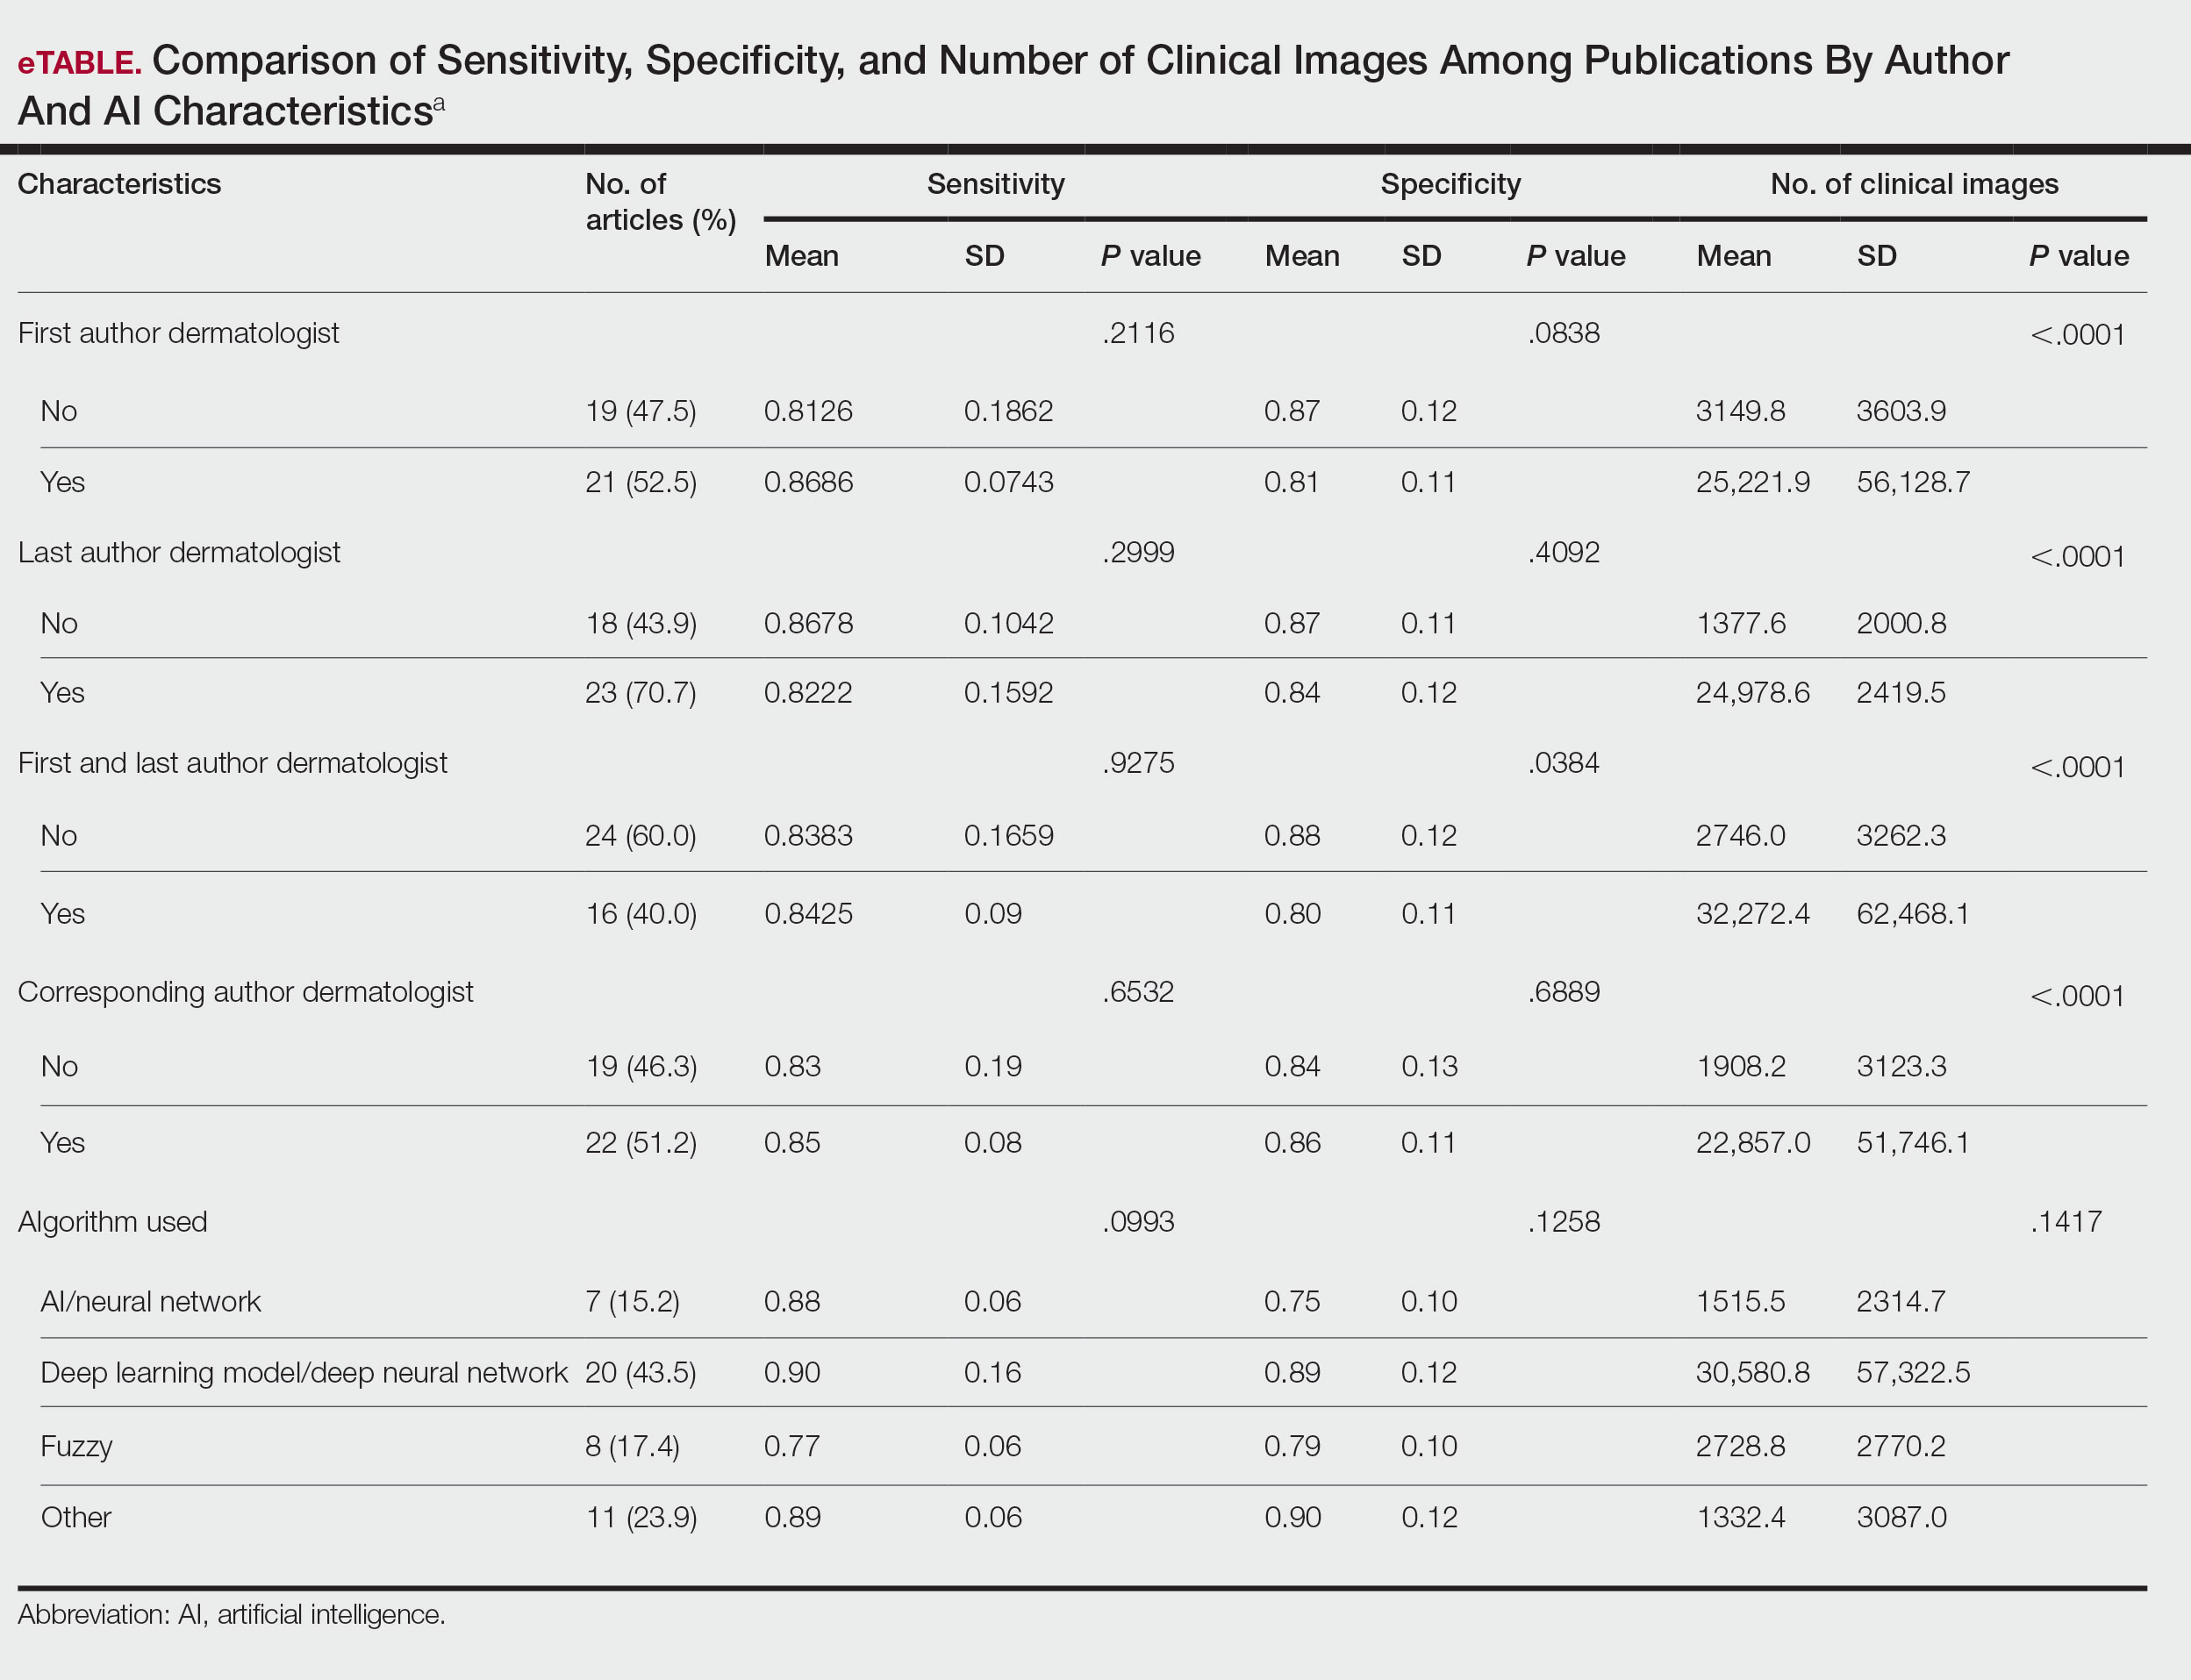
Comment
Our results indicated that AI studies with dermatologist authors had significantly more images in their datasets (ie, the set of clinical images of skin lesions used to train AI algorithms in diagnosing or classifying lesions) than those with nondermatologist authors (P<.0001)(eTable). Similarly, in a study of AI technology for skin cancer diagnosis, AI studies with dermatologist authors (ie, included in the development of the AI algorithm) had more images than studies without dermatologist authors.1 Deep learning textbooks have suggested that 5000 clinical images or training input per output category are needed to produce acceptable algorithm performance, and more than 10 million are needed to produce results superior to human performance.4-10 Despite advances in AI for dermatologic image analysis, the creation of these models often has been directed by nondermatologists1; therefore, dermatologist involvement in AI development is necessary to facilitate collection of larger image datasets and optimal performance for image diagnosis/classification tasks.
We found that 20.7% of articles on deep learning models included descriptions of patient ethnicity or race, and only 10.3% of studies included any information about skin tone in the dataset. Furthermore, American investigators primarily trained models using clinical images of patients with lighter skin tones, whereas Chinese investigators exclusively included images depicting darker skin tones. Similarly, in a study of 52 cutaneous imaging deep learning articles, only 17.3% (9/52) reported race and/or Fitzpatrick skin type, and only 7.7% (4/52) of articles included both.2,6,8 Therefore, dermatologists are needed to contribute images representing diverse populations and collaborate in AI research studies, as their involvement is necessary to ensure the accuracy of AI models in classifying lesions or diagnosing skin lesions across all skin types.
Our search was limited to PubMed, and real-world applications could not be evaluated.
Conclusion
In summary, we found that AI studies with dermatologist authors used larger numbers of clinical images in their datasets and more images representing diverse skin types than studies without. Therefore, we advocate for greater involvement of dermatologists in AI research, which might result in better patient outcomes by improving diagnostic accuracy.
- Zakhem GA, Fakhoury JW, Motosko CC, et al. Characterizing the role of dermatologists in developing artificial intelligence for assessment of skin cancer. J Am Acad Dermatol. 2021;85:1544-1556.
- Daneshjou R, Vodrahalli K, Novoa RA, et al. Disparities in dermatology AI performance on a diverse, curated clinical image set. Sci Adv. 2022;8:eabq6147.
- Wu E, Wu K, Daneshjou R, et al. How medical AI devices are evaluated: limitations and recommendations from an analysis of FDA approvals. Nat Med. 2021;27:582-584.
- Murphree DH, Puri P, Shamim H, et al. Deep learning for dermatologists: part I. Fundamental concepts. J Am Acad Dermatol. 2022;87:1343-1351.
- Goodfellow I, Bengio Y, Courville A. Deep Learning. The MIT Press; 2016.
- Kim YH, Kobic A, Vidal NY. Distribution of race and Fitzpatrick skin types in data sets for deep learning in dermatology: a systematic review. J Am Acad Dermatol. 2022;87:460-461.
- Liu Y, Jain A, Eng C, et al. A deep learning system for differential diagnosis of skin diseases. Nat Med. 2020;26:900-908.
- Zhu CY, Wang YK, Chen HP, et al. A deep learning based framework for diagnosing multiple skin diseases in a clinical environment. Front Med (Lausanne). 2021;8:626369.
- Capurro N, Pastore VP, Touijer L, et al. A deep learning approach to direct immunofluorescence pattern recognition in autoimmune bullous diseases. Br J Dermatol. 2024;191:261-266.
- Han SS, Park I, Eun Chang S, et al. Augmented intelligence dermatology: deep neural networks empower medical professionals in diagnosing skin cancer and predicting treatment options for 134 skin disorders. J Invest Dermatol. 2020;140:1753-1761.
Use of artificial intelligence (AI) in dermatology has increased over the past decade, likely driven by advances in deep learning algorithms, computing hardware, and machine learning.1 Studies comparing the performance of AI algorithms to dermatologists in classifying skin disorders have shown conflicting results.2,3 In this study, we aimed to analyze AI tools used for diagnosing and classifying skin disease and evaluate the role of dermatologists in the creation of AI technology. We also investigated the number of clinical images used in datasets to train AI programs and compared tools that were created with dermatologist input to those created without dermatologist/clinician involvement.
Methods
A search of PubMed articles indexed for MEDLINE using the terms machine learning, artificial intelligence, and dermatology was conducted on September 18, 2022. Articles were included if they described full-length trials; used machine learning for diagnosis of or screening for dermatologic conditions; and used dermoscopic or gross image datasets of the skin, hair, or nails. Articles were categorized into 4 groups based on the conditions covered: chronic wounds, inflammatory skin diseases, mixed conditions, and pigmented skin lesions. Algorithms were sorted into 4 categories: convolutional/convoluted neural network, deep learning model/deep neural network, AI/artificial neural network, and other. Details regarding Fitzpatrick skin type and skin of color (SoC) inclusion in the articles or AI algorithm datasets were recorded. Univariate and multivariate analyses were performed using Microsoft Excel and SAS Studio 3.8. Sensitivity and specificity were calculated for all included AI technology. Sensitivity, specificity, and the number of clinical images were compared among the included articles using analysis of variance and t tests (α=0.05; P<.05 indicated statistical significance).
Results
Our search yielded 1016 articles, 58 of which met the inclusion criteria. Overall, 25.9% (15/58) of the articles utilized AI to diagnose or classify mixed skin diseases; 22.4% (13/58) for pigmented skin lesions; 19.0% (11/58) for wounds; 17.2% (10/58) for inflammatory skin diseases; and 5.2% (3/58) each for acne, psoriasis, and onychomycosis. Overall, 24.0% (14/58) of articles provided information about Fitzpatrick skin type, and 58.7% (34/58) included clinical images depicting SoC. Furthermore, we found that only 20.7% (12/58) of articles on deep learning models included descriptions of patient ethnicity or race in at least 1 dataset, and only 10.3% (6/58) of studies included any information about skin tone in the dataset. Studies with a dermatologist as the last author (most likely to be supervising the project) were more likely to include clinical images depicting SoC than those without (82.6% [19/23] and 16.7% [3/18], respectively [P=.0411]).
The mean (SD) number of clinical images in the study articles was 28,422 (84,050). Thirty-seven (63.8%) of the study articles included gross images, 17 (29.3%) used dermoscopic images, and 4 (6.9%) used both. Twenty-seven (46.6%) articles used convolutional/convoluted neural networks, 15 (25.9%) used deep learning model/deep neural networks, 8 (13.8%) used other algorithms, 6 (10.3%) used AI/artificial neural network, and 2 (3.4%) used fuzzy algorithms. Most studies were conducted in China (29.3% [17/58]), Germany (12.1% [7/58]), India (10.3% [6/58]), multiple nations (10.3% [6/58]), and the United States (10.3% [6/58]). Overall, 82.8% (48/58) of articles included at least 1 dermatologist coauthor. Sensitivity of the AI models was 0.85, and specificity was 0.85. The average percentage of images in the dataset correctly identified by a physician was 76.87% vs 81.62% of images correctly identified by AI. Average agreement between AI and physician assessment was 77.98%, defined as AI and physician both having the same diagnosis.
Articles authored by dermatologists contained more clinical images than those without dermatologists in key authorship roles (P<.0001)(eTable). Psoriasis-related algorithms had the fewest (mean [SD]: 3173 [4203]), and pigmented skin lesions had the most clinical images (mean [SD]: 53,19l [155,579]).
Comment
Our results indicated that AI studies with dermatologist authors had significantly more images in their datasets (ie, the set of clinical images of skin lesions used to train AI algorithms in diagnosing or classifying lesions) than those with nondermatologist authors (P<.0001)(eTable). Similarly, in a study of AI technology for skin cancer diagnosis, AI studies with dermatologist authors (ie, included in the development of the AI algorithm) had more images than studies without dermatologist authors.1 Deep learning textbooks have suggested that 5000 clinical images or training input per output category are needed to produce acceptable algorithm performance, and more than 10 million are needed to produce results superior to human performance.4-10 Despite advances in AI for dermatologic image analysis, the creation of these models often has been directed by nondermatologists1; therefore, dermatologist involvement in AI development is necessary to facilitate collection of larger image datasets and optimal performance for image diagnosis/classification tasks.
We found that 20.7% of articles on deep learning models included descriptions of patient ethnicity or race, and only 10.3% of studies included any information about skin tone in the dataset. Furthermore, American investigators primarily trained models using clinical images of patients with lighter skin tones, whereas Chinese investigators exclusively included images depicting darker skin tones. Similarly, in a study of 52 cutaneous imaging deep learning articles, only 17.3% (9/52) reported race and/or Fitzpatrick skin type, and only 7.7% (4/52) of articles included both.2,6,8 Therefore, dermatologists are needed to contribute images representing diverse populations and collaborate in AI research studies, as their involvement is necessary to ensure the accuracy of AI models in classifying lesions or diagnosing skin lesions across all skin types.
Our search was limited to PubMed, and real-world applications could not be evaluated.
Conclusion
In summary, we found that AI studies with dermatologist authors used larger numbers of clinical images in their datasets and more images representing diverse skin types than studies without. Therefore, we advocate for greater involvement of dermatologists in AI research, which might result in better patient outcomes by improving diagnostic accuracy.
- Zakhem GA, Fakhoury JW, Motosko CC, et al. Characterizing the role of dermatologists in developing artificial intelligence for assessment of skin cancer. J Am Acad Dermatol. 2021;85:1544-1556.
- Daneshjou R, Vodrahalli K, Novoa RA, et al. Disparities in dermatology AI performance on a diverse, curated clinical image set. Sci Adv. 2022;8:eabq6147.
- Wu E, Wu K, Daneshjou R, et al. How medical AI devices are evaluated: limitations and recommendations from an analysis of FDA approvals. Nat Med. 2021;27:582-584.
- Murphree DH, Puri P, Shamim H, et al. Deep learning for dermatologists: part I. Fundamental concepts. J Am Acad Dermatol. 2022;87:1343-1351.
- Goodfellow I, Bengio Y, Courville A. Deep Learning. The MIT Press; 2016.
- Kim YH, Kobic A, Vidal NY. Distribution of race and Fitzpatrick skin types in data sets for deep learning in dermatology: a systematic review. J Am Acad Dermatol. 2022;87:460-461.
- Liu Y, Jain A, Eng C, et al. A deep learning system for differential diagnosis of skin diseases. Nat Med. 2020;26:900-908.
- Zhu CY, Wang YK, Chen HP, et al. A deep learning based framework for diagnosing multiple skin diseases in a clinical environment. Front Med (Lausanne). 2021;8:626369.
- Capurro N, Pastore VP, Touijer L, et al. A deep learning approach to direct immunofluorescence pattern recognition in autoimmune bullous diseases. Br J Dermatol. 2024;191:261-266.
- Han SS, Park I, Eun Chang S, et al. Augmented intelligence dermatology: deep neural networks empower medical professionals in diagnosing skin cancer and predicting treatment options for 134 skin disorders. J Invest Dermatol. 2020;140:1753-1761.
The Role of Dermatologists in Developing AI Tools for Diagnosis and Classification of Skin Disease
The Role of Dermatologists in Developing AI Tools for Diagnosis and Classification of Skin Disease
Practice Points
- Artificial intelligence (AI) technology is emerging as a valuable tool in diagnosing and classifying dermatologic conditions.
- Despite advances in AI for dermatologic image analysis, the creation of these models often has been directed by nondermatologists.

The Current State of Postgraduate Dermatology Training Programs for Advanced Practice Providers
The Current State of Postgraduate Dermatology Training Programs for Advanced Practice Providers
Nurse practitioners (NPs) and physician assistants (PAs) often help provide dermatologic care but lack the same mandatory specialized postgraduate training required of board-certified dermatologists (BCDs), which includes at least 3 years of dermatology-focused education in an accredited residency program in addition to an intern year of general medicine, pediatrics, or surgery. Dermatology residency is followed by a certification examination administered by the American Board of Dermatology (ABD) or the American Osteopathic Board of Dermatology, leading to board certification. Some physicians choose to do a fellowship, which typically involves an additional 1 to 2 years of postresidency subspeciality training.
Optional postgraduate dermatology training programs for advanced practice providers (APPs) have been offered by some academic institutions and private practice groups since at least 2003, including Lahey Hospital and Medical Center (Burlington, Massachusetts) as well as the University of Rochester Medical Center (Rochester, New York). Despite a lack of accreditation or standardization, the programs can be beneficial for NPs and PAs to expand their dermatologic knowledge and skills and help bridge the care gap within the specialty. Didactics often are conducted in parallel with the educational activities of the parent institution’s traditional dermatology residency program (eg, lectures, grand rounds). While these programs often are managed by practicing dermatology NPs and PAs, dermatologists also may be involved in their education with didactic instruction, curriculum development, and clinical preceptorship.
In this cross-sectional study, we identified and evaluated 10 postgraduate dermatology training programs for APPs across the United States. With the growing number of NPs and PAs in the dermatology workforce—both in academic and private practice—it is important for BCDs to be aware of the differences in the dermatology training received in order to ensure safe and effective care is provided through supervisory or collaborative roles (depending on state independent practice laws for APPs and to be aware of the implications these programs may have on the field of dermatology.
Methods
To identify postgraduate dermatology training programs for APPs in the United States, we conducted a cross-sectional study using data obtained via a Google search of various combinations of the following terms: nurse practitioner, NP, physician assistant, PA, advance practice provider, APP, dermatology, postgraduate training, residency, and fellowship. We excluded postgraduate dermatology training programs for APPs that required tuition and did not provide a stipend, as well as programs that lacked the formal structure and credibility needed to qualify as legitimate postgraduate training. Many of the excluded programs operate in a manner that raises ethical concerns, offering pay-to-play opportunities under the guise of education. Information collected on each program included the program name, location, parent institution, program length, class size, curriculum, and any associated salary and benefits.
Results
Ten academic and private practice organizations across the United States that offer postgraduate dermatologic training programs for APPs were identified (eTable). Four (40%) programs were advertised as fellowships. Six (60%) of the programs were offered at academic medical centers, and 4 (40%) were offered by private practices. Most programs were located east of the Mississippi River, and many institutions offered instruction at 1 or more locations within the same state (eFigure). The Advanced Dermatology and Cosmetic Surgery private practice group offered training opportunities in multiple states.
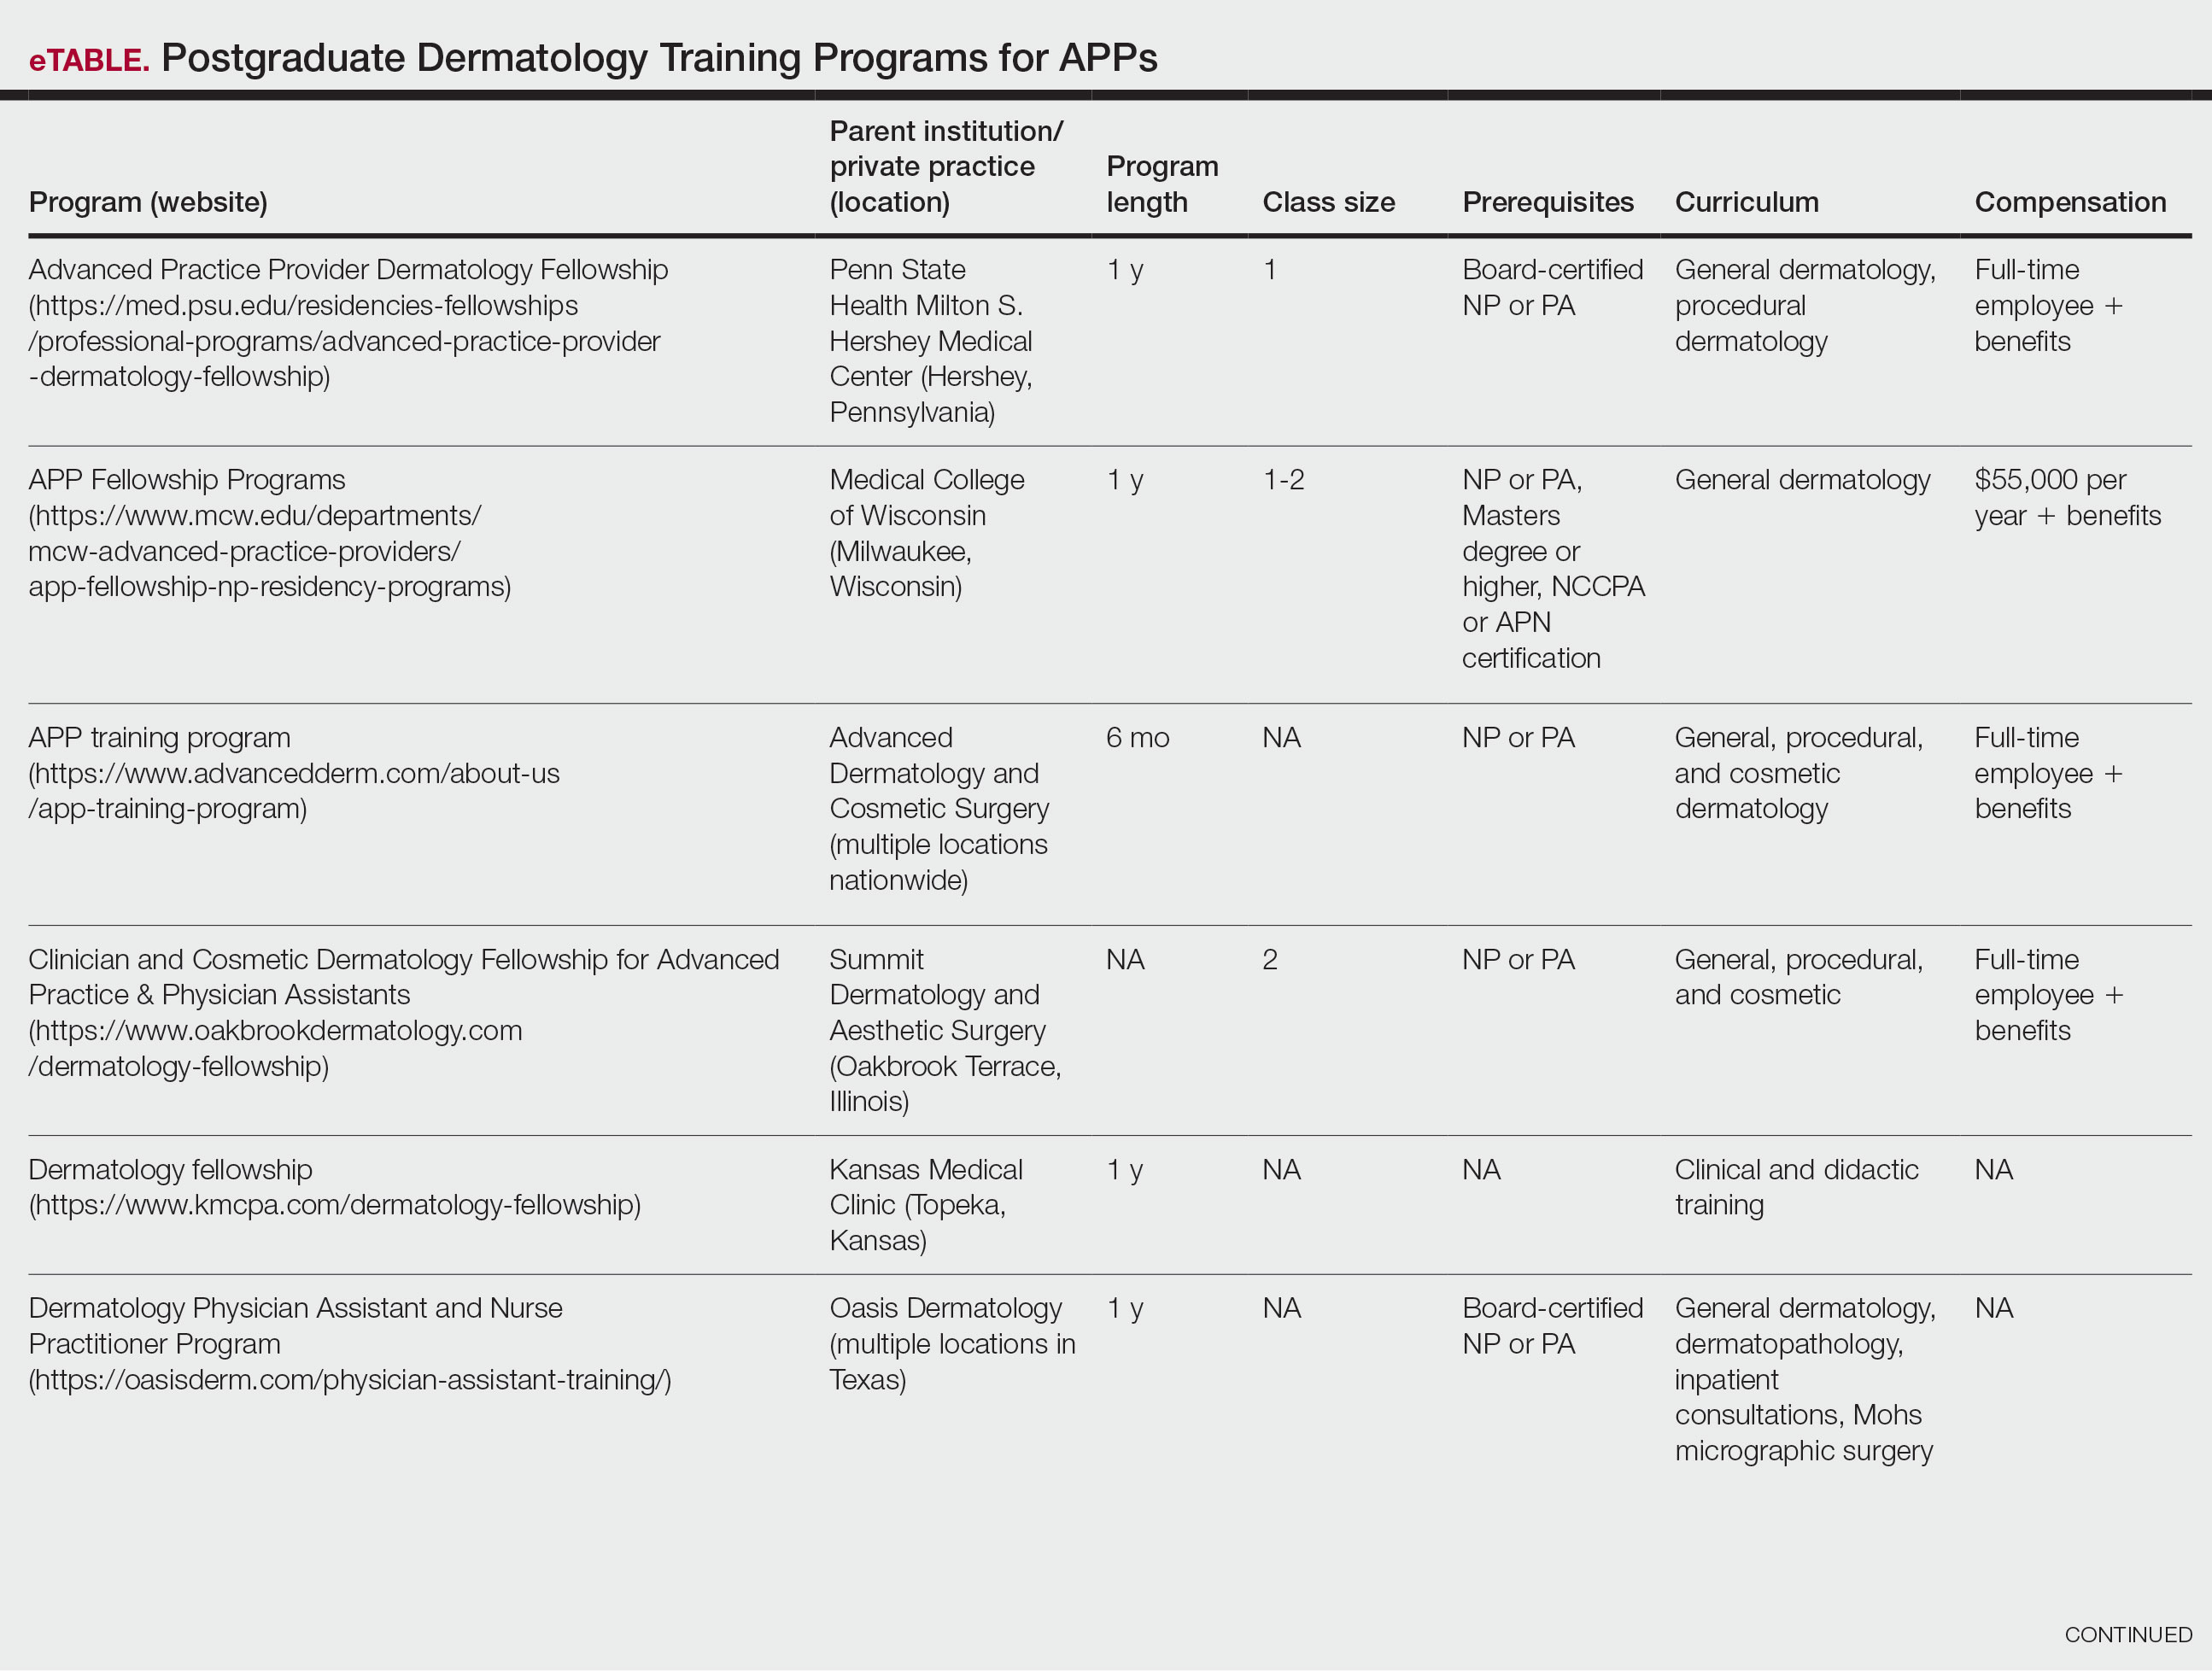
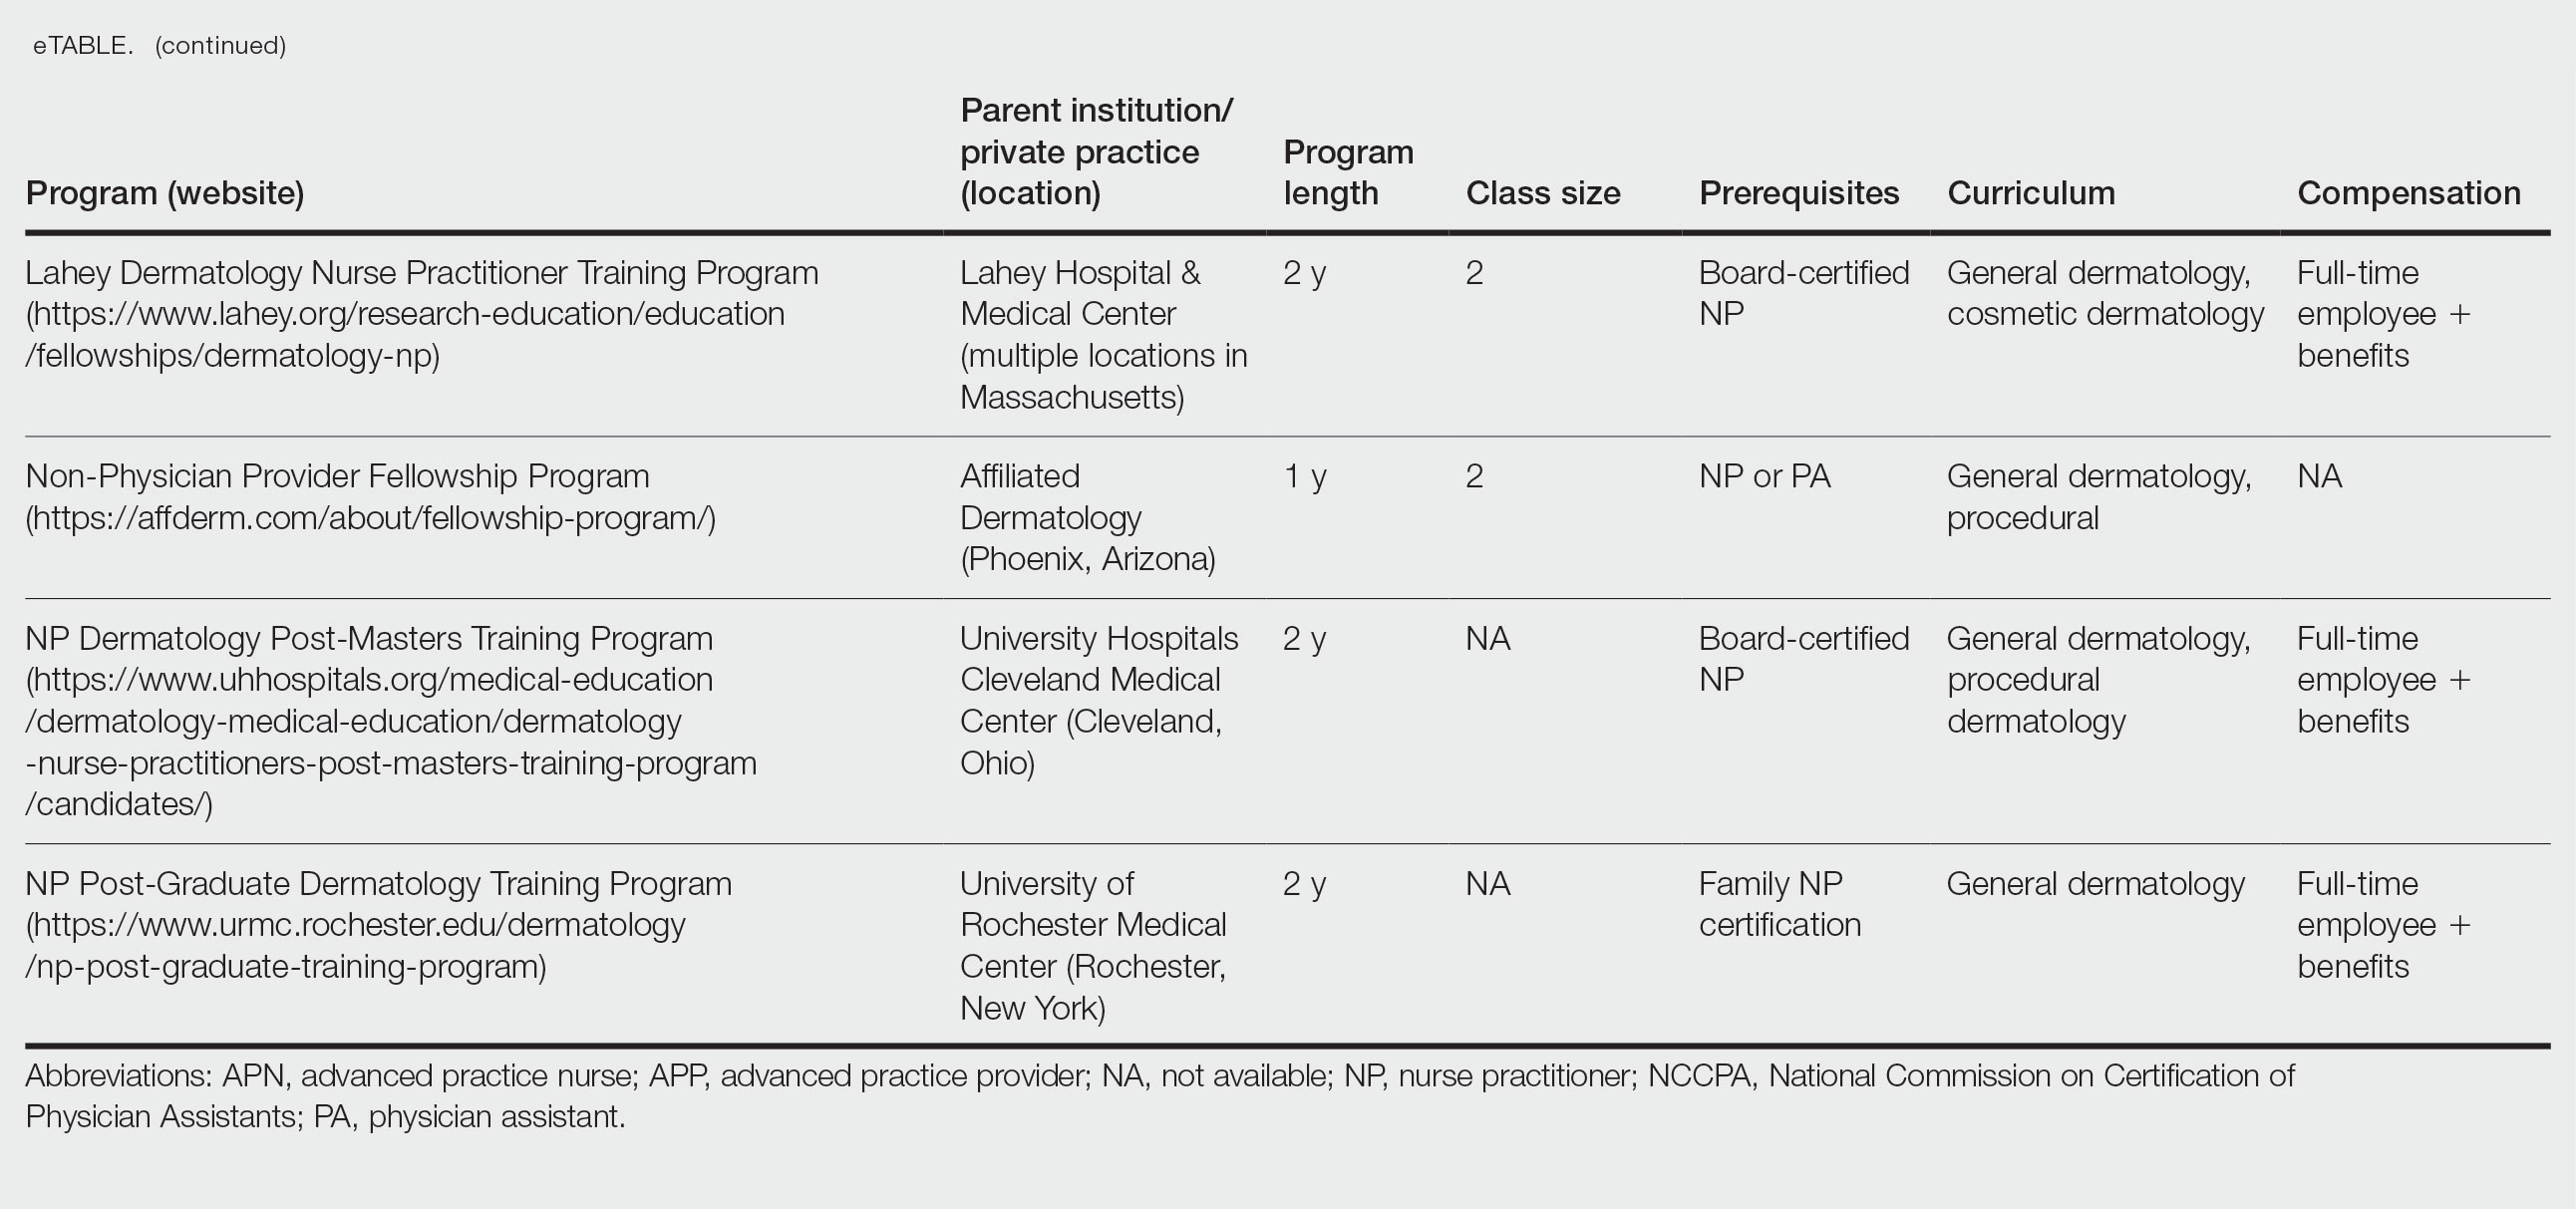
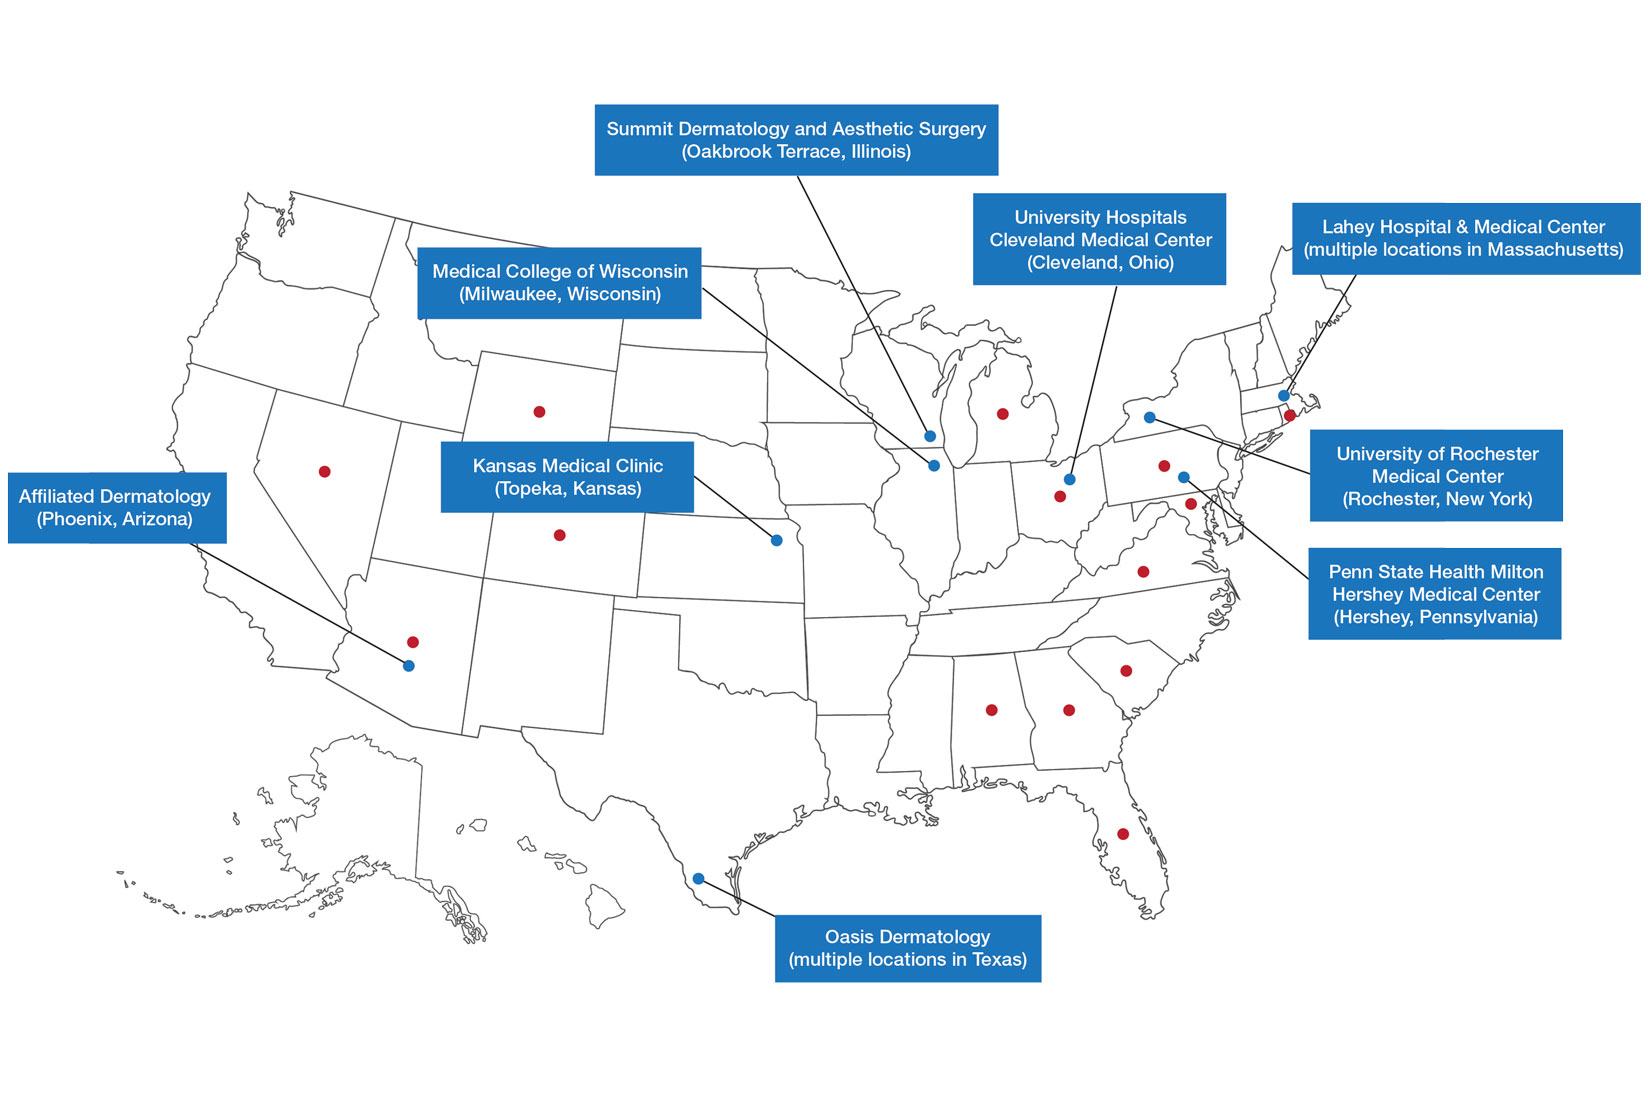
Six programs required APPs to become board-certified NPs or PAs prior to enrolling. Most programs enrolled both NPs and PAs, while some only enrolled NPs (eTable). Only 1 (10%) program required NPs to be board certified as a family NP, while another (10%) recommended that applicants have experience in urgent care, emergency medicine, or trauma medicine. Lahey Hospital & Medical Center required experience as an NP in a general setting for 1 to 2 years prior to applying. No program required prior experience in the field of dermatology.
Program length varied from 6 to 24 months, and cohort size typically was limited to 1 to 2 providers (eTable). Although the exact numbers could not be ascertained, most curricula focused on medical dermatology, including clinical and didactic components, but many offered electives such as cosmetic and procedural dermatology. Two institutions (20%) required independent research. Work typically was limited to 40 hours per week, and most paid a full-time employee salary and provided benefits such as health insurance, retirement, and paid leave (eTable). Kansas Medical Clinic (Topeka, Kansas) required at least 3 years of employment in an underserved community following program completion. The Oasis Dermatology private practice group in Texas required a 1-year teaching commitment after program completion. The Advanced Dermatology and Cosmetic Surgery group offered a full-time position upon program completion.
Comment
There is a large difference in the total number of training and credentialing hours when comparing graduate school training and postgraduate credentialing of medical and osteopathic physicians compared with APPs. A new graduate physician has at least twice as many clinical hours as a PA and 10 times as many clinical hours as an NP prior to starting residency. Physicians also typically complete at least 6 times the number of hours of certification examinations compared to NPs and PAs.1
Nurse practitioner students typically complete the 500 hours of prelicensure clinical training required for NP school in 2 to 4 years.2,3 The amount of time required for completion is dependent on the degree and experience of the student upon program entry (eg, bachelor of science in nursing vs master of science in nursing as a terminal degree). Physician assistant students are required to complete 2000 prelicensure clinical hours, and most PA programs are 3 years in duration.4 Many NP and PA programs require some degree of clinical experience prior to beginning graduate education.5
When comparing prelicensure examinations, questions assessing dermatologic knowledge comprise approximately 6% to 10% of the total questions on the United States Medical Licensing Examination Steps 1 and 2.6 The Comprehensive Osteopathic Medical Licensing Examination of the United States Level 1 and Level 2-Cognitive Evaluation both have at least 5% of questions dedicated to dermatology.7 Approximately 5% of the questions on the Physician Assistant National Certifying Examination are dedicated to dermatology.8 The dermatology content on either of the NP certification examinations is unclear.2,3 In the states of California, Indiana, and New York, national certification through the American Association of Nurse Practitioners or American Nurses Credentialing Center is not required for NPs to practice in their respective states.9
Regarding dermatologic board certification, a new graduate NP may obtain certification from the
Many of the programs we evaluated integrate APP trainees into resident education, allowing participation in equivalent didactic curricula, clinical rotations, and departmental academic activities. The salary and benefits associated with these programs are somewhat like those of resident physicians.15,16 While most tuition-based programs were excluded from our study due to their lack of credibility and alignment with our study criteria, we identified 2 specific programs that stood out as credible despite requiring students to pay tuition. These programs demonstrated a structured and rigorous curriculum with a clear focus on comprehensive dermatologic training, meeting our standards for inclusion. These programs offer dermatologic training for graduates of NP and PA programs at a cost to the student.15,16 The program at the Florida Atlantic University, Boca Raton, is largely online,15 and the program at the University of Miami, Florida, offers no direct clinical contact.16 These programs illustrate the variety of postgraduate dermatology curricula available nationally in comparison to resident salaries; however, they were not included in our formal analysis because they do not provide structured, in-person clinical training consistent with our inclusion criteria. Neither of these programs would enable participants to qualify for credentialing with the Dermatology Nurse Practitioner Certification Board after completion. While this study identified postgraduate training programs for APPs in dermatology advertised online, it is possible some were omitted or not advertised online.
While many of the postgraduate programs we evaluated provide unique educational opportunities for APPs, it is unknown if graduating providers are equipped to handle the care of patients with complex dermatologic needs. Regardless, the increased utilization of APPs by BCDs has been well documented over the past 2 decades.17-20 It has been suggested that a higher ratio of APPs to dermatologists can decrease the time it takes for a patient to be seen in a clinic.21-23 However, investigators have expressed concerns that APPs lack standardized surgical training and clinical hour requirements in the field of dermatology.24 Despite these concerns, Medicare claims data show that APPs are performing advanced surgical and cosmetic procedures at increasing rates.17,18 Other authors have questioned the cost-effectiveness of APPs, as multiple studies have shown that the number of biopsies needed to diagnose 1 case of skin cancer is higher for midlevel providers than for dermatologists.25-27
Conclusion
With the anticipated expansion of private equity in dermatology and the growth of our Medicare-eligible population, we are likely to see increased utilization of APPs to address the shortage of BCDs.28,29 Understanding the prelicensure and postlicensure clinical training requirements, examination hours, and extent of dermatology-focused education among APPs and BCDs can help dermatologists collaborate more effectively and ensure safe, high-quality patient care. Standardizing, improving, and providing high-quality education and promoting lifelong learning in the field of dermatology should be celebrated, and dermatologists are the skin experts best equipped to lead dermatologic education forward.
- Robeznieks A. Training gaps between physicians, nonphysicians are significant. American Medical Association. February 17, 2025. Accessed October 23, 2025. https://www.ama-assn.org/practice-management/scope-practice/training-gaps-between-physicians-nonphysicians-are-significant
- American Nurses Credentialing Center. Test content outline. Accessed October 6, 2025. https://www.nursingworld.org/globalassets/08282024-exam-24-npd-tco-website.pdf
- American Academy of Nurse Practitioners National Certification Board. AANPCB Family Nurse Practitioner Adult-Gerontology Primary Care Nurse Practitioner Psychiatric Mental Health Pratitioner: FNP, AGNP & PMHNP Certification Certification Handbook. American Academy of Nurse Practitioners Certification Board; 2023. Accessed October 6, 2025. https://www.aanpcert.org/resource/documents/AGNP%20FNP%20Candidate%20Handbook.pdf
- Society of Dermatology Physician Associates. SDPA Diplomate Fellowship. Accessed October 6, 2025. https://learning.dermpa.orgdiplomate-fellowship
- American Academy of Physician Associates. Become a PA. Accessed October 6, 2025. https://www.aapa.org/career-central/become-a-pa/
- United States Medical Licensing Examination. Prepare for your exam. Accessed October 6, 2025. https://www.usmle.org/prepare-your-exam
- National Board of Osteopathic Medical Examiners. Patient presentations related to the integumentary system. Accessed October 6, 2025. https://www.nbome.org/assessments/comlex-usa/comlex-usa-blueprint/d2-clinical-presentations/integumentary-system
- National Commission on Certification of Physician Assistants. PANCE content blueprint. Accessed October 6, 2025. https://prodcmsstoragesa.blob.core.windows.net/uploads/files/PANCEBlueprint.pdf
- American Association of Nurse Practitioners. Practice information by state. Accessed October 6, 2025. https://www.aanp.org/practice/practice-information-by-state
- Dermatology Nurse Practitioner Certification Board. Eligibility. Accessed October 6, 2025. https://www.dnpcb.org/eligibility.php
- National Board of Dermatology Physician Assistants. Certification. Accessed September 3, 2022.
- Society of Dermatology Physician Associates. SDPA statement regarding the ABDPA Board Certification Exam for derm PAs. October 8, 2019. Accessed October 6, 2025. https://www.dermpa.org/news/articles/2019-10/sdpa-statement-regarding-abdpa-board-certification-exam-derm-pas
- American Board of Dermatology. Residents and fellows. Accessed October 6, 2025. https://www.abderm.org/residents-and-fellows
- American Osteopathic Board of Dermatology. Primary certificaiton exam. Accessed October 6, 2025. https://certification.osteopathic.org/dermatology/certification-process/dermatology/written-exams/
- Florida Atlantic University. Christine E. Lynn College of Nursing. Dermatology nurse practitioner certificate program. Accessed October 6, 2025. https://www.fau.edu/nursing/academics/certificates/dermatology-program/
- Dr. Phillip Frost Department of Dermatology and Cutaneous Surgery. Advanced Practitioner Program.
- Coldiron B, Ratnarathorn M. Scope of physician procedures independently billed by mid-level providers in the office setting. JAMA Dermatol. 2014;150:1153-1159.
- Zhang M, Zippin J, Kaffenberger B. Trends and scope of dermatology procedures billed by advanced practice professionals from 2012 through 2015. JAMA Dermatol. 2018;154:1040-1044.
- Resneck J Jr, Kimball AB. The dermatology workforce shortage. J Am Acad Dermatol. 2004;50:50-54.
- Kimball AB, Resneck JS Jr. The US dermatology workforce: a specialty remains in shortage. J Am Acad Dermatol. 2008;59:741-745.
- Creadore A, Desai S, Li SJ, et al. Insurance acceptance, appointment wait time, and dermatologist access across practice types in the US. JAMA Dermatol. 2021;157:181-188.
- Braun RT, Bond AM, Qian Y, et al. Private equity in dermatology: effect on price, utilization, and spending. Health Aff (Millwood). 2021;40:727-735.
- Skaljic M, Lipoff JB. Association of private equity ownership with increased employment of advanced practice professionals in outpatient dermatology offices. J Am Acad Dermatol. 2021;84:1178-1180.
- Jalian HR, Avram MM. Mid-level practitioners in dermatology: a need for further study and oversight. JAMA Dermatol. 2014;150:1149-1151.
- Sarzynski E, Barry H. Current evidence and controversies: advanced practice providers in healthcare. Am J Manag Care. 2019;25:366-368.
- Nault A, Zhang C, Kim K, et al. Biopsy use in skin cancer diagnosis: comparing dermatology physicians and advanced practice professionals. JAMA Dermatol. 2015;151:899-902.
- Anderson AM, Matsumoto M, Saul MI, et al. Accuracy of skin cancer diagnosis by physician assistants compared with dermatologists in a large health care system. JAMA Dermatol. 2018;154:569-573.
- Sung C, Salem S, Oulee A, et al. A systematic review: landscape of private equity in dermatology from past to present. J Drugs Dermatol. 2023 Apr 1;22:404-409. doi: 10.36849/JDD.6892.
- CMS releases National Healthcare Expenditure and enrollment projections through 2031. Health Management Associates. July 13, 2023. Accessed October 23, 2025. https://www.healthmanagement.com/blog/cms-releases-national-healthcare-expenditure-and-enrollment-projections-through-2031/
Nurse practitioners (NPs) and physician assistants (PAs) often help provide dermatologic care but lack the same mandatory specialized postgraduate training required of board-certified dermatologists (BCDs), which includes at least 3 years of dermatology-focused education in an accredited residency program in addition to an intern year of general medicine, pediatrics, or surgery. Dermatology residency is followed by a certification examination administered by the American Board of Dermatology (ABD) or the American Osteopathic Board of Dermatology, leading to board certification. Some physicians choose to do a fellowship, which typically involves an additional 1 to 2 years of postresidency subspeciality training.
Optional postgraduate dermatology training programs for advanced practice providers (APPs) have been offered by some academic institutions and private practice groups since at least 2003, including Lahey Hospital and Medical Center (Burlington, Massachusetts) as well as the University of Rochester Medical Center (Rochester, New York). Despite a lack of accreditation or standardization, the programs can be beneficial for NPs and PAs to expand their dermatologic knowledge and skills and help bridge the care gap within the specialty. Didactics often are conducted in parallel with the educational activities of the parent institution’s traditional dermatology residency program (eg, lectures, grand rounds). While these programs often are managed by practicing dermatology NPs and PAs, dermatologists also may be involved in their education with didactic instruction, curriculum development, and clinical preceptorship.
In this cross-sectional study, we identified and evaluated 10 postgraduate dermatology training programs for APPs across the United States. With the growing number of NPs and PAs in the dermatology workforce—both in academic and private practice—it is important for BCDs to be aware of the differences in the dermatology training received in order to ensure safe and effective care is provided through supervisory or collaborative roles (depending on state independent practice laws for APPs and to be aware of the implications these programs may have on the field of dermatology.
Methods
To identify postgraduate dermatology training programs for APPs in the United States, we conducted a cross-sectional study using data obtained via a Google search of various combinations of the following terms: nurse practitioner, NP, physician assistant, PA, advance practice provider, APP, dermatology, postgraduate training, residency, and fellowship. We excluded postgraduate dermatology training programs for APPs that required tuition and did not provide a stipend, as well as programs that lacked the formal structure and credibility needed to qualify as legitimate postgraduate training. Many of the excluded programs operate in a manner that raises ethical concerns, offering pay-to-play opportunities under the guise of education. Information collected on each program included the program name, location, parent institution, program length, class size, curriculum, and any associated salary and benefits.
Results
Ten academic and private practice organizations across the United States that offer postgraduate dermatologic training programs for APPs were identified (eTable). Four (40%) programs were advertised as fellowships. Six (60%) of the programs were offered at academic medical centers, and 4 (40%) were offered by private practices. Most programs were located east of the Mississippi River, and many institutions offered instruction at 1 or more locations within the same state (eFigure). The Advanced Dermatology and Cosmetic Surgery private practice group offered training opportunities in multiple states.
Six programs required APPs to become board-certified NPs or PAs prior to enrolling. Most programs enrolled both NPs and PAs, while some only enrolled NPs (eTable). Only 1 (10%) program required NPs to be board certified as a family NP, while another (10%) recommended that applicants have experience in urgent care, emergency medicine, or trauma medicine. Lahey Hospital & Medical Center required experience as an NP in a general setting for 1 to 2 years prior to applying. No program required prior experience in the field of dermatology.
Program length varied from 6 to 24 months, and cohort size typically was limited to 1 to 2 providers (eTable). Although the exact numbers could not be ascertained, most curricula focused on medical dermatology, including clinical and didactic components, but many offered electives such as cosmetic and procedural dermatology. Two institutions (20%) required independent research. Work typically was limited to 40 hours per week, and most paid a full-time employee salary and provided benefits such as health insurance, retirement, and paid leave (eTable). Kansas Medical Clinic (Topeka, Kansas) required at least 3 years of employment in an underserved community following program completion. The Oasis Dermatology private practice group in Texas required a 1-year teaching commitment after program completion. The Advanced Dermatology and Cosmetic Surgery group offered a full-time position upon program completion.
Comment
There is a large difference in the total number of training and credentialing hours when comparing graduate school training and postgraduate credentialing of medical and osteopathic physicians compared with APPs. A new graduate physician has at least twice as many clinical hours as a PA and 10 times as many clinical hours as an NP prior to starting residency. Physicians also typically complete at least 6 times the number of hours of certification examinations compared to NPs and PAs.1
Nurse practitioner students typically complete the 500 hours of prelicensure clinical training required for NP school in 2 to 4 years.2,3 The amount of time required for completion is dependent on the degree and experience of the student upon program entry (eg, bachelor of science in nursing vs master of science in nursing as a terminal degree). Physician assistant students are required to complete 2000 prelicensure clinical hours, and most PA programs are 3 years in duration.4 Many NP and PA programs require some degree of clinical experience prior to beginning graduate education.5
When comparing prelicensure examinations, questions assessing dermatologic knowledge comprise approximately 6% to 10% of the total questions on the United States Medical Licensing Examination Steps 1 and 2.6 The Comprehensive Osteopathic Medical Licensing Examination of the United States Level 1 and Level 2-Cognitive Evaluation both have at least 5% of questions dedicated to dermatology.7 Approximately 5% of the questions on the Physician Assistant National Certifying Examination are dedicated to dermatology.8 The dermatology content on either of the NP certification examinations is unclear.2,3 In the states of California, Indiana, and New York, national certification through the American Association of Nurse Practitioners or American Nurses Credentialing Center is not required for NPs to practice in their respective states.9
Regarding dermatologic board certification, a new graduate NP may obtain certification from the
Many of the programs we evaluated integrate APP trainees into resident education, allowing participation in equivalent didactic curricula, clinical rotations, and departmental academic activities. The salary and benefits associated with these programs are somewhat like those of resident physicians.15,16 While most tuition-based programs were excluded from our study due to their lack of credibility and alignment with our study criteria, we identified 2 specific programs that stood out as credible despite requiring students to pay tuition. These programs demonstrated a structured and rigorous curriculum with a clear focus on comprehensive dermatologic training, meeting our standards for inclusion. These programs offer dermatologic training for graduates of NP and PA programs at a cost to the student.15,16 The program at the Florida Atlantic University, Boca Raton, is largely online,15 and the program at the University of Miami, Florida, offers no direct clinical contact.16 These programs illustrate the variety of postgraduate dermatology curricula available nationally in comparison to resident salaries; however, they were not included in our formal analysis because they do not provide structured, in-person clinical training consistent with our inclusion criteria. Neither of these programs would enable participants to qualify for credentialing with the Dermatology Nurse Practitioner Certification Board after completion. While this study identified postgraduate training programs for APPs in dermatology advertised online, it is possible some were omitted or not advertised online.
While many of the postgraduate programs we evaluated provide unique educational opportunities for APPs, it is unknown if graduating providers are equipped to handle the care of patients with complex dermatologic needs. Regardless, the increased utilization of APPs by BCDs has been well documented over the past 2 decades.17-20 It has been suggested that a higher ratio of APPs to dermatologists can decrease the time it takes for a patient to be seen in a clinic.21-23 However, investigators have expressed concerns that APPs lack standardized surgical training and clinical hour requirements in the field of dermatology.24 Despite these concerns, Medicare claims data show that APPs are performing advanced surgical and cosmetic procedures at increasing rates.17,18 Other authors have questioned the cost-effectiveness of APPs, as multiple studies have shown that the number of biopsies needed to diagnose 1 case of skin cancer is higher for midlevel providers than for dermatologists.25-27
Conclusion
With the anticipated expansion of private equity in dermatology and the growth of our Medicare-eligible population, we are likely to see increased utilization of APPs to address the shortage of BCDs.28,29 Understanding the prelicensure and postlicensure clinical training requirements, examination hours, and extent of dermatology-focused education among APPs and BCDs can help dermatologists collaborate more effectively and ensure safe, high-quality patient care. Standardizing, improving, and providing high-quality education and promoting lifelong learning in the field of dermatology should be celebrated, and dermatologists are the skin experts best equipped to lead dermatologic education forward.
- Robeznieks A. Training gaps between physicians, nonphysicians are significant. American Medical Association. February 17, 2025. Accessed October 23, 2025. https://www.ama-assn.org/practice-management/scope-practice/training-gaps-between-physicians-nonphysicians-are-significant
- American Nurses Credentialing Center. Test content outline. Accessed October 6, 2025. https://www.nursingworld.org/globalassets/08282024-exam-24-npd-tco-website.pdf
- American Academy of Nurse Practitioners National Certification Board. AANPCB Family Nurse Practitioner Adult-Gerontology Primary Care Nurse Practitioner Psychiatric Mental Health Pratitioner: FNP, AGNP & PMHNP Certification Certification Handbook. American Academy of Nurse Practitioners Certification Board; 2023. Accessed October 6, 2025. https://www.aanpcert.org/resource/documents/AGNP%20FNP%20Candidate%20Handbook.pdf
- Society of Dermatology Physician Associates. SDPA Diplomate Fellowship. Accessed October 6, 2025. https://learning.dermpa.orgdiplomate-fellowship
- American Academy of Physician Associates. Become a PA. Accessed October 6, 2025. https://www.aapa.org/career-central/become-a-pa/
- United States Medical Licensing Examination. Prepare for your exam. Accessed October 6, 2025. https://www.usmle.org/prepare-your-exam
- National Board of Osteopathic Medical Examiners. Patient presentations related to the integumentary system. Accessed October 6, 2025. https://www.nbome.org/assessments/comlex-usa/comlex-usa-blueprint/d2-clinical-presentations/integumentary-system
- National Commission on Certification of Physician Assistants. PANCE content blueprint. Accessed October 6, 2025. https://prodcmsstoragesa.blob.core.windows.net/uploads/files/PANCEBlueprint.pdf
- American Association of Nurse Practitioners. Practice information by state. Accessed October 6, 2025. https://www.aanp.org/practice/practice-information-by-state
- Dermatology Nurse Practitioner Certification Board. Eligibility. Accessed October 6, 2025. https://www.dnpcb.org/eligibility.php
- National Board of Dermatology Physician Assistants. Certification. Accessed September 3, 2022.
- Society of Dermatology Physician Associates. SDPA statement regarding the ABDPA Board Certification Exam for derm PAs. October 8, 2019. Accessed October 6, 2025. https://www.dermpa.org/news/articles/2019-10/sdpa-statement-regarding-abdpa-board-certification-exam-derm-pas
- American Board of Dermatology. Residents and fellows. Accessed October 6, 2025. https://www.abderm.org/residents-and-fellows
- American Osteopathic Board of Dermatology. Primary certificaiton exam. Accessed October 6, 2025. https://certification.osteopathic.org/dermatology/certification-process/dermatology/written-exams/
- Florida Atlantic University. Christine E. Lynn College of Nursing. Dermatology nurse practitioner certificate program. Accessed October 6, 2025. https://www.fau.edu/nursing/academics/certificates/dermatology-program/
- Dr. Phillip Frost Department of Dermatology and Cutaneous Surgery. Advanced Practitioner Program.
- Coldiron B, Ratnarathorn M. Scope of physician procedures independently billed by mid-level providers in the office setting. JAMA Dermatol. 2014;150:1153-1159.
- Zhang M, Zippin J, Kaffenberger B. Trends and scope of dermatology procedures billed by advanced practice professionals from 2012 through 2015. JAMA Dermatol. 2018;154:1040-1044.
- Resneck J Jr, Kimball AB. The dermatology workforce shortage. J Am Acad Dermatol. 2004;50:50-54.
- Kimball AB, Resneck JS Jr. The US dermatology workforce: a specialty remains in shortage. J Am Acad Dermatol. 2008;59:741-745.
- Creadore A, Desai S, Li SJ, et al. Insurance acceptance, appointment wait time, and dermatologist access across practice types in the US. JAMA Dermatol. 2021;157:181-188.
- Braun RT, Bond AM, Qian Y, et al. Private equity in dermatology: effect on price, utilization, and spending. Health Aff (Millwood). 2021;40:727-735.
- Skaljic M, Lipoff JB. Association of private equity ownership with increased employment of advanced practice professionals in outpatient dermatology offices. J Am Acad Dermatol. 2021;84:1178-1180.
- Jalian HR, Avram MM. Mid-level practitioners in dermatology: a need for further study and oversight. JAMA Dermatol. 2014;150:1149-1151.
- Sarzynski E, Barry H. Current evidence and controversies: advanced practice providers in healthcare. Am J Manag Care. 2019;25:366-368.
- Nault A, Zhang C, Kim K, et al. Biopsy use in skin cancer diagnosis: comparing dermatology physicians and advanced practice professionals. JAMA Dermatol. 2015;151:899-902.
- Anderson AM, Matsumoto M, Saul MI, et al. Accuracy of skin cancer diagnosis by physician assistants compared with dermatologists in a large health care system. JAMA Dermatol. 2018;154:569-573.
- Sung C, Salem S, Oulee A, et al. A systematic review: landscape of private equity in dermatology from past to present. J Drugs Dermatol. 2023 Apr 1;22:404-409. doi: 10.36849/JDD.6892.
- CMS releases National Healthcare Expenditure and enrollment projections through 2031. Health Management Associates. July 13, 2023. Accessed October 23, 2025. https://www.healthmanagement.com/blog/cms-releases-national-healthcare-expenditure-and-enrollment-projections-through-2031/
The Current State of Postgraduate Dermatology Training Programs for Advanced Practice Providers
The Current State of Postgraduate Dermatology Training Programs for Advanced Practice Providers
Practice Points
- Postgraduate dermatology training programs are available for advanced practice providers (APPs), but they are optional and lack a formal accreditation process.
- Awareness of these programs and the differences between APPs and physician training may help dermatologists provide safe and effective care in collaborative or supervisory roles.

Process Improvement for Engaging With Trauma-Focused Evidence-Based Psychotherapy for PTSD
Process Improvement for Engaging With Trauma-Focused Evidence-Based Psychotherapy for PTSD
Trauma-focused evidence-based psychotherapies (TF-EBPs), including cognitive processing therapy (CPT) and prolonged exposure therapy (PE), are recommended treatments for posttraumatic stress disorder (PTSD) in clinical practice guidelines.1-3 To increase initiation of these treatments, the US Department of Veterans Affairs (VA) used a large-scale dissemination and implementation effort to improve access to TF-EBP.4,5 These efforts achieved modest success, increasing prevalence of TF-EBP from a handful of veterans in 2004 to an annual prevalence of 14.6% for CPT and 4.3% for PE in 2014.6
Throughout these efforts, qualitative studies have been used to better understand veterans’ perspectives on receiving TF-EBP care.7-18 Barriers to initiation of and engagement in TF-EBP and PTSD care have been identified from these qualitative studies. One identified barrier was lack of knowledge—particularly lack of knowledge about what is meant by a PTSD diagnosis and available treatments.7-10 Stigma (ie, automatic negative associations) toward mental health problems or seeking mental health care also has been identified as a barrier to initiation.7,10-14 Perceptions of poor alignment between treatment and veteran goals, including lack of buy-in for the rationale, served as barriers to initiation and engagement.8,15-18
Using prior qualitative work, numerous initiatives have been developed to reduce stigma, facilitate conversations about how treatment aligns with goals, and fill knowledge gaps, particularly through online resources and shared decision-making.19,20 To better inform the state of veterans’ experiences with TF-EBP, a qualitative investigation was conducted involving veterans who recently initiated TF-EBP. Themes directly related to transitions to TF-EBP were identified; however, all veterans interviewed also described their experiences with TFEBP engagement and mental health care. Consistent with recommendations for qualitative methods, this study extends prior work on transitions to TF-EBP by describing themes with a distinct focus on the experience of engaging with TF-EBP and mental health care.21,22
Methods
The experiences of veterans who were transitioning into TF-EBPs were collected in semistructured interviews and analyzed. The semistructured interview guide was developed and refined in consultation with both qualitative methods experts and PTSD treatment experts to ensure that 6 content domains were appropriately queried: PTSD treatment options, cultural sensitivity of treatment, PTSD treatment selection, transition criteria, beliefs about stabilization treatment, and treatment needs/preferences.
Participants were identified using the VA Corporate Data Warehouse and included post-9/11 veterans who had recently initiated CPT or PE for the first time between September 1, 2021, and September 1, 2022. More details of participant selection are available in Holder et al.21 From a population of 10,814 patients, stratified random sampling generated a recruitment pool of 200 veterans for further outreach. The strata were defined such that this recruitment pool had similar proportions of demographic characteristics (ie, gender, race, ethnicity) to the population of eligible veterans, equivalent distributions of time to CPT or PE initiation (ie, 33.3% < 1 year, 33.3% 1-3 years, and 33.3% > 3 years), and adequate variability in TF-EBP type (ie, 66.7% CPT, 33.3% PE). A manual chart review in the recruitment pool excluded 12 veterans who did not initiate CPT or PE, 1 veteran with evidence of current active psychosis and/or cognitive impairment that would likely preclude comprehension of study materials, and 1 who was deceased.
Eligible veterans from the recruitment pool were contacted in groups of 25. First, a recruitment letter with study information and instructions to opt-out of further contact was mailed or emailed to veterans. After 2 weeks, veterans who had not responded were contacted by phone up to 3 times. Veterans interested in participating were scheduled for a 1-time visit that included verbal consent and the qualitative interview. Metrics were established a priori to ensure an adequately diverse and inclusive sample. Specifically, a minimum number of racial and/or ethnic minority veterans (33%) and women veterans (20%) were sought. Equal distribution across the 3 categories of time from first mental health visit to CPT/PE initiation also was targeted. Throughout enrollment, recruitment efforts were adapted to meet these metrics in the emerging sample. While the goal was to generate a diverse and inclusive sample using these methods, the sample was not intended to be representative of the population.
Of the 186 eligible participants, 21 declined participation and 26 could not be reached. The targeted sample was reached after exhausting contact for 47 veterans and contacting 80 veterans for a final response rate of 40% among fully contacted veterans and 27% among veterans with any contact. The final sample included 30 veterans who received CPT or PE in VA facilities (Table).
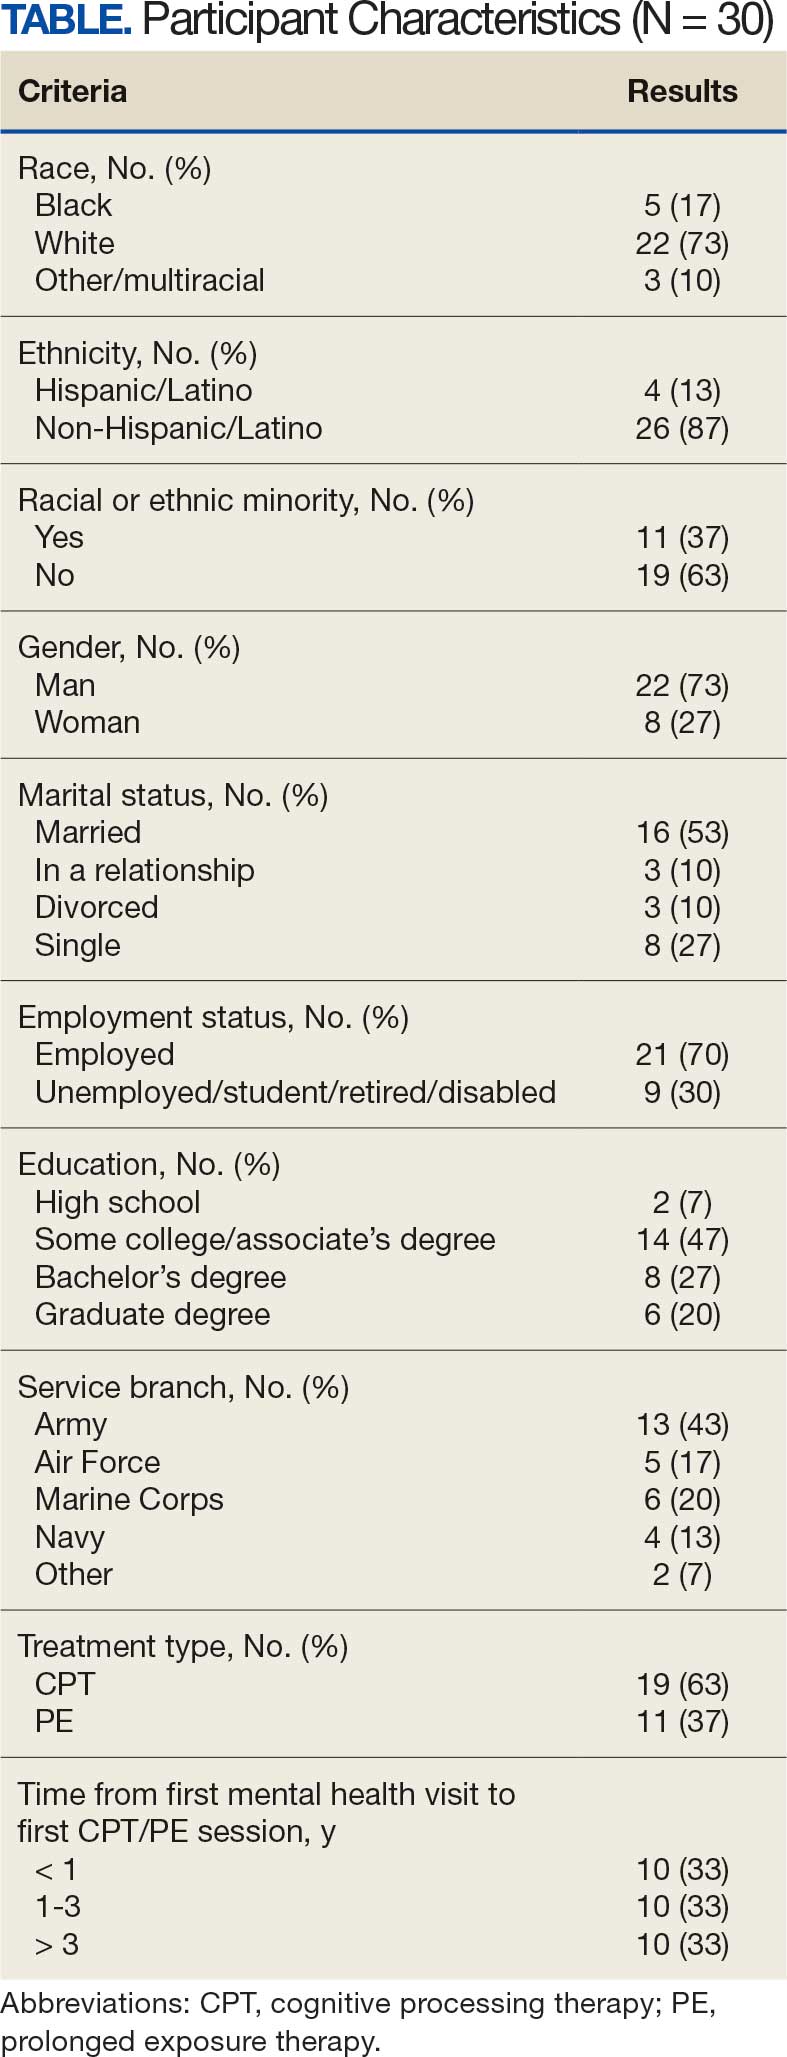
After veterans provided verbal consent for study participation, sociodemographic information was verbally reported, and a 30- to 60-minute semistructured qualitative phone interview was recorded and transcribed. Veterans received $40 for participation. All procedures were approved by the University of California San Francisco Institutional Review Board.
Qualitative Data Analysis
Rapid analysis procedures were used to analyze qualitative data. This approach is suitable for focused, moderately structured qualitative analyses in health services research and facilitates rapid dissemination to stakeholders.23 The qualitative analysts were 2 clinical psychologists with expertise in PTSD treatment (NH primary and RR secondary). Consistent with rapid analysis procedures, analysts prepared a templated summary (including relevant quotations) of each interview, organized by the prespecified content domains. Interviews were summarized independently, compared to ensure consistency, and discrepancies were resolved through review of the interview source materials. Individual summary templates were combined into a master analytic matrix to facilitate the identification of patterns and delineation of themes. Analysts routinely met to identify, discuss, and refine preliminary themes, revisiting source materials to reach consensus as needed.
Results
Fifteen themes were identified and organized into 2 distinct focus areas: themes directly related to the transition to TF-EBP (8 themes) and themes related to veterans’ experiences with TF-EBP and general mental health care with potential process-improvement implications (7 themes).21 Seven themes were identified related to experiences with TF-EBP engagement and VA mental health care. The 7 themes related to TF-EBP engagement and VA mental health care themes are summarized with exemplary quotations.
Veterans want a better understanding of psychotherapy and engaging with VA mental health. Veterans reported that they generally had a poor or “nebulous” understanding about the experience of psychotherapy. For example, veterans exhibited confusion about whether certain experiences were equivalent to participating in psychotherapy. They were sometimes unable to distinguish between interactions such as assessment, disability evaluations, peer support, and psychotherapy. One veteran described a conversation with a TFEBP therapist about prior treatment:
She [asked], have you ever been, or gone through a therapy to begin with? And I, I said, well I just chatted with somebody. And she said that’s not, that’s not therapy. So, I was like, oh, it’s not? That’s not what people do?
Veterans were surprised the VA offered a diverse range of psychotherapy interventions, rather than simply therapy. They did not realize there were different types of psychotherapy. As a result, veterans were not aware that some VA mental practitioners have specialty training and certification to provide treatment matched to specific diagnoses or needs. They thought that all clinicians could provide the same care. One veteran described their understanding:
I just figured all mental health people are mental health people. I didn’t have a better understanding of the system and all the different levels and how it plays out and specialties and things like that. Which, I guess, I should have because you have a primary care doctor, but then you have specialists in all these other different sectors that specialize in one particular area. I guess that should’ve been common sense, but it wasn’t.
Stigma was a barrier to seeking and engaging in mental health care. Veterans discovered they had to overcome stigma associated with seeking and engaging in mental health treatment. Military culture was often discussed as promoting stigma regarding mental health treatment. Specifically, veterans described that seeking treatment meant “either, I’m weak or I’m gonna be seen as weak.” In active-duty settings, the strategy for dealing with mental health symptoms was to “leave those feelings, you push ‘em aside,” an approach highly inconsistent with TF-EBP. In some cases, incorrect information about the VA and PTSD was presented as part of discharge from the military, leading to long-term skepticism of the VA and PTSD treatment. One veteran described his experience as part of a class on the VA compensation and pension assessment process for service-connected disabilities during his military discharge:
[A fellow discharging soldier asked] what about like PTSD, gettin’ rated for PTSD. I hear they take our weapons and stuff like we can’t own firearms and all that stuff. And [the instructor] was like, well, yes that’s a thing. He didn’t explain it like if you get compensated for PTSD you don’t lose your rights to carry a firearm or to have, to be able to go hunting.
Importantly, veterans often described how other identities (eg, race, ethnicity, gender, region of origin) interacted with military culture to enhance stigma. Hearing messaging from multiple sources reinforced beliefs that mental health treatment is inappropriate or is associated with weakness:
As a first-generation Italian, I was always taught keep your feelings to yourself. Never talk outside your family. Never bring up problems to other people and stuff like that. Same with the military. And then the old stigma working in [emergency medical services] and public safety, you’re weak if you get help.
The fundamentals of therapy, including rapport and flexibility, were important. Veterans valued nonspecific therapy factors, genuine empathy, building trust, being honest about treatment, personality, and rapport. These characteristics were almost universally described as particularly important:
I liked the fact that she made it personable and she cared. It wasn’t just like, here, we’re gonna start this. She explained it in the ways I could understand, not in medical terms, so to speak, but that’s what I liked about her. She really cared about what she did and helping me.
Flexibility was viewed as an asset, particularly when clinicians acknowledged veteran autonomy. A consistent example was when veterans were able to titrate trauma disclosure. One veteran described this flexible treatment experience: “She was right there in the room, she said, you know, at any time, you know, we could stop, we could debrief.”
Experiences of clinician flexibility and personalization of therapy were contrasted with experiences of overly rigid therapy. Overemphasis on protocols created barriers, often because treatment did not feel personalized. One veteran described how a clinician’s task-oriented approach interfered with their ability to engage in TF-EBP:
They listened, but it just didn’t seem like they were listening, because they really wanted to stay on task… So, I felt like if the person was more concerned, or more sympathetic to the things that was also going on in my life at that present time, I think I would’ve felt more comfortable talking about what was the PTSD part, too.
Veterans valued shared decision-making prior to TF-EBP initiation. Veterans typically described being involved in a shared decision-making process prior to initiating TF-EBP. During these sessions, clinicians discussed treatment options and provided veterans with a variety of materials describing treatments (eg, pamphlets, websites, videos, statistics). Most veterans appreciated being able to reflect on and discuss treatment options with their clinicians. Being given time in and out of session to review was viewed as valuable and increased confidence in treatment choice. One veteran described their experience:
I was given the information, you know, they gave me handouts, PDFs, whatever was available, and let me read over it. I didn’t have to choose anything right then and there, you know, they let me sleep on it. And I got back to them after some thought.
However, some veterans felt overwhelmed by being presented with too much information and did not believe they knew enough to make a final treatment decision. One veteran described being asked to contribute to the treatment decision:
I definitely asked [the clinician] to weigh in on maybe what he thought was best, because—I mean, I don’t know… I’m not necessarily sure I know what I think is best. I think we’re just lucky I’m here, so if you can give me a solid and help me out here by telling me just based on what I’ve said to you and the things that I’ve gone through, what do you think?
Veterans who perceived that their treatment preferences were respected had a positive outlook on TF-EBP. As part of the shared-decision making process, veterans typically described being given choices among PTSD treatments. One way that preferences were respected was through clinicians tailoring treatment descriptions to a veteran’s unique symptoms, experiences, and values. In these cases, clinicians observed specific concerns and clearly linked treatment principles to those concerns. For example, one veteran described their clinician’s recommendation for PE: “The hardest thing for me is to do the normal things like grocery store or getting on a train or anything like that. And so, he suggested that [PE] would be a good idea.”
In other cases, veterans wanted the highest quality of treatment rather than a match between treatment principles and the veteran’s presentation, goals, or strengths. These veterans wanted the best treatment available for PTSD and valued research support, recommendations from clinical practice guidelines, or clinician confidence in the effectiveness of the treatment. One veteran described this perspective:
I just wanted to be able to really tackle it in the best way possible and in the most like aggressive way possible. And it seemed like PE really was going to, they said that it’s a difficult type of therapy, but I really just wanted to kind of do the best that I could to eradicate some of the issues that I was having.
When veterans perceived a lack of respect for their preferences, they were hesitant about TF-EBP. For some veterans, a generic pitch for a TF-EBP was detrimental in the absence of the personal connection between the treatment and their own symptoms, goals, or strengths. These veterans did not question whether the treatment was effective in general but did question whether the treatment was best for them. One veteran described the contrast between their clinician’s perspective and their own.
I felt like they felt very comfortable, very confident in [CPT] being the program, because it was comfortable for them. Because they did it several times. And maybe they had a lot of success with other individuals... but they were very comfortable with that one, as a provider, more than: Is this the best fit for [me]?
Some veterans perceived little concern for their preferences and a lack of choice in available treatments, which tended to perpetuate negative perceptions of TFEBP. These veterans described their lack of choices with frustration. Alternatives to TFEBP were described by these veterans as so undesirable that they did not believe they had a real choice:
[CPT] was the only decision they had. There was nothing else for PTSD. They didn’t offer anything else. So, I mean it wasn’t a decision. It was either … take treatment or don’t take treatment at all… Actually, I need to correct myself. So, there were 2 options, group therapy or CPT. I forgot about that. I’m not a big group guy so I chose the CPT.
Another veteran was offered a choice between therapeutic approaches, but all were delivered via telehealth (consistent with the transition to virtual services during the COVID-19 pandemic). For this veteran, not only was the distinction between approaches unclear, but the choice between approaches was unimportant compared to the mode of delivery.
This happened during COVID-19 and VA stopped seeing anybody physically, face-to-face. So my only option for therapy was [telehealth]… There was like 3 of them, and I tried to figure out, you know, from the layperson’s perspective, like: I don’t know which one to go with.
Veterans wanted to be asked about their cultural identity. Veterans valued when clinicians asked questions about cultural identity as part of their mental health treatment and listened to their cultural context. Cultural identity factors extended beyond factors such as race, ethnicity, gender, and sexual orientation to religion, military culture, and regionality. Veterans often described situations where they wished clinicians would ask the question or initiate conversations about culture. A veteran highlighted the importance of their faith but noted that it was a taboo topic. Their clinician did not say “we don’t go there,” but they “never dove into it either.” Another veteran expressed a desire for their clinician to ask questions about experiences in the National Guard and as an African American veteran:
If a provider was to say like: Oh, you know, it’s a stressful situation being a part of the military, being in the National Guard. You know, just asking questions about that. I think that would really go a long way… Being African American was difficult as well. And more so because of my region, I think… I felt like it would probably be an uncomfortable subject to speak on… I mean, it wasn’t anything that my providers necessarily did, it was more so just because it wasn’t brought up.
One common area of concern for veterans was a match between veteran and therapist demographics. When asked about how their cultural identity influenced treatment, several veterans described the relevance of therapist match. Much like questions about their own cultural identity, veterans valued being asked about identity preferences in clinicians (eg, gender or race matching), rather than having to bring up the preference themselves. One veteran described relief at this question being asked directly: “I was relieved when she had asked [whether I wanted a male or female clinician] primarily because I was going to ask that or bring that up somehow. But her asking that before me was a weight off my shoulders.”
Discussing cultural identity through treatment strengthened veterans’ engagement in therapy. Many veterans appreciated when analogies used in therapy were relevant to their cultural experiences and when clinicians understood their culture (eg, military culture, race, ethnicity, religious beliefs, sexual orientation). One veteran described how their clinician understood military culture and made connections between military culture and the rationale for TF-EBP, which strengthened the veteran’s buy-in for the treatment and alliance with the clinician:
At the beginning when she was explaining PTSD, and I remember she said that your brain needed to think this way when you were in the military because it was a way of protecting and surviving, so your brain was doing that in order for you to survive in whatever areas you were because there was danger. So, your brain had you thinking that way. But now, you’re not in those situations anymore. You’re not in danger. You’re not in the military, but your brain is still thinking you are, and that’s what PTSD generally does to you.
Specific elements of TF-EBP also provided opportunities to discuss and integrate important aspects of identity. This is accomplished in PE by assigning relevant in vivo exercises. In CPT, “connecting the dots” on how prior experiences influenced trauma-related stuck points achieved this element. One veteran described their experience with a clinician who was comfortable discussing the veteran’s sexual orientation and recognized the impacts of prior trauma on intimacy:
They’re very different, and there’s a lot of things that can be accepted in gay relationships that are not in straight ones. With all that said, I think [the PE therapist] did a fantastic job being not—like never once did she laugh or make an uncomfortable comment or say she didn’t wanna talk about something when like part of the reason I wanted to get into therapy is that my partner and I weren’t having sex unless I used alcohol.
Discussion
As part of a larger national qualitative investigation of the experiences of veterans who recently initiated TF-EBP, veterans discussed their experiences with therapy and mental health care that have important implications for continued process improvement.21 Three key areas for continued process improvement were identified: (1) providing information about the diverse range of mental health care services at the VA and the implications of this continuum of care; (2) consideration of veteran preferences in treatment decision-making, including the importance of perceived choice; and (3) incorporating cultural assessment and cultural responsiveness into case conceptualization and treatment.
One area of process improvement identified was increasing knowledge about different types of psychotherapy and the continuum of care available at the VA. Veterans in this study confused or conflated participating in psychotherapy with talking about mental health symptoms with a clinician (eg, assessment, disability evaluation). They were sometimes surprised that psychotherapy is an umbrella term referring to a variety of different modalities. The downstream impact of these misunderstandings was a perception of VA mental health care as nebulous. Veterans were surprised that all mental health practitioners were unable to provide the same care. Confusion may have been compounded by highly variable referral processes across VA.24 To address this, clinicians have developed local educational resources and handouts for both veterans and referring clinicians from nonmental health and general mental health specialties.25 Given the variability in referral processes both between and within VA medical centers, national dissemination of these educational materials may be more difficult compared to materials for TF-EBPs.24 The VA started to use behavioral health interdisciplinary program (BHIP) teams, which are designed to be clinical homes for veterans connected with a central clinician who can explain and coordinate their mental health care as well as bring more consistency to the referral process.26 The ongoing transition toward the BHIP model of mental health care at VA may provide the opportunity to consolidate and integrate knowledge about the VA approach to mental health care, potentially filling knowledge gaps.
A second area of process improvement focused on the shared decision-making process. Consistent with mental health initiatives, veterans generally believed they had received sufficient information about TF-EBP and engaged in shared decision-making with clinicians.20,27 Veterans were given educational materials to review and had the opportunity to discuss these materials with clinicians. However, veterans described variability in the success of shared decision-making. Although veterans valued receiving accurate, comprehensible information to support treatment decisions, some preferred to defer to clinicians’ expertise regarding which treatment to pursue. While these veterans valued information, they also valued the expertise of clinicians in explaining why specific treatments would be beneficial. A key contributor to veterans satisfaction was assessing how veterans wanted to engage in the decision-making process and respecting those preferences.28 Veterans approached shared decision-making differently, from making decisions independently after receiving information to relying solely on clinician recommendation. The process was most successful when clinicians articulated how their recommended treatment aligned with a veteran’s preferences, including recommendations based on specific values (eg, personalized match vs being the best). Another important consideration is ensuring veterans know they can receive a variety of different types of mental health services available in different modalities (eg, virtual vs in-person; group vs individual). When veterans did not perceive choice in treatment aspects important to them (typically despite having choices), they were less satisfied with their TF-EBP experience.
A final area of process improvement identified involves how therapists address important aspects of culture. Veterans often described mental health stigma coming from intersecting cultural identities and expressed appreciation when therapists helped them recognize the impact of these beliefs on treatment. Some veterans did not discuss important aspects of their identity with clinicians, including race/ethnicity, religion, and military culture. Veterans did not report negative interactions with clinicians or experiences suggesting it was inappropriate to discuss identity; however, they were reluctant to independently raise these identity factors. Strategies such as the ADDRESSING framework, a mnemonic acronym that describes a series of potentially relevant characteristics, can help clinicians comprehensively consider different aspects that may be relevant to veterans, modeling that discussion of relevant these characteristics is welcome in TF-EBP.29 Veterans reported that making culturally relevant connections enhanced the TF-EBP experience, most commonly with military culture. These data support that TF-EBP delivery with attention to culture should be an integrated part of treatment, supporting engagement and therapeutic alliance.30 The VA National Center for PTSD consultation program is a resource to support clinicians in assessing and incorporating relevant aspects of cultural identity.31 For example, the National Center for PTSD provides a guide for using case conceptualization to address patient reactions to race-based violence during PTSD treatment.32 Both manualized design and therapist certification training can reinforce that assessing and attending to case conceptualization (including identity factors) is an integral component of TF-EBP.33,34
Limitations
While the current study has numerous strengths (eg, national veteran sampling, robust qualitative methods), results should be considered within the context of study limitations. First, veteran participants all received TF-EBP, and the perspectives of veterans who never initiate TF-EBP may differ. Despite the strong sampling approach, the study design is not intended to be generalizable to all veterans receiving TF-EBP for PTSD. Qualitative analysis yielded 15 themes, described in this study and prior research, consistent with recommendations.21,22 This approach allows rich description of distinct focus areas that would not be possible in a single manuscript. Nonetheless, all veterans interviewed described their experiences in TF-EBP and general mental health care, the focus of the semistructured interview guide was on the experience of transitioning from other treatment to TF-EBP.
Conclusion
This study describes themes related to general mental health and TF-EBP process improvement as part of a larger study on transitions in PTSD care.21,22 Veterans valued the fundamentals of therapy, including rapport and flexibility. Treatment-specific rapport (eg, pointing out treatment progress and effort in completing treatment components) and flexibility within the context of fidelity (ie, personalizing treatment while maintaining core treatment elements) may be most effective at engaging veterans in recommended PTSD treatments.18,34 In addition to successes, themes suggest multiple opportunities for process improvement. Ongoing VA initiatives and priorities (ie, BHIP, shared decision-making, consultation services) aim to improve processes consistent with veteran recommendations. Future research is needed to evaluate the success of these and other programs to optimize access to and engagement in recommended PTSD treatments.
- US Department of Veterans Affairs; US Department of Defense. VA/DoD clinical practice guideline for the management of posttraumatic stress disorder and acute stress disorder. 2023. Updated August 20, 2025. Accessed October 17, 2025. https://www.healthquality.va.gov/guidelines/MH/ptsd/
- International Society for Traumatic Stress Studies. ISTSS PTSD prevention and treatment guidelines: methodology and recommendations. Accessed August 13, 2025. http://www.istss.org/getattachment/Treating-Trauma/New-ISTSS-Prevention-and-TreatmentGuidelines/ISTSS_PreventionTreatmentGuidelines_FNL-March-19-2019.pdf.aspx
- American Psychological Association. Clinical practice guideline for the treatment of posttraumatic stress disorder in adults. Accessed August 13, 2025. https://www.apa.org/ptsd-guideline/ptsd.pdf
- Karlin BE, Cross G. From the laboratory to the therapy room: National dissemination and implementation of evidence- based psychotherapies in the U.S. Department of Veterans Affairs Health Care System. Am Psychol. 2014;69:19-33. doi:10.1037/a0033888
- Rosen CS, Matthieu MM, Wiltsey Stirman S, et al. A review of studies on the system-wide implementation of evidencebased psychotherapies for posttraumatic stress disorder in the Veterans Health Administration. Adm Policy Ment Health. 2016;43:957-977. doi:10.1007/s10488-016-0755-0
- Maguen S, Holder N, Madden E, et al. Evidence-based psychotherapy trends among posttraumatic stress disorder patients in a national healthcare system, 2001-2014. Depress Anxiety. 2020;37:356-364. doi:10.1002/da.22983
- Cheney AM, Koenig CJ, Miller CJ, et al. Veteran-centered barriers to VA mental healthcare services use. BMC Health Serv Res. 2018;18:591. doi:10.1186/s12913-018-3346-9
- Hundt NE, Mott JM, Miles SR, et al. Veterans’ perspectives on initiating evidence-based psychotherapy for posttraumatic stress disorder. Psychol Trauma. 2015;7:539-546. doi:10.1037/tra0000035
- Hundt NE, Helm A, Smith TL, et al. Failure to engage: a qualitative study of veterans who decline evidence-based psychotherapies for PTSD. Psychol Serv. 2018;15:536- 542. doi:10.1037/ser0000212
- Sayer NA, Friedemann-Sanchez G, Spoont M, et al. A qualitative study of determinants of PTSD treatment initiation in veterans. Psychiatry. 2009;72:238-255. doi:10.1521/psyc.2009.72.3.238
- Mittal D, Drummond KL, Blevins D, et al. Stigma associated with PTSD: perceptions of treatment seeking combat veterans. Psychiatr Rehabil J. 2013;36:86-92. doi:10.1037/h0094976
- Possemato K, Wray LO, Johnson E, et al. Facilitators and barriers to seeking mental health care among primary care veterans with posttraumatic stress disorder. J Trauma Stress. 2018;31:742-752. doi:10.1002/jts.22327
- Silvestrini M, Chen JA. “It’s a sign of weakness”: Masculinity and help-seeking behaviors among male veterans accessing posttraumatic stress disorder care. Psychol Trauma. 2023;15:665-671. doi:10.1037/tra0001382
- Stecker T, Shiner B, Watts BV, et al. Treatment-seeking barriers for veterans of the Iraq and Afghanistan conflicts who screen positive for PTSD. Psychiatr Serv. 2013;64:280-283. doi:10.1176/appi.ps.001372012
- Etingen B, Grubbs KM, Harik JM. Drivers of preference for evidence-based PTSD treatment: a qualitative assessment. Mil Med. 2020;185:303-310. doi:10.1093/milmed/usz220
- Hundt NE, Ecker AH, Thompson K, et al. “It didn’t fit for me:” A qualitative examination of dropout from prolonged exposure and cognitive processing therapy in veterans. Psychol Serv. 2020;17:414-421. doi:10.1037/ser0000316
- Kehle-Forbes SM, Gerould H, Polusny MA, et al. “It leaves me very skeptical” messaging in marketing prolonged exposure and cognitive processing therapy to veterans with PTSD. Psychol Trauma. 2022;14:849-852. doi:10.1037/tra0000550
- Kehle-Forbes SM, Ackland PE, Spoont MR, et al. Divergent experiences of U.S. veterans who did and did not complete trauma-focused therapies for PTSD: a national qualitative study of treatment dropout. Behav Res Ther. 2022;154:104123. doi:10.1016/j.brat.2022.104123
- Hessinger JD, London MJ, Baer SM. Evaluation of a shared decision-making intervention on the utilization of evidence-based psychotherapy in a VA outpatient PTSD clinic. Psychol Serv. 2018;15:437-441. doi:10.1037/ser0000141
- Hamblen JL, Grubbs KM, Cole B, et al. “Will it work for me?” Developing patient-friendly graphical displays of posttraumatic stress disorder treatment effectiveness. J Trauma Stress. 2022;35:999-1010. doi:10.1002/jts.22808
- Holder N, Ranney RM, Delgado AK, et al. Transitioning into trauma-focused evidence-based psychotherapy for posttraumatic stress disorder from other treatments: a qualitative investigation. Cogn Behav Ther. 2025;54:391-407. doi:10.1080/16506073.2024.2408386
- Levitt HM, Bamberg M, Creswell JW, et al. Journal article reporting standards for qualitative primary, qualitative meta-analytic, and mixed methods research in psychology: The APA Publications and Communications Board task force report. Am Psychol. 2018;73:26-46. doi:10.1037/amp0000151
- Palinkas LA, Mendon SJ, Hamilton AB. Innovations in mixed methods evaluations. Annu Rev Public Health. 2019;40:423- 442. doi:10.1146/annurev-publhealth-040218-044215
- Ranney RM, Cordova MJ, Maguen S. A review of the referral process for evidence-based psychotherapies for PTSD among veterans. Prof Psychol Res Pr. 2022;53:276-285. doi:10.1037/pro0000463
- Holder N, Ranney RM, Delgado AK, et al. Transitions to trauma-focused evidence-based psychotherapy for posttraumatic stress disorder from other treatment: a qualitative investigation of clinician’s perspectives. Cogn Behav Ther. 2025;1-19. doi:10.1080/16506073.2025.2481475
- Barry CN, Abraham KM, Weaver KR, et al. Innovating team-based outpatient mental health care in the Veterans Health Administration: staff-perceived benefits and challenges to pilot implementation of the Behavioral Health Interdisciplinary Program (BHIP). Psychol Serv. 2016;13:148-155. doi:10.1037/ser0000072
- Harik JM, Hundt NE, Bernardy NC, et al. Desired involvement in treatment decisions among adults with PTSD symptoms. J Trauma Stress. 2016;29:221-228. doi:10.1002/jts.22102
- Larsen SE, Hooyer K, Kehle-Forbes SM, et al. Patient experiences in making PTSD treatment decisions. Psychol Serv. 2024;21:529-537. doi:10.1037/ser0000817
- Hays PA. Four steps toward intersectionality in psychotherapy using the ADDRESSING framework. Prof Psychol Res Pr. 2024;55:454-462. doi:10.1037/pro0000577
- Galovski TE, Nixon RDV, Kaysen D. Flexible Applications of Cognitive Processing Therapy: Evidence-Based Treatment Methods. Academic Press; 2020.
- Larsen SE, McKee T, Fielstein E, et al. The development of a posttraumatic stress disorder (PTSD) consultation program to support system-wide implementation of high-quality PTSD care for veterans. Psychol Serv. 2025;22:342-348. doi:10.1037/ser0000867
- Galovski T, Kaysen D, McClendon J, et al. Provider guide to addressing patient reactions to race-based violence during PTSD treatment. PTSD.va.gov. Accessed August 3, 2025. www.ptsd.va.gov/professional/treat/specific/patient_reactions_race_violence.asp
- Galovski TE, Nixon RDV, Kehle-Forbes S. Walking the line between fidelity and flexibility: a conceptual review of personalized approaches to manualized treatments for posttraumatic stress disorder. J Trauma Stress. 2024;37:768-774. doi:10.1002/jts.23073
- Galovski TE, McSweeney LB, Nixon RDV, et al. Personalizing cognitive processing therapy with a case formulation approach to intentionally target impairment in psychosocial functioning associated with PTSD. Contemp Clin Trials Commun. 2024;42:101385. doi:10.1016/j.conctc.2024.101385
Trauma-focused evidence-based psychotherapies (TF-EBPs), including cognitive processing therapy (CPT) and prolonged exposure therapy (PE), are recommended treatments for posttraumatic stress disorder (PTSD) in clinical practice guidelines.1-3 To increase initiation of these treatments, the US Department of Veterans Affairs (VA) used a large-scale dissemination and implementation effort to improve access to TF-EBP.4,5 These efforts achieved modest success, increasing prevalence of TF-EBP from a handful of veterans in 2004 to an annual prevalence of 14.6% for CPT and 4.3% for PE in 2014.6
Throughout these efforts, qualitative studies have been used to better understand veterans’ perspectives on receiving TF-EBP care.7-18 Barriers to initiation of and engagement in TF-EBP and PTSD care have been identified from these qualitative studies. One identified barrier was lack of knowledge—particularly lack of knowledge about what is meant by a PTSD diagnosis and available treatments.7-10 Stigma (ie, automatic negative associations) toward mental health problems or seeking mental health care also has been identified as a barrier to initiation.7,10-14 Perceptions of poor alignment between treatment and veteran goals, including lack of buy-in for the rationale, served as barriers to initiation and engagement.8,15-18
Using prior qualitative work, numerous initiatives have been developed to reduce stigma, facilitate conversations about how treatment aligns with goals, and fill knowledge gaps, particularly through online resources and shared decision-making.19,20 To better inform the state of veterans’ experiences with TF-EBP, a qualitative investigation was conducted involving veterans who recently initiated TF-EBP. Themes directly related to transitions to TF-EBP were identified; however, all veterans interviewed also described their experiences with TFEBP engagement and mental health care. Consistent with recommendations for qualitative methods, this study extends prior work on transitions to TF-EBP by describing themes with a distinct focus on the experience of engaging with TF-EBP and mental health care.21,22
Methods
The experiences of veterans who were transitioning into TF-EBPs were collected in semistructured interviews and analyzed. The semistructured interview guide was developed and refined in consultation with both qualitative methods experts and PTSD treatment experts to ensure that 6 content domains were appropriately queried: PTSD treatment options, cultural sensitivity of treatment, PTSD treatment selection, transition criteria, beliefs about stabilization treatment, and treatment needs/preferences.
Participants were identified using the VA Corporate Data Warehouse and included post-9/11 veterans who had recently initiated CPT or PE for the first time between September 1, 2021, and September 1, 2022. More details of participant selection are available in Holder et al.21 From a population of 10,814 patients, stratified random sampling generated a recruitment pool of 200 veterans for further outreach. The strata were defined such that this recruitment pool had similar proportions of demographic characteristics (ie, gender, race, ethnicity) to the population of eligible veterans, equivalent distributions of time to CPT or PE initiation (ie, 33.3% < 1 year, 33.3% 1-3 years, and 33.3% > 3 years), and adequate variability in TF-EBP type (ie, 66.7% CPT, 33.3% PE). A manual chart review in the recruitment pool excluded 12 veterans who did not initiate CPT or PE, 1 veteran with evidence of current active psychosis and/or cognitive impairment that would likely preclude comprehension of study materials, and 1 who was deceased.
Eligible veterans from the recruitment pool were contacted in groups of 25. First, a recruitment letter with study information and instructions to opt-out of further contact was mailed or emailed to veterans. After 2 weeks, veterans who had not responded were contacted by phone up to 3 times. Veterans interested in participating were scheduled for a 1-time visit that included verbal consent and the qualitative interview. Metrics were established a priori to ensure an adequately diverse and inclusive sample. Specifically, a minimum number of racial and/or ethnic minority veterans (33%) and women veterans (20%) were sought. Equal distribution across the 3 categories of time from first mental health visit to CPT/PE initiation also was targeted. Throughout enrollment, recruitment efforts were adapted to meet these metrics in the emerging sample. While the goal was to generate a diverse and inclusive sample using these methods, the sample was not intended to be representative of the population.
Of the 186 eligible participants, 21 declined participation and 26 could not be reached. The targeted sample was reached after exhausting contact for 47 veterans and contacting 80 veterans for a final response rate of 40% among fully contacted veterans and 27% among veterans with any contact. The final sample included 30 veterans who received CPT or PE in VA facilities (Table).
After veterans provided verbal consent for study participation, sociodemographic information was verbally reported, and a 30- to 60-minute semistructured qualitative phone interview was recorded and transcribed. Veterans received $40 for participation. All procedures were approved by the University of California San Francisco Institutional Review Board.
Qualitative Data Analysis
Rapid analysis procedures were used to analyze qualitative data. This approach is suitable for focused, moderately structured qualitative analyses in health services research and facilitates rapid dissemination to stakeholders.23 The qualitative analysts were 2 clinical psychologists with expertise in PTSD treatment (NH primary and RR secondary). Consistent with rapid analysis procedures, analysts prepared a templated summary (including relevant quotations) of each interview, organized by the prespecified content domains. Interviews were summarized independently, compared to ensure consistency, and discrepancies were resolved through review of the interview source materials. Individual summary templates were combined into a master analytic matrix to facilitate the identification of patterns and delineation of themes. Analysts routinely met to identify, discuss, and refine preliminary themes, revisiting source materials to reach consensus as needed.
Results
Fifteen themes were identified and organized into 2 distinct focus areas: themes directly related to the transition to TF-EBP (8 themes) and themes related to veterans’ experiences with TF-EBP and general mental health care with potential process-improvement implications (7 themes).21 Seven themes were identified related to experiences with TF-EBP engagement and VA mental health care. The 7 themes related to TF-EBP engagement and VA mental health care themes are summarized with exemplary quotations.
Veterans want a better understanding of psychotherapy and engaging with VA mental health. Veterans reported that they generally had a poor or “nebulous” understanding about the experience of psychotherapy. For example, veterans exhibited confusion about whether certain experiences were equivalent to participating in psychotherapy. They were sometimes unable to distinguish between interactions such as assessment, disability evaluations, peer support, and psychotherapy. One veteran described a conversation with a TFEBP therapist about prior treatment:
She [asked], have you ever been, or gone through a therapy to begin with? And I, I said, well I just chatted with somebody. And she said that’s not, that’s not therapy. So, I was like, oh, it’s not? That’s not what people do?
Veterans were surprised the VA offered a diverse range of psychotherapy interventions, rather than simply therapy. They did not realize there were different types of psychotherapy. As a result, veterans were not aware that some VA mental practitioners have specialty training and certification to provide treatment matched to specific diagnoses or needs. They thought that all clinicians could provide the same care. One veteran described their understanding:
I just figured all mental health people are mental health people. I didn’t have a better understanding of the system and all the different levels and how it plays out and specialties and things like that. Which, I guess, I should have because you have a primary care doctor, but then you have specialists in all these other different sectors that specialize in one particular area. I guess that should’ve been common sense, but it wasn’t.
Stigma was a barrier to seeking and engaging in mental health care. Veterans discovered they had to overcome stigma associated with seeking and engaging in mental health treatment. Military culture was often discussed as promoting stigma regarding mental health treatment. Specifically, veterans described that seeking treatment meant “either, I’m weak or I’m gonna be seen as weak.” In active-duty settings, the strategy for dealing with mental health symptoms was to “leave those feelings, you push ‘em aside,” an approach highly inconsistent with TF-EBP. In some cases, incorrect information about the VA and PTSD was presented as part of discharge from the military, leading to long-term skepticism of the VA and PTSD treatment. One veteran described his experience as part of a class on the VA compensation and pension assessment process for service-connected disabilities during his military discharge:
[A fellow discharging soldier asked] what about like PTSD, gettin’ rated for PTSD. I hear they take our weapons and stuff like we can’t own firearms and all that stuff. And [the instructor] was like, well, yes that’s a thing. He didn’t explain it like if you get compensated for PTSD you don’t lose your rights to carry a firearm or to have, to be able to go hunting.
Importantly, veterans often described how other identities (eg, race, ethnicity, gender, region of origin) interacted with military culture to enhance stigma. Hearing messaging from multiple sources reinforced beliefs that mental health treatment is inappropriate or is associated with weakness:
As a first-generation Italian, I was always taught keep your feelings to yourself. Never talk outside your family. Never bring up problems to other people and stuff like that. Same with the military. And then the old stigma working in [emergency medical services] and public safety, you’re weak if you get help.
The fundamentals of therapy, including rapport and flexibility, were important. Veterans valued nonspecific therapy factors, genuine empathy, building trust, being honest about treatment, personality, and rapport. These characteristics were almost universally described as particularly important:
I liked the fact that she made it personable and she cared. It wasn’t just like, here, we’re gonna start this. She explained it in the ways I could understand, not in medical terms, so to speak, but that’s what I liked about her. She really cared about what she did and helping me.
Flexibility was viewed as an asset, particularly when clinicians acknowledged veteran autonomy. A consistent example was when veterans were able to titrate trauma disclosure. One veteran described this flexible treatment experience: “She was right there in the room, she said, you know, at any time, you know, we could stop, we could debrief.”
Experiences of clinician flexibility and personalization of therapy were contrasted with experiences of overly rigid therapy. Overemphasis on protocols created barriers, often because treatment did not feel personalized. One veteran described how a clinician’s task-oriented approach interfered with their ability to engage in TF-EBP:
They listened, but it just didn’t seem like they were listening, because they really wanted to stay on task… So, I felt like if the person was more concerned, or more sympathetic to the things that was also going on in my life at that present time, I think I would’ve felt more comfortable talking about what was the PTSD part, too.
Veterans valued shared decision-making prior to TF-EBP initiation. Veterans typically described being involved in a shared decision-making process prior to initiating TF-EBP. During these sessions, clinicians discussed treatment options and provided veterans with a variety of materials describing treatments (eg, pamphlets, websites, videos, statistics). Most veterans appreciated being able to reflect on and discuss treatment options with their clinicians. Being given time in and out of session to review was viewed as valuable and increased confidence in treatment choice. One veteran described their experience:
I was given the information, you know, they gave me handouts, PDFs, whatever was available, and let me read over it. I didn’t have to choose anything right then and there, you know, they let me sleep on it. And I got back to them after some thought.
However, some veterans felt overwhelmed by being presented with too much information and did not believe they knew enough to make a final treatment decision. One veteran described being asked to contribute to the treatment decision:
I definitely asked [the clinician] to weigh in on maybe what he thought was best, because—I mean, I don’t know… I’m not necessarily sure I know what I think is best. I think we’re just lucky I’m here, so if you can give me a solid and help me out here by telling me just based on what I’ve said to you and the things that I’ve gone through, what do you think?
Veterans who perceived that their treatment preferences were respected had a positive outlook on TF-EBP. As part of the shared-decision making process, veterans typically described being given choices among PTSD treatments. One way that preferences were respected was through clinicians tailoring treatment descriptions to a veteran’s unique symptoms, experiences, and values. In these cases, clinicians observed specific concerns and clearly linked treatment principles to those concerns. For example, one veteran described their clinician’s recommendation for PE: “The hardest thing for me is to do the normal things like grocery store or getting on a train or anything like that. And so, he suggested that [PE] would be a good idea.”
In other cases, veterans wanted the highest quality of treatment rather than a match between treatment principles and the veteran’s presentation, goals, or strengths. These veterans wanted the best treatment available for PTSD and valued research support, recommendations from clinical practice guidelines, or clinician confidence in the effectiveness of the treatment. One veteran described this perspective:
I just wanted to be able to really tackle it in the best way possible and in the most like aggressive way possible. And it seemed like PE really was going to, they said that it’s a difficult type of therapy, but I really just wanted to kind of do the best that I could to eradicate some of the issues that I was having.
When veterans perceived a lack of respect for their preferences, they were hesitant about TF-EBP. For some veterans, a generic pitch for a TF-EBP was detrimental in the absence of the personal connection between the treatment and their own symptoms, goals, or strengths. These veterans did not question whether the treatment was effective in general but did question whether the treatment was best for them. One veteran described the contrast between their clinician’s perspective and their own.
I felt like they felt very comfortable, very confident in [CPT] being the program, because it was comfortable for them. Because they did it several times. And maybe they had a lot of success with other individuals... but they were very comfortable with that one, as a provider, more than: Is this the best fit for [me]?
Some veterans perceived little concern for their preferences and a lack of choice in available treatments, which tended to perpetuate negative perceptions of TFEBP. These veterans described their lack of choices with frustration. Alternatives to TFEBP were described by these veterans as so undesirable that they did not believe they had a real choice:
[CPT] was the only decision they had. There was nothing else for PTSD. They didn’t offer anything else. So, I mean it wasn’t a decision. It was either … take treatment or don’t take treatment at all… Actually, I need to correct myself. So, there were 2 options, group therapy or CPT. I forgot about that. I’m not a big group guy so I chose the CPT.
Another veteran was offered a choice between therapeutic approaches, but all were delivered via telehealth (consistent with the transition to virtual services during the COVID-19 pandemic). For this veteran, not only was the distinction between approaches unclear, but the choice between approaches was unimportant compared to the mode of delivery.
This happened during COVID-19 and VA stopped seeing anybody physically, face-to-face. So my only option for therapy was [telehealth]… There was like 3 of them, and I tried to figure out, you know, from the layperson’s perspective, like: I don’t know which one to go with.
Veterans wanted to be asked about their cultural identity. Veterans valued when clinicians asked questions about cultural identity as part of their mental health treatment and listened to their cultural context. Cultural identity factors extended beyond factors such as race, ethnicity, gender, and sexual orientation to religion, military culture, and regionality. Veterans often described situations where they wished clinicians would ask the question or initiate conversations about culture. A veteran highlighted the importance of their faith but noted that it was a taboo topic. Their clinician did not say “we don’t go there,” but they “never dove into it either.” Another veteran expressed a desire for their clinician to ask questions about experiences in the National Guard and as an African American veteran:
If a provider was to say like: Oh, you know, it’s a stressful situation being a part of the military, being in the National Guard. You know, just asking questions about that. I think that would really go a long way… Being African American was difficult as well. And more so because of my region, I think… I felt like it would probably be an uncomfortable subject to speak on… I mean, it wasn’t anything that my providers necessarily did, it was more so just because it wasn’t brought up.
One common area of concern for veterans was a match between veteran and therapist demographics. When asked about how their cultural identity influenced treatment, several veterans described the relevance of therapist match. Much like questions about their own cultural identity, veterans valued being asked about identity preferences in clinicians (eg, gender or race matching), rather than having to bring up the preference themselves. One veteran described relief at this question being asked directly: “I was relieved when she had asked [whether I wanted a male or female clinician] primarily because I was going to ask that or bring that up somehow. But her asking that before me was a weight off my shoulders.”
Discussing cultural identity through treatment strengthened veterans’ engagement in therapy. Many veterans appreciated when analogies used in therapy were relevant to their cultural experiences and when clinicians understood their culture (eg, military culture, race, ethnicity, religious beliefs, sexual orientation). One veteran described how their clinician understood military culture and made connections between military culture and the rationale for TF-EBP, which strengthened the veteran’s buy-in for the treatment and alliance with the clinician:
At the beginning when she was explaining PTSD, and I remember she said that your brain needed to think this way when you were in the military because it was a way of protecting and surviving, so your brain was doing that in order for you to survive in whatever areas you were because there was danger. So, your brain had you thinking that way. But now, you’re not in those situations anymore. You’re not in danger. You’re not in the military, but your brain is still thinking you are, and that’s what PTSD generally does to you.
Specific elements of TF-EBP also provided opportunities to discuss and integrate important aspects of identity. This is accomplished in PE by assigning relevant in vivo exercises. In CPT, “connecting the dots” on how prior experiences influenced trauma-related stuck points achieved this element. One veteran described their experience with a clinician who was comfortable discussing the veteran’s sexual orientation and recognized the impacts of prior trauma on intimacy:
They’re very different, and there’s a lot of things that can be accepted in gay relationships that are not in straight ones. With all that said, I think [the PE therapist] did a fantastic job being not—like never once did she laugh or make an uncomfortable comment or say she didn’t wanna talk about something when like part of the reason I wanted to get into therapy is that my partner and I weren’t having sex unless I used alcohol.
Discussion
As part of a larger national qualitative investigation of the experiences of veterans who recently initiated TF-EBP, veterans discussed their experiences with therapy and mental health care that have important implications for continued process improvement.21 Three key areas for continued process improvement were identified: (1) providing information about the diverse range of mental health care services at the VA and the implications of this continuum of care; (2) consideration of veteran preferences in treatment decision-making, including the importance of perceived choice; and (3) incorporating cultural assessment and cultural responsiveness into case conceptualization and treatment.
One area of process improvement identified was increasing knowledge about different types of psychotherapy and the continuum of care available at the VA. Veterans in this study confused or conflated participating in psychotherapy with talking about mental health symptoms with a clinician (eg, assessment, disability evaluation). They were sometimes surprised that psychotherapy is an umbrella term referring to a variety of different modalities. The downstream impact of these misunderstandings was a perception of VA mental health care as nebulous. Veterans were surprised that all mental health practitioners were unable to provide the same care. Confusion may have been compounded by highly variable referral processes across VA.24 To address this, clinicians have developed local educational resources and handouts for both veterans and referring clinicians from nonmental health and general mental health specialties.25 Given the variability in referral processes both between and within VA medical centers, national dissemination of these educational materials may be more difficult compared to materials for TF-EBPs.24 The VA started to use behavioral health interdisciplinary program (BHIP) teams, which are designed to be clinical homes for veterans connected with a central clinician who can explain and coordinate their mental health care as well as bring more consistency to the referral process.26 The ongoing transition toward the BHIP model of mental health care at VA may provide the opportunity to consolidate and integrate knowledge about the VA approach to mental health care, potentially filling knowledge gaps.
A second area of process improvement focused on the shared decision-making process. Consistent with mental health initiatives, veterans generally believed they had received sufficient information about TF-EBP and engaged in shared decision-making with clinicians.20,27 Veterans were given educational materials to review and had the opportunity to discuss these materials with clinicians. However, veterans described variability in the success of shared decision-making. Although veterans valued receiving accurate, comprehensible information to support treatment decisions, some preferred to defer to clinicians’ expertise regarding which treatment to pursue. While these veterans valued information, they also valued the expertise of clinicians in explaining why specific treatments would be beneficial. A key contributor to veterans satisfaction was assessing how veterans wanted to engage in the decision-making process and respecting those preferences.28 Veterans approached shared decision-making differently, from making decisions independently after receiving information to relying solely on clinician recommendation. The process was most successful when clinicians articulated how their recommended treatment aligned with a veteran’s preferences, including recommendations based on specific values (eg, personalized match vs being the best). Another important consideration is ensuring veterans know they can receive a variety of different types of mental health services available in different modalities (eg, virtual vs in-person; group vs individual). When veterans did not perceive choice in treatment aspects important to them (typically despite having choices), they were less satisfied with their TF-EBP experience.
A final area of process improvement identified involves how therapists address important aspects of culture. Veterans often described mental health stigma coming from intersecting cultural identities and expressed appreciation when therapists helped them recognize the impact of these beliefs on treatment. Some veterans did not discuss important aspects of their identity with clinicians, including race/ethnicity, religion, and military culture. Veterans did not report negative interactions with clinicians or experiences suggesting it was inappropriate to discuss identity; however, they were reluctant to independently raise these identity factors. Strategies such as the ADDRESSING framework, a mnemonic acronym that describes a series of potentially relevant characteristics, can help clinicians comprehensively consider different aspects that may be relevant to veterans, modeling that discussion of relevant these characteristics is welcome in TF-EBP.29 Veterans reported that making culturally relevant connections enhanced the TF-EBP experience, most commonly with military culture. These data support that TF-EBP delivery with attention to culture should be an integrated part of treatment, supporting engagement and therapeutic alliance.30 The VA National Center for PTSD consultation program is a resource to support clinicians in assessing and incorporating relevant aspects of cultural identity.31 For example, the National Center for PTSD provides a guide for using case conceptualization to address patient reactions to race-based violence during PTSD treatment.32 Both manualized design and therapist certification training can reinforce that assessing and attending to case conceptualization (including identity factors) is an integral component of TF-EBP.33,34
Limitations
While the current study has numerous strengths (eg, national veteran sampling, robust qualitative methods), results should be considered within the context of study limitations. First, veteran participants all received TF-EBP, and the perspectives of veterans who never initiate TF-EBP may differ. Despite the strong sampling approach, the study design is not intended to be generalizable to all veterans receiving TF-EBP for PTSD. Qualitative analysis yielded 15 themes, described in this study and prior research, consistent with recommendations.21,22 This approach allows rich description of distinct focus areas that would not be possible in a single manuscript. Nonetheless, all veterans interviewed described their experiences in TF-EBP and general mental health care, the focus of the semistructured interview guide was on the experience of transitioning from other treatment to TF-EBP.
Conclusion
This study describes themes related to general mental health and TF-EBP process improvement as part of a larger study on transitions in PTSD care.21,22 Veterans valued the fundamentals of therapy, including rapport and flexibility. Treatment-specific rapport (eg, pointing out treatment progress and effort in completing treatment components) and flexibility within the context of fidelity (ie, personalizing treatment while maintaining core treatment elements) may be most effective at engaging veterans in recommended PTSD treatments.18,34 In addition to successes, themes suggest multiple opportunities for process improvement. Ongoing VA initiatives and priorities (ie, BHIP, shared decision-making, consultation services) aim to improve processes consistent with veteran recommendations. Future research is needed to evaluate the success of these and other programs to optimize access to and engagement in recommended PTSD treatments.
- US Department of Veterans Affairs; US Department of Defense. VA/DoD clinical practice guideline for the management of posttraumatic stress disorder and acute stress disorder. 2023. Updated August 20, 2025. Accessed October 17, 2025. https://www.healthquality.va.gov/guidelines/MH/ptsd/
- International Society for Traumatic Stress Studies. ISTSS PTSD prevention and treatment guidelines: methodology and recommendations. Accessed August 13, 2025. http://www.istss.org/getattachment/Treating-Trauma/New-ISTSS-Prevention-and-TreatmentGuidelines/ISTSS_PreventionTreatmentGuidelines_FNL-March-19-2019.pdf.aspx
- American Psychological Association. Clinical practice guideline for the treatment of posttraumatic stress disorder in adults. Accessed August 13, 2025. https://www.apa.org/ptsd-guideline/ptsd.pdf
- Karlin BE, Cross G. From the laboratory to the therapy room: National dissemination and implementation of evidence- based psychotherapies in the U.S. Department of Veterans Affairs Health Care System. Am Psychol. 2014;69:19-33. doi:10.1037/a0033888
- Rosen CS, Matthieu MM, Wiltsey Stirman S, et al. A review of studies on the system-wide implementation of evidencebased psychotherapies for posttraumatic stress disorder in the Veterans Health Administration. Adm Policy Ment Health. 2016;43:957-977. doi:10.1007/s10488-016-0755-0
- Maguen S, Holder N, Madden E, et al. Evidence-based psychotherapy trends among posttraumatic stress disorder patients in a national healthcare system, 2001-2014. Depress Anxiety. 2020;37:356-364. doi:10.1002/da.22983
- Cheney AM, Koenig CJ, Miller CJ, et al. Veteran-centered barriers to VA mental healthcare services use. BMC Health Serv Res. 2018;18:591. doi:10.1186/s12913-018-3346-9
- Hundt NE, Mott JM, Miles SR, et al. Veterans’ perspectives on initiating evidence-based psychotherapy for posttraumatic stress disorder. Psychol Trauma. 2015;7:539-546. doi:10.1037/tra0000035
- Hundt NE, Helm A, Smith TL, et al. Failure to engage: a qualitative study of veterans who decline evidence-based psychotherapies for PTSD. Psychol Serv. 2018;15:536- 542. doi:10.1037/ser0000212
- Sayer NA, Friedemann-Sanchez G, Spoont M, et al. A qualitative study of determinants of PTSD treatment initiation in veterans. Psychiatry. 2009;72:238-255. doi:10.1521/psyc.2009.72.3.238
- Mittal D, Drummond KL, Blevins D, et al. Stigma associated with PTSD: perceptions of treatment seeking combat veterans. Psychiatr Rehabil J. 2013;36:86-92. doi:10.1037/h0094976
- Possemato K, Wray LO, Johnson E, et al. Facilitators and barriers to seeking mental health care among primary care veterans with posttraumatic stress disorder. J Trauma Stress. 2018;31:742-752. doi:10.1002/jts.22327
- Silvestrini M, Chen JA. “It’s a sign of weakness”: Masculinity and help-seeking behaviors among male veterans accessing posttraumatic stress disorder care. Psychol Trauma. 2023;15:665-671. doi:10.1037/tra0001382
- Stecker T, Shiner B, Watts BV, et al. Treatment-seeking barriers for veterans of the Iraq and Afghanistan conflicts who screen positive for PTSD. Psychiatr Serv. 2013;64:280-283. doi:10.1176/appi.ps.001372012
- Etingen B, Grubbs KM, Harik JM. Drivers of preference for evidence-based PTSD treatment: a qualitative assessment. Mil Med. 2020;185:303-310. doi:10.1093/milmed/usz220
- Hundt NE, Ecker AH, Thompson K, et al. “It didn’t fit for me:” A qualitative examination of dropout from prolonged exposure and cognitive processing therapy in veterans. Psychol Serv. 2020;17:414-421. doi:10.1037/ser0000316
- Kehle-Forbes SM, Gerould H, Polusny MA, et al. “It leaves me very skeptical” messaging in marketing prolonged exposure and cognitive processing therapy to veterans with PTSD. Psychol Trauma. 2022;14:849-852. doi:10.1037/tra0000550
- Kehle-Forbes SM, Ackland PE, Spoont MR, et al. Divergent experiences of U.S. veterans who did and did not complete trauma-focused therapies for PTSD: a national qualitative study of treatment dropout. Behav Res Ther. 2022;154:104123. doi:10.1016/j.brat.2022.104123
- Hessinger JD, London MJ, Baer SM. Evaluation of a shared decision-making intervention on the utilization of evidence-based psychotherapy in a VA outpatient PTSD clinic. Psychol Serv. 2018;15:437-441. doi:10.1037/ser0000141
- Hamblen JL, Grubbs KM, Cole B, et al. “Will it work for me?” Developing patient-friendly graphical displays of posttraumatic stress disorder treatment effectiveness. J Trauma Stress. 2022;35:999-1010. doi:10.1002/jts.22808
- Holder N, Ranney RM, Delgado AK, et al. Transitioning into trauma-focused evidence-based psychotherapy for posttraumatic stress disorder from other treatments: a qualitative investigation. Cogn Behav Ther. 2025;54:391-407. doi:10.1080/16506073.2024.2408386
- Levitt HM, Bamberg M, Creswell JW, et al. Journal article reporting standards for qualitative primary, qualitative meta-analytic, and mixed methods research in psychology: The APA Publications and Communications Board task force report. Am Psychol. 2018;73:26-46. doi:10.1037/amp0000151
- Palinkas LA, Mendon SJ, Hamilton AB. Innovations in mixed methods evaluations. Annu Rev Public Health. 2019;40:423- 442. doi:10.1146/annurev-publhealth-040218-044215
- Ranney RM, Cordova MJ, Maguen S. A review of the referral process for evidence-based psychotherapies for PTSD among veterans. Prof Psychol Res Pr. 2022;53:276-285. doi:10.1037/pro0000463
- Holder N, Ranney RM, Delgado AK, et al. Transitions to trauma-focused evidence-based psychotherapy for posttraumatic stress disorder from other treatment: a qualitative investigation of clinician’s perspectives. Cogn Behav Ther. 2025;1-19. doi:10.1080/16506073.2025.2481475
- Barry CN, Abraham KM, Weaver KR, et al. Innovating team-based outpatient mental health care in the Veterans Health Administration: staff-perceived benefits and challenges to pilot implementation of the Behavioral Health Interdisciplinary Program (BHIP). Psychol Serv. 2016;13:148-155. doi:10.1037/ser0000072
- Harik JM, Hundt NE, Bernardy NC, et al. Desired involvement in treatment decisions among adults with PTSD symptoms. J Trauma Stress. 2016;29:221-228. doi:10.1002/jts.22102
- Larsen SE, Hooyer K, Kehle-Forbes SM, et al. Patient experiences in making PTSD treatment decisions. Psychol Serv. 2024;21:529-537. doi:10.1037/ser0000817
- Hays PA. Four steps toward intersectionality in psychotherapy using the ADDRESSING framework. Prof Psychol Res Pr. 2024;55:454-462. doi:10.1037/pro0000577
- Galovski TE, Nixon RDV, Kaysen D. Flexible Applications of Cognitive Processing Therapy: Evidence-Based Treatment Methods. Academic Press; 2020.
- Larsen SE, McKee T, Fielstein E, et al. The development of a posttraumatic stress disorder (PTSD) consultation program to support system-wide implementation of high-quality PTSD care for veterans. Psychol Serv. 2025;22:342-348. doi:10.1037/ser0000867
- Galovski T, Kaysen D, McClendon J, et al. Provider guide to addressing patient reactions to race-based violence during PTSD treatment. PTSD.va.gov. Accessed August 3, 2025. www.ptsd.va.gov/professional/treat/specific/patient_reactions_race_violence.asp
- Galovski TE, Nixon RDV, Kehle-Forbes S. Walking the line between fidelity and flexibility: a conceptual review of personalized approaches to manualized treatments for posttraumatic stress disorder. J Trauma Stress. 2024;37:768-774. doi:10.1002/jts.23073
- Galovski TE, McSweeney LB, Nixon RDV, et al. Personalizing cognitive processing therapy with a case formulation approach to intentionally target impairment in psychosocial functioning associated with PTSD. Contemp Clin Trials Commun. 2024;42:101385. doi:10.1016/j.conctc.2024.101385
Process Improvement for Engaging With Trauma-Focused Evidence-Based Psychotherapy for PTSD
Process Improvement for Engaging With Trauma-Focused Evidence-Based Psychotherapy for PTSD
Factors Influencing Outcomes of a Telehealth-Based Physical Activity Program in Older Veterans Postdischarge
Factors Influencing Outcomes of a Telehealth-Based Physical Activity Program in Older Veterans Postdischarge
Deconditioning among hospitalized older adults contributes to significant decline in posthospitalization functional ability, physical performance, and physical activity.1-10 Previous hospital-to-home interventions have targeted improving function and physical activity, including recent programs leveraging home telehealth as a feasible and potentially effective mode of delivering in-home exercise and rehabilitation.11-14 However, pilot interventions have shown mixed effectiveness.11,12,14 This study expands on a previously published intervention describing a pilot home telehealth program for veterans posthospital discharge that demonstrated significant 6-month improvement in physical activity as well as trends in physical function improvement, including among those with cognitive impairment.15 Factors that contribute to improved outcomes are the focus of the present study.
Key factors underlying the complexity of hospital-to-home transitions include hospitalization elements (ie, reason for admission and length of stay), associated posthospital syndromes (ie, postdischarge falls, medication changes, cognitive impairment, and pain), and postdischarge health care application (ie, physical therapy and hospital readmission).16-18 These factors may be associated with postdischarge functional ability, physical performance, and physical activity, but their direct influence on intervention outcomes is unclear (Figure 1).5,7,9,16-20 The objective of this study was to examine the influence of hospitalization, posthospital syndrome, and postdischarge health care application factors on outcomes of a US Department of Veterans Affairs (VA) Video Connect (VVC) intervention to enhance function and physical activity in older adults posthospital discharge.
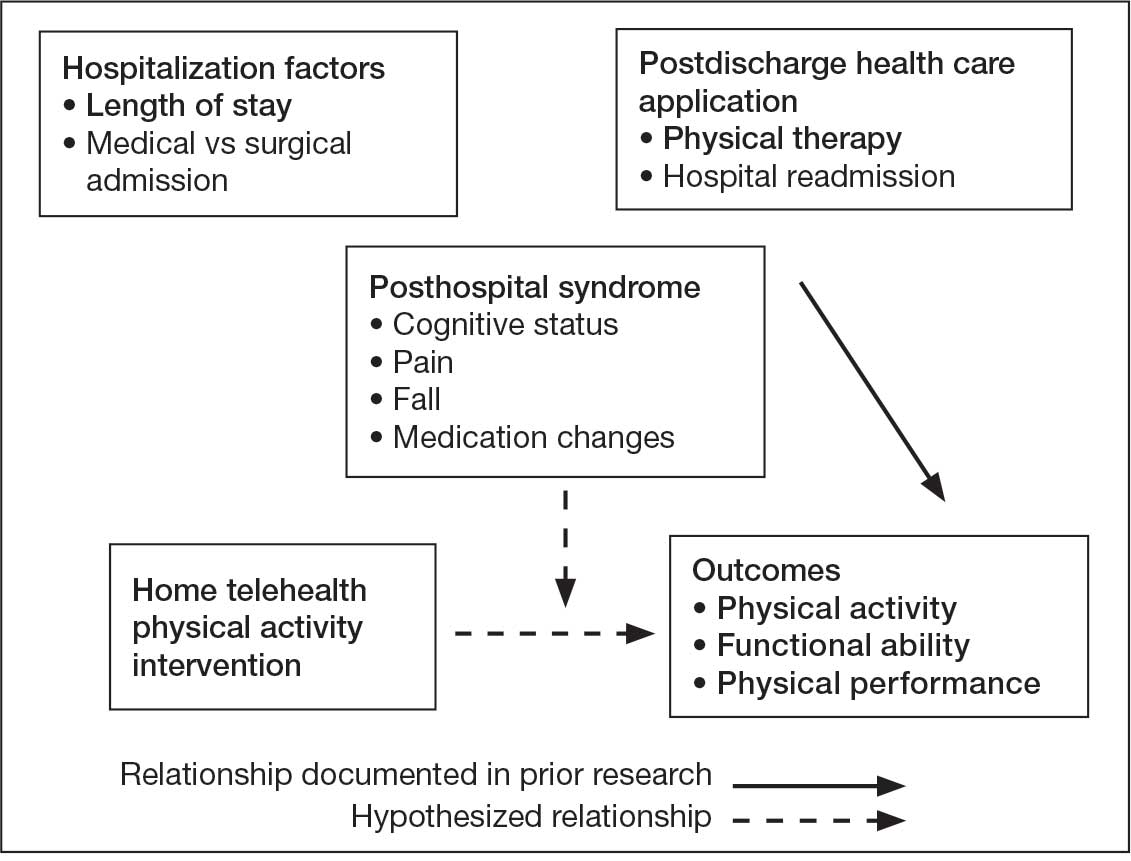
health care application factors on physical activity, functional ability, and
physical performance intervention outcomes.
Methods
The previous analysis reported on patient characteristics, program feasibility, and preliminary outcomes.13,15 The current study reports on relationships between hospitalization, posthospital syndrome, and postdischarge health care application factors and change in key outcomes, namely postdischarge self-reported functional ability, physical performance, and physical activity from baseline to endpoint.
Participants provided written informed consent. The protocol and consent forms were approved by the VA Ann Arbor Healthcare System (VAAAHS) Research and Development Committee, and the project was registered on clinicaltrials.gov (NCT04045054).
Intervention
The pilot program targeted older adults following recent hospital discharge from VAAAHS. Participants were eligible if they were aged ≥ 50 years, had been discharged following an inpatient stay in the past 1 to 2 weeks, evaluated by physical therapy during hospitalization with stated rehabilitation goals on discharge, and followed by a VAAAHS primary care physician. Participants were either recruited during hospital admission or shortly after discharge.13
An experienced physical activity trainer (PAT) supported the progression of participants’ rehabilitation goals via a home exercise program and coached the patient and caregiver to optimize functional ability, physical performance, and physical activity. The PAT was a nonlicensed research assistant with extensive experience in applying standard physical activity enhancement protocols (eg, increased walking) to older adults with comorbidities. Participation in the program lasted about 6 months. Initiation of the PAT program was delayed if the patient was already receiving postdischarge home-based or outpatient physical therapy. The PAT contacted the patient weekly via VVC for the first 6 weeks, then monthly for a total of 6 months. Each contact included information on optimal walking form, injury prevention, program progression, and ways to incorporate sit-to-stand transitions, nonsitting behavior, and walking into daily routines. The initial VVC contact lasted about 60 minutes and subsequent sessions lasted about 30 minutes.13
Demographic characteristics were self-reported by participants and included age, sex, race, years of education, and marital status. Clinical characteristics were obtained from each participant’s electronic health record (EHR), including copay status, index hospitalization length of stay, admission diagnosis, and postsurgery status (postsurgery vs nonpostsurgery). Intervention adherence was tracked as the number of PAT sessions attended.
Posthospital Syndrome Factors
Participant falls (categorized as those who reported a fall vs those who did not) and medication changes (number of changes reported, including new medication, discontinued medication, dose changes, medication changes, or changes in medication schedule) were reported by participants or caregivers during each VVC contact. Participants completed the Montreal Cognitive Assessment (MoCA) at baseline, and were dichotomized into 2 groups: no cognitive impairment (MoCA score ≥ 26) and mild to moderate cognitive impairment (MoCA score 10-25).13,21
Participants rated how much pain interfered with their normal daily activities since the previous VVC session on a 5-point Likert scale (1, not at all; to 5, extremely).22 Similar to prior research, participants were placed into 2 groups based on their mean pain interference score (individuals with scores from 1.0 to 2.0 in 1 group, and individuals with > 2.0 in another).23-25 Participants were separated into a no or mild pain interference group and a moderate to severe pain interference group. Hospital readmissions (VA and non-VA) and postdischarge physical therapy outcomes were obtained from the participant’s EHR, including primary care visits.
Outcomes
Outcomes were collected at baseline (posthospital discharge) and 6 months postenrollment.
Self-Reported Functional Ability. This measure is provided by participants or caregivers and measured by the Katz Index of Independence in Activities of Daily Living (ADL), Lawton and Brody Instrumental ADL Scale (IADL), Nagi Disability Model, and Rosow-Breslau Scale. The Katz ADL assesses the ability to complete 6 self-care activities and awards 1 point for independence and 0 if the individual is dependent (total score range, 0-6).26 The Lawton and Brody IADL measures an individual’s independence in 8 instrumental ADLs; it awards 1 point for independence and 0 if the individual is dependent (total score range, 0-8).27 The Nagi Disability Model evaluates an individual’s difficulty performing 5 tasks (total score range, 0-5) and tallies the number of items with a response other than “no difficulty at all” (higher total score indicates greater difficulty). 28 The Rosow-Breslau Scale is a 3-item measure of mobility disability; individual responses are 0 (no help) and 1 (requires help or unable); higher total score (range, 0-3) indicates greater disability.29
Physical Performance. Measured using the Short Physical Performance Battery (SPPB), which evaluates standing balance, sit to stand, and walking performance. Scores range from 0 to 4 on the balance, gait speed, and chair stand tests, for a total composite score between 0 and 12 (higher score indicates better performance).30
Physical Activity. Measured using actigraphy, namely a physical activity monitor adherent to the thigh (activ-PAL3TM, PAL Technologies Ltd., Glasgow, UK).31 Participants were instructed to wear the activPal for ≥ 1 week. Participants with a minimum of 5 days of wear were included in this analysis.
Data Analyses
Analyses were performed using SPSS software version 29.0.32 Continuous variables were summarized using mean (SD) or median and IQR using the weighted average method; categorical variables were summarized using frequencies and percentages. Baseline scores on outcome variables were compared by categorical hospitalization, posthospital syndrome, and postdischarge health care application factor variables using Mann-Whitney U tests. The differences between outcome variables from baseline to endpoint were then calculated to produce change scores. Relationships between the number of PAT sessions attended and baseline outcomes and outcome change scores were estimated using Spearman correlations. Relationships between categorical factors (hospitalization, posthospital syndrome, and postdischarge health care application) and outcome variable change scores (which were normally distributed) were examined using Mann-Whitney U tests. Relationships with continuous hospitalization (length of stay) and posthospital syndrome factors (medication changes) were estimated using Spearman correlations. Effect sizes (ES) were estimated with Cohen d; small (d = 0.2), medium (d = 0.5), or large (d ≥ 0.8). Missing data were handled using pairwise deletion.33 Therefore, sample sizes were reported for each analysis. For all statistical tests, P < .05 was considered significant.
Results
Twenty-four individuals completed the pilot intervention.15 Mean (SD) age was 73.6 (8.1) years (range, 64-93 years) and participants were predominantly White males (Table 1). Eight participants had a high school education only and 13 had more than a high school education. Diagnoses at admission included 9 patients with orthopedic/musculoskeletal conditions (6 were for joint replacement), 6 patients with vascular/pulmonary conditions, and 4 with gastrointestinal/renal/urological conditions. Of the 11 postsurgery participants, 7 were orthopedic, 4 were gastrointestinal, and 1 was peripheral vascular.
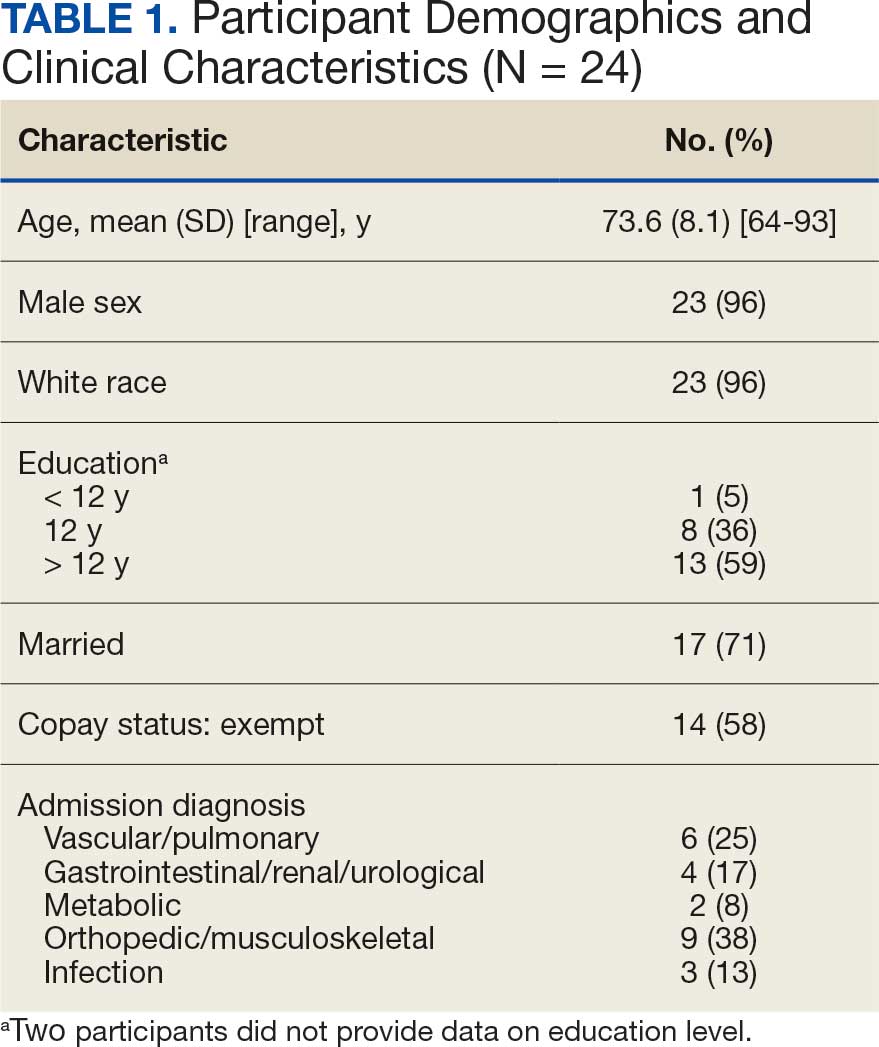
Baseline outcome scores did not differ significantly between groups, except individuals with moderate to severe pain interference reported a significantly lower IADL score (median [IQR] 4 [2-7]) than individuals with mild or moderate pain interference (median [IQR] 8 [7-8]; P = .02) (Table 2). The mean (SD) number of PAT sessions attended was 9.3 (3.7) (range, 3-19). There were no significant relationships between number of sessions attended and any baseline outcome variables or outcome change scores.
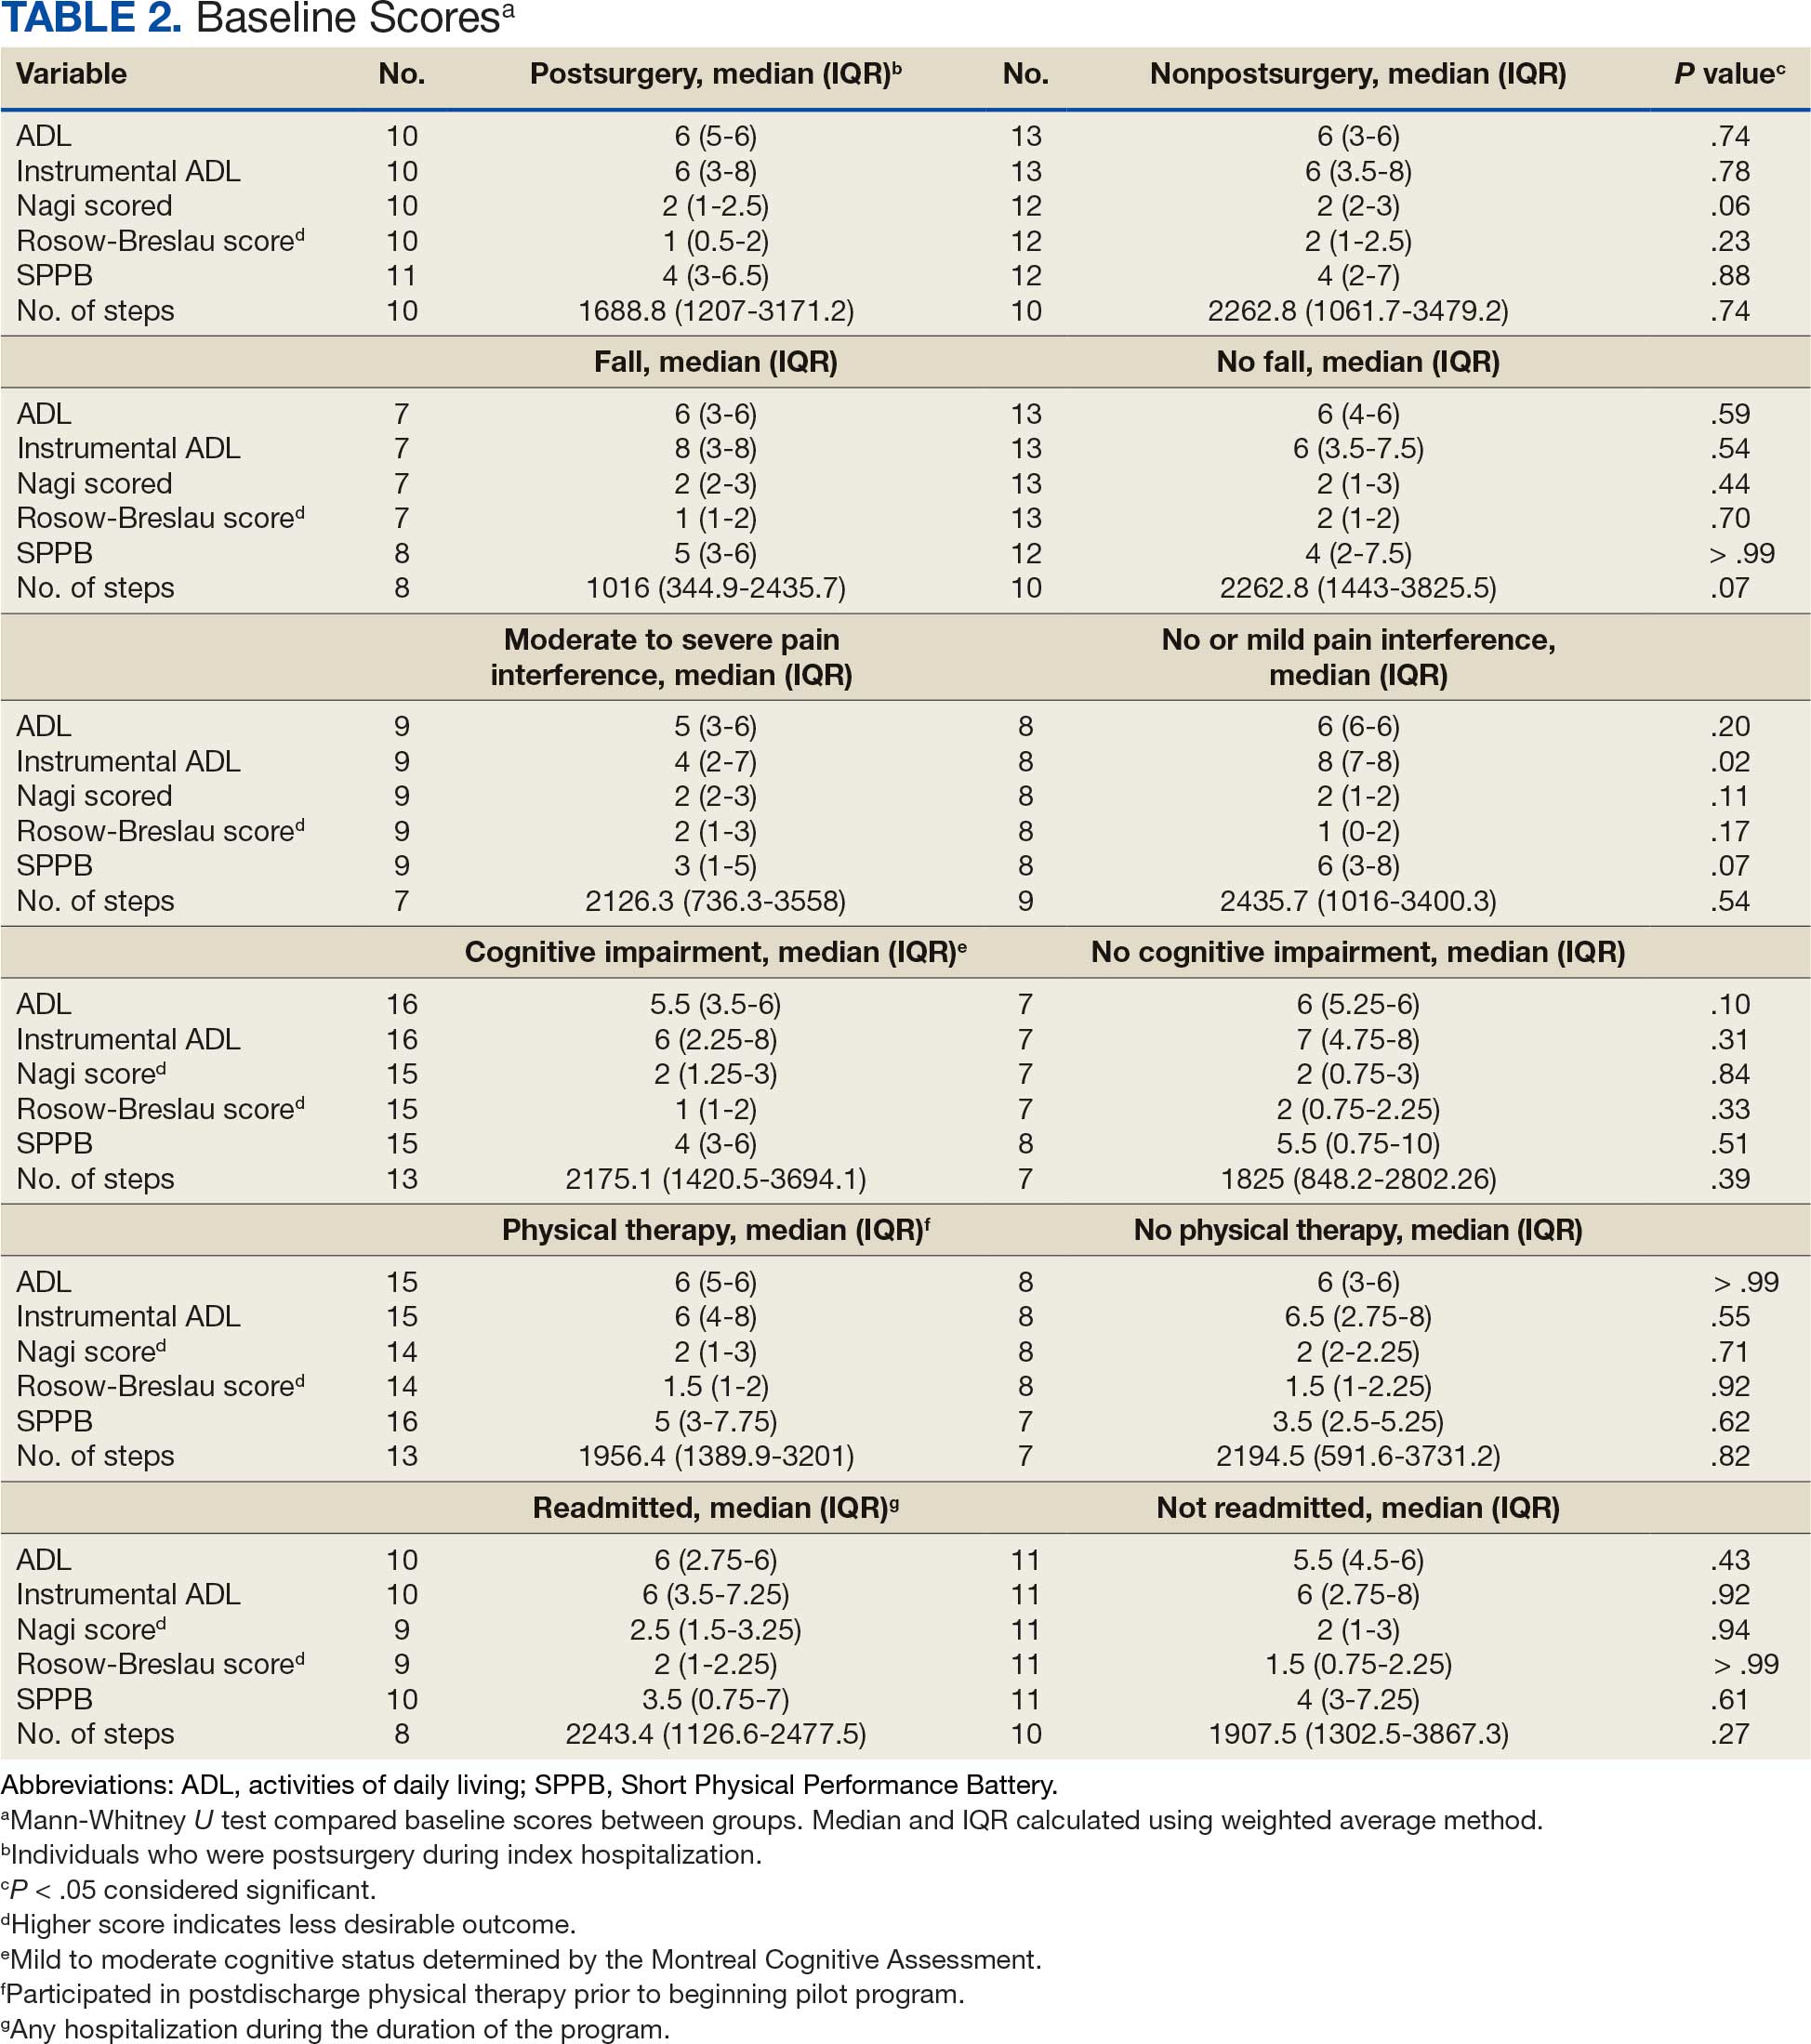
Hospitalization Factors
Participants who were postsurgery tended to have greater improvement than individuals who were nonpostsurgery in ADLs (median [IQR] 0 [0-1.5]; ES, 0.6; P = .10) and SPPB (median [IQR] 2 [1.5-9]; ES, 0.9; P = .07), but the improvements were not statistically significant (Table 3). Mean (SD) length of stay of the index hospitalization was 6.7 (6.1) days. Longer length of stay was significantly correlated with an increase in Nagi score (ρ, 0.45; 95% CI, 0.01-0.75). There were no other significant or trending relationships between length of stay and outcome variables.
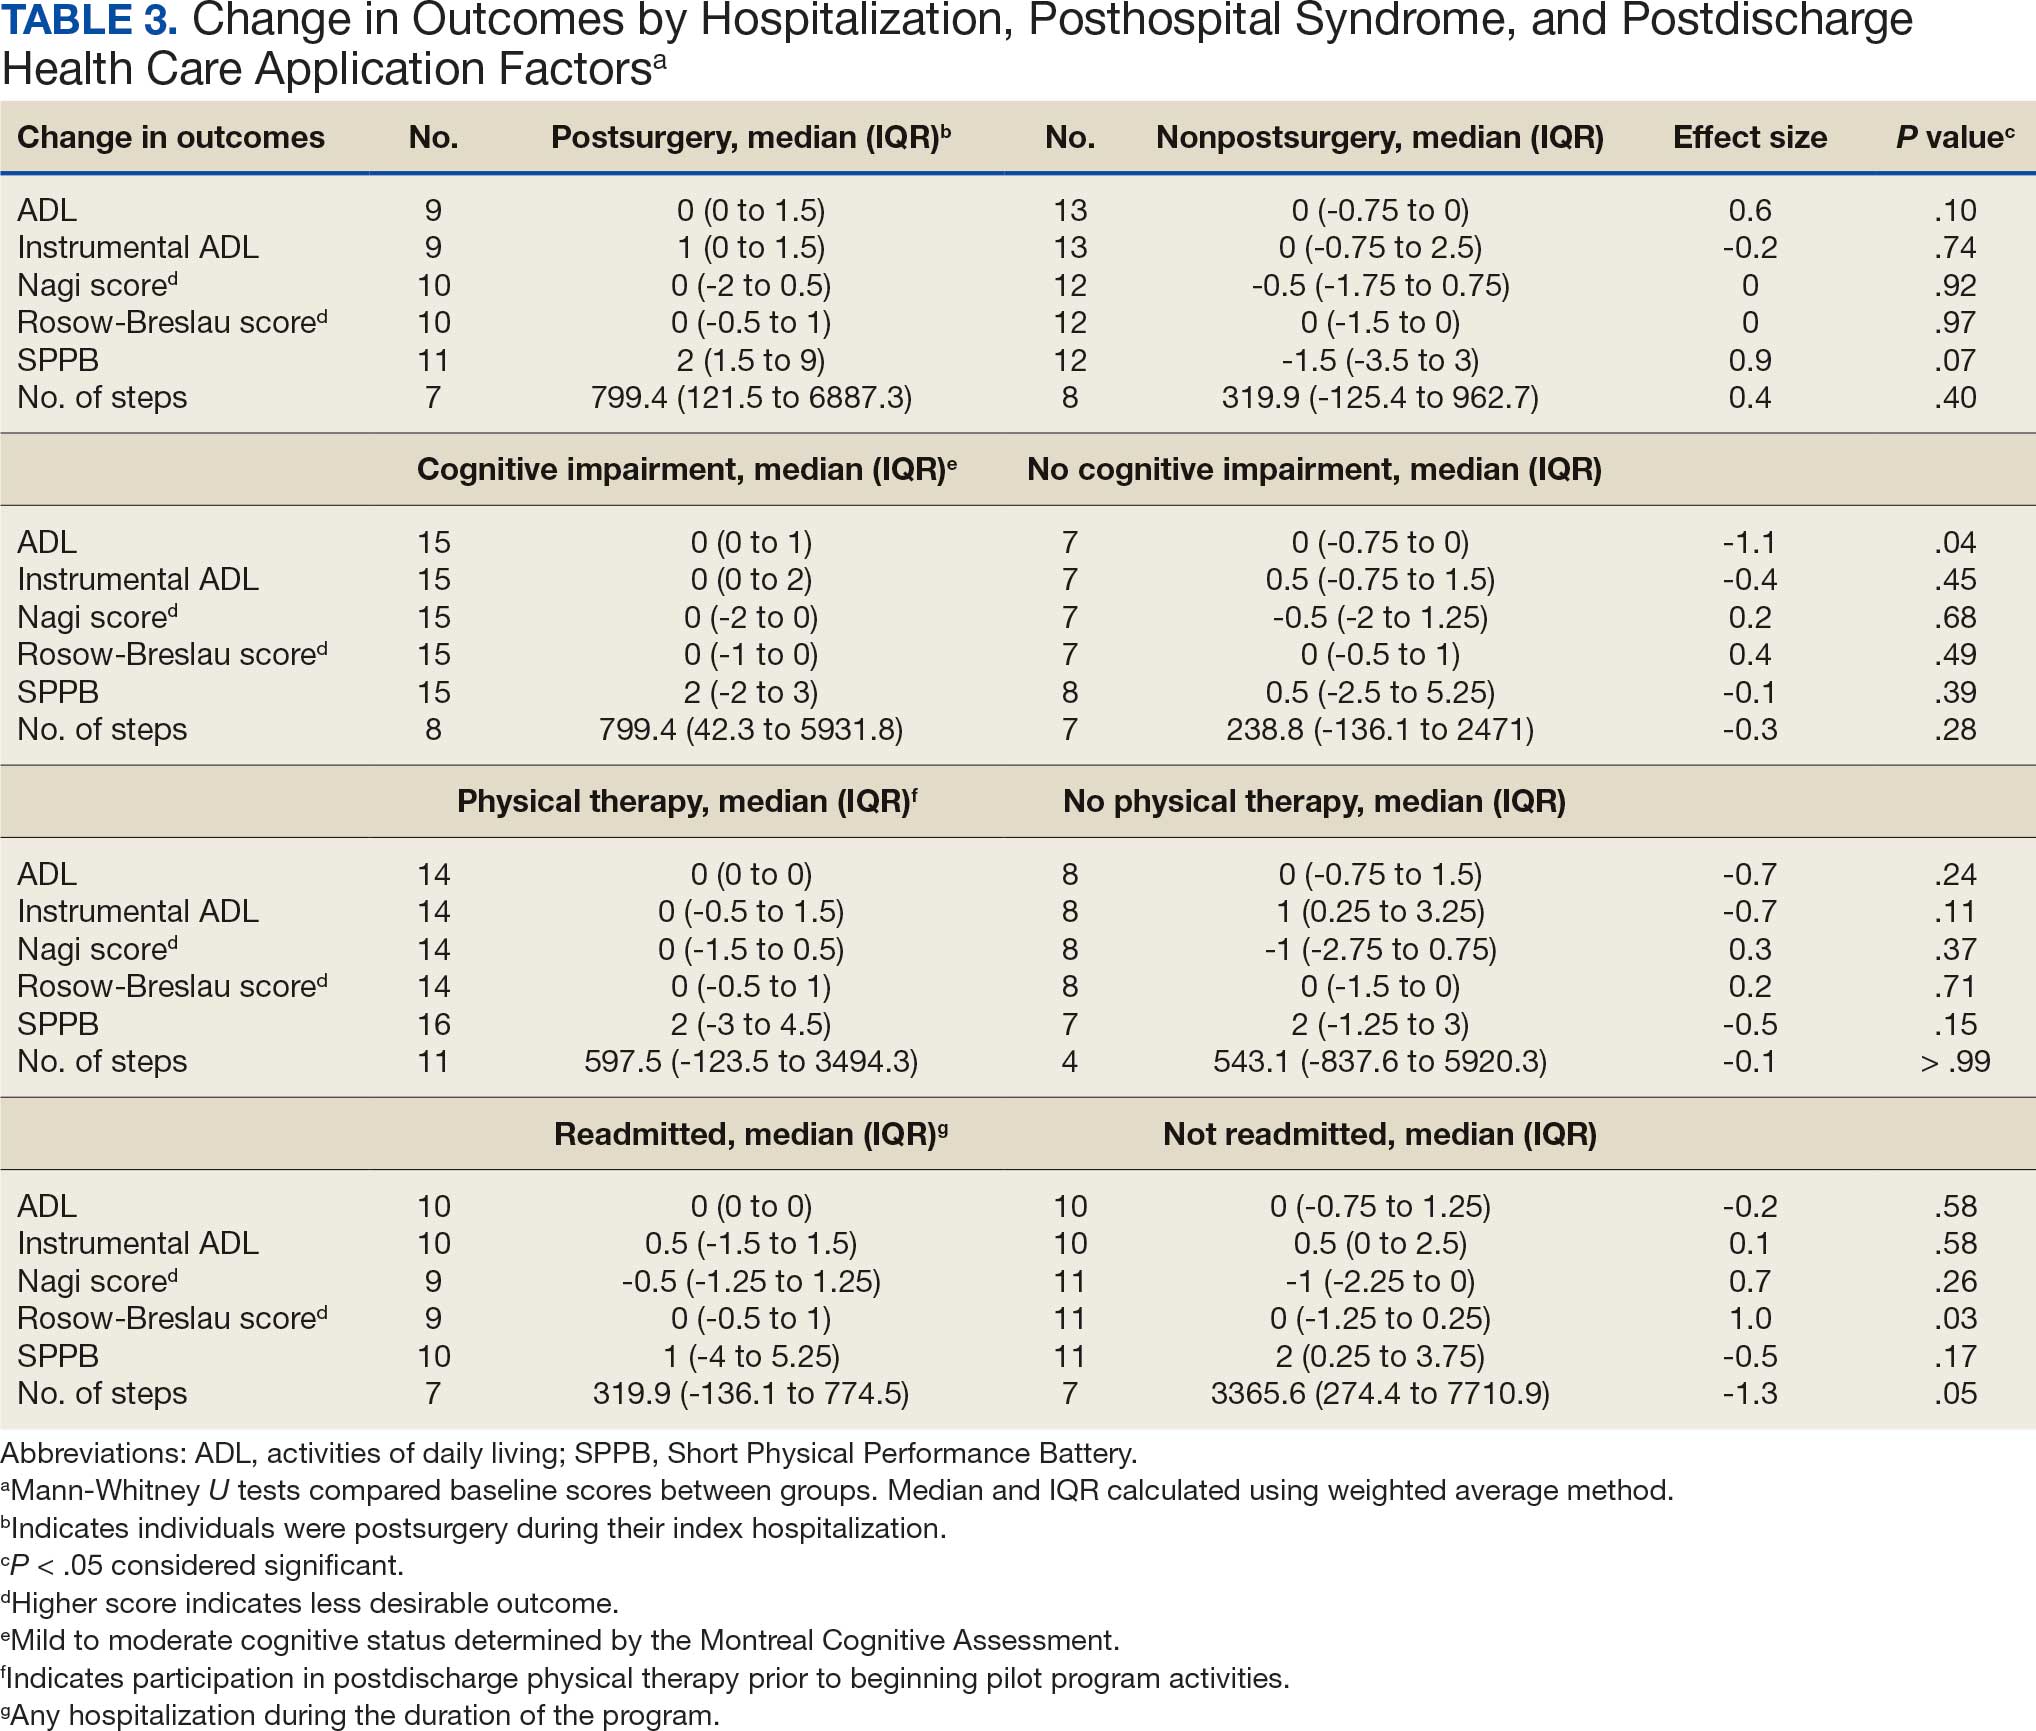
Posthospital Syndrome Factors
The 16 participants with mild to moderate cognitive impairment had less improvement in ADLs (median [IQR] 0 [0-1]) than the 8 participants with no impairment (median [IQR] 0 [-0.75 to 0]; ES, -1.1; P = .04). Change in outcome variables from baseline to endpoint did not significantly differ between the 8 patients who reported a fall compared with the 13 who did not, nor were any trends observed. Change in outcome variables from baseline to endpoint also did not significantly differ between the 8 participants who reported no or mild pain interference compared with the 10 patients with moderate to severe pain interference, nor were any trends observed. Mean (SD) number of medication changes was 2.5 (1.6). Higher number of medication changes was significantly correlated with a decrease in Rosow-Breslau score (ρ, -0.47; 95% CI, -0.76 to -0.02). There were no other significant or trending relationships between number of medication changes and outcome variables.
Postdischarge Health Care Application Factors
The 16 participants who attended posthospital physical therapy trended towards less improvement in IADLs (median [IQR] 0 [-0.5 to 1.5]; ES, -0.7; P = .11) and SPPB (median [IQR] 2 [-3.0 to 4.5]; ES, -0.5; P = .15) than the 8 patients with no postdischarge physical therapy. Eleven participants were readmitted, while 13 had no readmissions in their medical records between baseline and endpoint. Participants with ≥ 1 readmission experienced a greater increase in Rosow-Breslau score (median [IQR] 0 [-0.5 to 1.0]) than those not readmitted (median [IQR] 0 [-1.25 to 0.25]; ES, 1.0; P = .03). Borderline greater improvement in number of steps was found in those not readmitted (median [IQR] 3365.6 [274.4-7710.9]) compared with those readmitted (median [IQR] 319.9 [-136.1 to 774.5]; ES, -1.3; P = .05). Patients who were readmitted also tended to have lower and not statistically significant improvements in SPPB (median [IQR] 1 [-4.0 to 5.3]) compared with those not readmitted (median [IQR] 2 [0.3-3.8]; ES, -0.5; P = .17) (Table 3).
Discussion
This study examined the association between hospitalization, posthospital syndrome, and postdischarge health care use in patients undergoing a VVC-based intervention following hospital discharge. Participants who had no or mild cognitive impairment, no readmissions, higher medication changes, and a shorter hospital length of stay tended to experience lower disability, including in mobility and ADLs. This suggests individuals who are less clinically complex may be more likely to benefit from this type of virtual rehabilitation program. These findings are consistent with clinical experiences; home-based programs to improve physical activity posthospital discharge can be challenging for those who were medically ill (and did not undergo a specific surgical procedure), cognitively impaired, and become acutely ill and trigger hospital readmission. 15 For example, the sample in this study had higher rates of falls, pain, and readmissions compared to previous research.2,3,34-39
The importance of posthospital syndrome in the context of recovery of function and health at home following hospitalization is well documented.16-18 The potential impact of posthospital syndrome on physical activity-focused interventions is less understood. In our analysis, participants with mild or moderate cognitive impairment tended to become more dependent in their ADLs, while those with no cognitive impairment tended to become more independent in their ADLs. This functional decline over time is perhaps expected in persons with cognitive impairment, but the significant difference with a large ES warrants further consideration on how to tailor interventions to better promote functional recovery in these individuals.40,41 While some cognitive decline may not be preventable, this finding supports the need to promote healthy cognitive aging, identify declines in cognition, and work to mitigate additional decline. Programs specifically designed to promote function and physical activity in older adults with cognitive impairment are needed, especially during care transitions.41-43
While participants reported that falls and pain interference did not have a significant impact on change in outcomes between baseline and endpoint, these areas need further investigation. Falls and pain have been associated with function and physical activity in older adults.42-46 Pain is common, yet underappreciated during older adult hospital-to-home transitions.11,12,45,46 There is a need for more comprehensive assessment of pain (including pain intensity) and qualitative research.
Hospitalization and postdischarge health care application factors may have a significant impact on home-telehealth physical activity intervention success. Individuals who were postsurgery tended to have greater improvements in ADLs and physical performance. Most postsurgery participants had joint replacement surgery. Postsurgery status may not be modifiable, but it is important to note expected differences in recovery between medical and surgical admissions and the need to tailor care based on admission diagnosis. Those with a longer length of hospital stay may be considered at higher risk of suboptimal outcomes postdischarge, which indicates an opportunity for targeting resources and support, in addition to efforts of reducing length of stay where possible.47
Readmissions were significantly related to a change in Rosow-Breslau mobility disability score. This may indicate the detrimental impact a readmission can have on increasing mobility and physical activity postdischarge, or the potential of this pilot program to impact readmissions by increasing mobility and physical activity, contrary to prior physical exercise interventions.5,7,9,48 With 5% to 79% of readmissions considered preventable, continued efforts and program dissemination and implementation to address preventable readmissions are warranted.49 Individuals with postdischarge physical therapy (prior to beginning the pilot program) tended to demonstrate less improvement in disability and physical performance. This relationship needs further investigation; the 2 groups did not appear to have significant differences at baseline, albeit with a small sample size. It is possible they experienced initial improvements with postdischarge physical therapy and plateaued or had little further reserve to improve upon entering the VVC program.
Strengths and Limitations
This pilot program provided evaluative data on the use of VVC to enhance function and physical activity in older adults posthospital discharge. It included individual (eg, fall, pain, cognitive impairment) and health service (eg, readmission, physical therapy) level factors as predictors of function and physical activity posthospitalization.5,7,9,15-19
The results of this pilot project stem from a small sample lacking diversity in terms of race, ethnicity, and sex. There was some variation in baseline and endpoints between participants, and when hospitalization, posthospital syndrome, and postdischarge health care application factors were collected. The majority of participants were recruited within a month postdischarge, and the program lasted about 6 months. Data collection was attempted at regular PAT contacts, but there was some variation in when visits occurred based on participant availability and preference. Some participants had missing data, which was handled using pairwise deletion.33 Larger studies are needed to confirm the findings of this study, particularly the trends that did not reach statistical significance. Home health services other than physical therapy (eg, nursing, occupational therapy) were not fully accounted for and should be considered in future research.
Conclusions
In patients undergoing a 6-month pilot VVC-based physical activity intervention posthospital discharge, improvements in mobility and disability were most likely in those who had no cognitive impairment and were not readmitted. Larger sample and qualitative investigations are necessary to optimize outcomes for patients who meet these clinical profiles.
- Liebzeit D, Bratzke L, Boltz M, Purvis S, King B. Getting back to normal: a grounded theory study of function in post-hospitalized older adults. Gerontologist. 2020;60:704-714. doi:10.1093/geront/gnz057
- Ponzetto M, Zanocchi M, Maero B, et al. Post-hospitalization mortality in the elderly. Arch Gerontol Geriatr. 2003;36:83-91. doi:10.1016/s0167-4943(02)00061-4
- Buurman BM, Hoogerduijn JG, de Haan RJ, et al. Geriatric conditions in acutely hospitalized older patients: prevalence and one-year survival and functional decline. PLoS One. 2011;6:e26951. doi:10.1371/journal.pone.0026951
- Ponzetto M, Maero B, Maina P, et al. Risk factors for early and late mortality in hospitalized older patients: the continuing importance of functional status. J Gerontol A Biol Sci Med Sci. 2003;58:1049-1054. doi:10.1093/gerona/58.11.m1049
- Huang HT, Chang CM, Liu LF, Lin HS, Chen CH. Trajectories and predictors of functional decline of hospitalised older patients. J Clin Nurs. 2013;22:1322-1331. doi:10.1111/jocn.12055
- Boyd CM, Landefeld CS, Counsell SR, et al. Recovery of activities of daily living in older adults after hospitalization for acute medical illness. J Am Geriatr Soc. 2008;56:2171- 2179. doi:10.1111/j.1532-5415.2008.02023.x
- Helvik AS, Selbæk G, Engedal K. Functional decline in older adults one year after hospitalization. Arch Gerontol Geriatr. 2013;57:305-310. doi:10.1016/j.archger.2013.05.008
- Zaslavsky O, Zisberg A, Shadmi E. Impact of functional change before and during hospitalization on functional recovery 1 month following hospitalization. J Gerontol Biol Sci Med Sci. 2015;70:381-386. doi:10.1093/gerona/glu168
- Chen CC, Wang C, Huang GH. Functional trajectory 6 months posthospitalization: a cohort study of older hospitalized patients in Taiwan. Nurs Res. 2008;57:93-100. doi:10.1097/01.NNR.0000313485.18670.e2
- Kleinpell RM, Fletcher K, Jennings BM. Reducing functional decline in hospitalized elderly. In: Hughes RG, ed. Patient Safety and Quality: An Evidence-Based Handbook for Nurses. Agency for Healthcare Research and Quality (US); 2008. Accessed September 3, 2025. http://www.ncbi.nlm.nih.gov/books/NBK2629/
- Liebzeit D, Rutkowski R, Arbaje AI, Fields B, Werner NE. A scoping review of interventions for older adults transitioning from hospital to home. J Am Geriatr Soc. 2021;69:2950-2962. doi:10.1111/jgs.17323
- Hladkowicz E, Dumitrascu F, Auais M, et al. Evaluations of postoperative transitions in care for older adults: a scoping review. BMC Geriatr. 2022;22:329. doi:10.1186/s12877-022-02989-6
- Alexander NB, Phillips K, Wagner-Felkey J, et al. Team VA Video Connect (VVC) to optimize mobility and physical activity in post-hospital discharge older veterans: baseline assessment. BMC Geriatr. 2021;21:502. doi:10.1186/s12877-021-02454-w
- Dawson R, Oliveira JS, Kwok WS, et al. Exercise interventions delivered through telehealth to improve physical functioning for older adults with frailty, cognitive, or mobility disability: a systematic review and meta-analysis. Telemed J E Health. 2024;30:940-950. doi:10.1089/tmj.2023.0177
- Liebzeit D, Phillips KK, Hogikyan RV, Cigolle CT, Alexander NB. A pilot home-telehealth program to enhance functional ability, physical performance, and physical activity in older adult veterans post-hospital discharge. Res Gerontol Nurs. 2024;17:271-279. doi:10.3928/19404921-20241105-01
- Krumholz HM. Post-hospital syndrome—an acquired, transient condition of generalized risk. N Engl J Med. 2013;368:100-102. doi:10.1056/NEJMp1212324
- Caraballo C, Dharmarajan K, Krumholz HM. Post hospital syndrome: is the stress of hospitalization causing harm? Rev Esp Cardiol (Engl Ed). 2019;72:896-898. doi:10.1016/j.rec.2019.04.010
- Rawal S, Kwan JL, Razak F, et al. Association of the trauma of hospitalization with 30-day readmission or emergency department visit. JAMA Intern Med. 2019;179:38- 45. doi:10.1001/jamainternmed.2018.5100
- Dutzi I, Schwenk M, Kirchner M, Jooss E, Bauer JM, Hauer K. Influence of cognitive impairment on rehabilitation received and its mediating effect on functional recovery. J Alzheimers Dis. 2021;84:745-756. doi:10.3233/JAD-210620
- Uriz-Otano F, Uriz-Otano JI, Malafarina V. Factors associated with short-term functional recovery in elderly people with a hip fracture. Influence ofcognitiveimpairment. JAmMedDirAssoc. 2015;16:215-220. doi:10.1016/j.jamda.2014.09.009
- Nasreddine ZS, Phillips NA, Bédirian V, et al. The Montreal Cognitive Assessment, MoCA: a brief screening tool for mild cognitive impairment. J Am Geriatr Soc. 2005;53:695-699. doi:10.1111/j.1532-5415.2005.53221.x
- Ware JE Jr, Sherbourne CD. The MOS 36-item short-form health survey (SF-36). I. Conceptual framework and item selection. Med Care. 1992;30:473-483.
- White RS, Jiang J, Hall CB, et al. Higher perceived stress scale scores are associated with higher pain intensity and pain interference levels in older adults. J Am Geriatr Soc. 2014;62:2350-2356. doi:10.1111/jgs.13135
- Blyth FM, March LM, Brnabic AJ, et al. Chronic pain in Australia: a prevalence study. Pain. 2001;89:127-134. doi:10.1016/s0304-3959(00)00355-9
- Thomas E, Peat G, Harris L, Wilkie R, Croft PR. The prevalence of pain and pain interference in a general population of older adults: cross-sectional findings from the North Staffordshire Osteoarthritis Project (NorStOP). Pain. 2004;110:361-368. doi:10.1016/j.pain.2004.04.017
- Katz S, Ford AB, Moskowitz RW, Jackson BA, Jaffe MW. Studies of illness in the aged. The index of ADL: a standardized measure of biological and psychosocial function. JAMA. 1963;185:914-919. doi:10.1001/jama.1963.03060120024016
- Lawton MP, Brody EM. Assessment of older people: self-maintaining and instrumental activities of daily living. Gerontologist. 1969;9:179-186.
- Alexander NB, Guire KE, Thelen DG, et al. Self-reported walking ability predicts functional mobility performance in frail older adults. J Am Geriatr Soc. 2000;48:1408-1413. doi:10.1111/j.1532-5415.2000.tb02630.x
- Rosow I, Breslau N. A Guttman health scale for the aged. J Gerontol. 1966;21:556-559. doi:10.1093/geronj/21.4.556
- Guralnik JM, Simonsick EM, Ferrucci L, et al. A short physical performance battery assessing lower extremity function: association with self-reported disability and prediction of mortality and nursing home admission. J Gerontol. 1994;49:M85-M94. doi:10.1093/geronj/49.2.m85
- Chan CS, Slaughter SE, Jones CA, Ickert C, Wagg AS. Measuring activity performance of older adults using the activPAL: a rapid review. Healthcare (Basel). 2017;5:94. doi:10.3390/healthcare5040094
- IBM SPSS software. IBM Corp; 2019. Accessed September 3, 2025. https://www.ibm.com/spss
- Kang H. The prevention and handling of the missing data. Korean J Anesthesiol. 2013;64:402-406. doi:10.4097/kjae.2013.64.5.402
- Epstein AM, Jha AK, Orav EJ. The relationship between hospital admission rates and rehospitalizations. N Engl J Med. 2011;365:2287-2295. doi:10.1056/NEJMsa1101942
- Bogaisky M, Dezieck L. Early hospital readmission of nursing home residents and community-dwelling elderly adults discharged from the geriatrics service of an urban teaching hospital: patterns and risk factors. J Am Geriatr Soc. 2015;63:548-552. doi:10.1111/jgs.13317
- Jencks SF, Williams MV, Coleman EA. Rehospitalizations among patients in the Medicare fee-for-service program. N Engl J Med. 2009;360:1418-1428. doi:10.1056/NEJMsa0803563
- Hoyer EH, Needham DM, Atanelov L, Knox B, Friedman M, Brotman DJ. Association of impaired functional status at hospital discharge and subsequent rehospitalization. J Hosp Med. 2014;9:277-282. doi:10.1002/jhm.2152
- Mahoney J, Sager M, Dunham NC, Johnson J. Risk of falls after hospital discharge. J Am Geriatr Soc. 1994;42:269- 274. doi:10.1111/j.1532-5415.1994.tb01750.x
- Hoffman GJ, Liu H, Alexander NB, Tinetti M, Braun TM, Min LC. Posthospital fall injuries and 30-day readmissions in adults 65 years and older. JAMA Netw Open. 2019;2:e194276. doi:10.1001/jamanetworkopen.2019.4276
- Gill DP, Hubbard RA, Koepsell TD, et al. Differences in rate of functional decline across three dementia types. Alzheimers Dement. 2013;9:S63-S71. doi:10.1016/j.jalz.2012.10.010
- Auyeung TW, Kwok T, Lee J, Leung PC, Leung J, Woo J. Functional decline in cognitive impairment–the relationship between physical and cognitive function. Neuroepidemiology. 2008;31:167-173. doi:10.1159/000154929
- Patti A, Zangla D, Sahin FN, et al. Physical exercise and prevention of falls. Effects of a Pilates training method compared with a general physical activity program. Medicine (Baltimore). 2021;100:e25289. doi:10.1097/MD.0000000000025289
- Nagarkar A, Kulkarni S. Association between daily activities and fall in older adults: an analysis of longitudinal ageing study in India (2017-18). BMC Geriatr. 2022;22:203. doi:10.1186/s12877-022-02879-x
- Ek S, Rizzuto D, Xu W, Calderón-Larrañaga A, Welmer AK. Predictors for functional decline after an injurious fall: a population-based cohort study. Aging Clin Exp Res. 2021;33:2183-2190. doi:10.1007/s40520-020-01747-1
- Dagnino APA, Campos MM. Chronic pain in the elderly: mechanisms and perspectives. Front Hum Neurosci. 2022;16:736688. doi:10.3389/fnhum.2022.736688
- Ritchie CS, Patel K, Boscardin J, et al. Impact of persistent pain on function, cognition, and well-being of older adults. J Am Geriatr Soc. 2023;71:26-35. doi:10.1111/jgs.18125
- Han TS, Murray P, Robin J, et al. Evaluation of the association of length of stay in hospital and outcomes. Int J Qual Health Care. 2022;34:mzab160. doi:10.1093/intqhc/ mzab160
- Lærum-Onsager E, Molin M, Olsen CF, et al. Effect of nutritional and physical exercise intervention on hospital readmission for patients aged 65 or older: a systematic review and meta-analysis of randomized controlled trials. Int J Behav Nutr Phys Act. 2021;18:62. doi:10.1186/s12966-021-01123-w
- Van Walraven C, Bennett C, Jennings A, Austin PC, Forster AJ. Proportion of hospital readmissions deemed avoidable: a systematic review. CMAJ. 2011;183:E391-E402. doi:10.1503/cmaj.101860
Deconditioning among hospitalized older adults contributes to significant decline in posthospitalization functional ability, physical performance, and physical activity.1-10 Previous hospital-to-home interventions have targeted improving function and physical activity, including recent programs leveraging home telehealth as a feasible and potentially effective mode of delivering in-home exercise and rehabilitation.11-14 However, pilot interventions have shown mixed effectiveness.11,12,14 This study expands on a previously published intervention describing a pilot home telehealth program for veterans posthospital discharge that demonstrated significant 6-month improvement in physical activity as well as trends in physical function improvement, including among those with cognitive impairment.15 Factors that contribute to improved outcomes are the focus of the present study.
Key factors underlying the complexity of hospital-to-home transitions include hospitalization elements (ie, reason for admission and length of stay), associated posthospital syndromes (ie, postdischarge falls, medication changes, cognitive impairment, and pain), and postdischarge health care application (ie, physical therapy and hospital readmission).16-18 These factors may be associated with postdischarge functional ability, physical performance, and physical activity, but their direct influence on intervention outcomes is unclear (Figure 1).5,7,9,16-20 The objective of this study was to examine the influence of hospitalization, posthospital syndrome, and postdischarge health care application factors on outcomes of a US Department of Veterans Affairs (VA) Video Connect (VVC) intervention to enhance function and physical activity in older adults posthospital discharge.
health care application factors on physical activity, functional ability, and
physical performance intervention outcomes.
Methods
The previous analysis reported on patient characteristics, program feasibility, and preliminary outcomes.13,15 The current study reports on relationships between hospitalization, posthospital syndrome, and postdischarge health care application factors and change in key outcomes, namely postdischarge self-reported functional ability, physical performance, and physical activity from baseline to endpoint.
Participants provided written informed consent. The protocol and consent forms were approved by the VA Ann Arbor Healthcare System (VAAAHS) Research and Development Committee, and the project was registered on clinicaltrials.gov (NCT04045054).
Intervention
The pilot program targeted older adults following recent hospital discharge from VAAAHS. Participants were eligible if they were aged ≥ 50 years, had been discharged following an inpatient stay in the past 1 to 2 weeks, evaluated by physical therapy during hospitalization with stated rehabilitation goals on discharge, and followed by a VAAAHS primary care physician. Participants were either recruited during hospital admission or shortly after discharge.13
An experienced physical activity trainer (PAT) supported the progression of participants’ rehabilitation goals via a home exercise program and coached the patient and caregiver to optimize functional ability, physical performance, and physical activity. The PAT was a nonlicensed research assistant with extensive experience in applying standard physical activity enhancement protocols (eg, increased walking) to older adults with comorbidities. Participation in the program lasted about 6 months. Initiation of the PAT program was delayed if the patient was already receiving postdischarge home-based or outpatient physical therapy. The PAT contacted the patient weekly via VVC for the first 6 weeks, then monthly for a total of 6 months. Each contact included information on optimal walking form, injury prevention, program progression, and ways to incorporate sit-to-stand transitions, nonsitting behavior, and walking into daily routines. The initial VVC contact lasted about 60 minutes and subsequent sessions lasted about 30 minutes.13
Demographic characteristics were self-reported by participants and included age, sex, race, years of education, and marital status. Clinical characteristics were obtained from each participant’s electronic health record (EHR), including copay status, index hospitalization length of stay, admission diagnosis, and postsurgery status (postsurgery vs nonpostsurgery). Intervention adherence was tracked as the number of PAT sessions attended.
Posthospital Syndrome Factors
Participant falls (categorized as those who reported a fall vs those who did not) and medication changes (number of changes reported, including new medication, discontinued medication, dose changes, medication changes, or changes in medication schedule) were reported by participants or caregivers during each VVC contact. Participants completed the Montreal Cognitive Assessment (MoCA) at baseline, and were dichotomized into 2 groups: no cognitive impairment (MoCA score ≥ 26) and mild to moderate cognitive impairment (MoCA score 10-25).13,21
Participants rated how much pain interfered with their normal daily activities since the previous VVC session on a 5-point Likert scale (1, not at all; to 5, extremely).22 Similar to prior research, participants were placed into 2 groups based on their mean pain interference score (individuals with scores from 1.0 to 2.0 in 1 group, and individuals with > 2.0 in another).23-25 Participants were separated into a no or mild pain interference group and a moderate to severe pain interference group. Hospital readmissions (VA and non-VA) and postdischarge physical therapy outcomes were obtained from the participant’s EHR, including primary care visits.
Outcomes
Outcomes were collected at baseline (posthospital discharge) and 6 months postenrollment.
Self-Reported Functional Ability. This measure is provided by participants or caregivers and measured by the Katz Index of Independence in Activities of Daily Living (ADL), Lawton and Brody Instrumental ADL Scale (IADL), Nagi Disability Model, and Rosow-Breslau Scale. The Katz ADL assesses the ability to complete 6 self-care activities and awards 1 point for independence and 0 if the individual is dependent (total score range, 0-6).26 The Lawton and Brody IADL measures an individual’s independence in 8 instrumental ADLs; it awards 1 point for independence and 0 if the individual is dependent (total score range, 0-8).27 The Nagi Disability Model evaluates an individual’s difficulty performing 5 tasks (total score range, 0-5) and tallies the number of items with a response other than “no difficulty at all” (higher total score indicates greater difficulty). 28 The Rosow-Breslau Scale is a 3-item measure of mobility disability; individual responses are 0 (no help) and 1 (requires help or unable); higher total score (range, 0-3) indicates greater disability.29
Physical Performance. Measured using the Short Physical Performance Battery (SPPB), which evaluates standing balance, sit to stand, and walking performance. Scores range from 0 to 4 on the balance, gait speed, and chair stand tests, for a total composite score between 0 and 12 (higher score indicates better performance).30
Physical Activity. Measured using actigraphy, namely a physical activity monitor adherent to the thigh (activ-PAL3TM, PAL Technologies Ltd., Glasgow, UK).31 Participants were instructed to wear the activPal for ≥ 1 week. Participants with a minimum of 5 days of wear were included in this analysis.
Data Analyses
Analyses were performed using SPSS software version 29.0.32 Continuous variables were summarized using mean (SD) or median and IQR using the weighted average method; categorical variables were summarized using frequencies and percentages. Baseline scores on outcome variables were compared by categorical hospitalization, posthospital syndrome, and postdischarge health care application factor variables using Mann-Whitney U tests. The differences between outcome variables from baseline to endpoint were then calculated to produce change scores. Relationships between the number of PAT sessions attended and baseline outcomes and outcome change scores were estimated using Spearman correlations. Relationships between categorical factors (hospitalization, posthospital syndrome, and postdischarge health care application) and outcome variable change scores (which were normally distributed) were examined using Mann-Whitney U tests. Relationships with continuous hospitalization (length of stay) and posthospital syndrome factors (medication changes) were estimated using Spearman correlations. Effect sizes (ES) were estimated with Cohen d; small (d = 0.2), medium (d = 0.5), or large (d ≥ 0.8). Missing data were handled using pairwise deletion.33 Therefore, sample sizes were reported for each analysis. For all statistical tests, P < .05 was considered significant.
Results
Twenty-four individuals completed the pilot intervention.15 Mean (SD) age was 73.6 (8.1) years (range, 64-93 years) and participants were predominantly White males (Table 1). Eight participants had a high school education only and 13 had more than a high school education. Diagnoses at admission included 9 patients with orthopedic/musculoskeletal conditions (6 were for joint replacement), 6 patients with vascular/pulmonary conditions, and 4 with gastrointestinal/renal/urological conditions. Of the 11 postsurgery participants, 7 were orthopedic, 4 were gastrointestinal, and 1 was peripheral vascular.
Baseline outcome scores did not differ significantly between groups, except individuals with moderate to severe pain interference reported a significantly lower IADL score (median [IQR] 4 [2-7]) than individuals with mild or moderate pain interference (median [IQR] 8 [7-8]; P = .02) (Table 2). The mean (SD) number of PAT sessions attended was 9.3 (3.7) (range, 3-19). There were no significant relationships between number of sessions attended and any baseline outcome variables or outcome change scores.
Hospitalization Factors
Participants who were postsurgery tended to have greater improvement than individuals who were nonpostsurgery in ADLs (median [IQR] 0 [0-1.5]; ES, 0.6; P = .10) and SPPB (median [IQR] 2 [1.5-9]; ES, 0.9; P = .07), but the improvements were not statistically significant (Table 3). Mean (SD) length of stay of the index hospitalization was 6.7 (6.1) days. Longer length of stay was significantly correlated with an increase in Nagi score (ρ, 0.45; 95% CI, 0.01-0.75). There were no other significant or trending relationships between length of stay and outcome variables.
Posthospital Syndrome Factors
The 16 participants with mild to moderate cognitive impairment had less improvement in ADLs (median [IQR] 0 [0-1]) than the 8 participants with no impairment (median [IQR] 0 [-0.75 to 0]; ES, -1.1; P = .04). Change in outcome variables from baseline to endpoint did not significantly differ between the 8 patients who reported a fall compared with the 13 who did not, nor were any trends observed. Change in outcome variables from baseline to endpoint also did not significantly differ between the 8 participants who reported no or mild pain interference compared with the 10 patients with moderate to severe pain interference, nor were any trends observed. Mean (SD) number of medication changes was 2.5 (1.6). Higher number of medication changes was significantly correlated with a decrease in Rosow-Breslau score (ρ, -0.47; 95% CI, -0.76 to -0.02). There were no other significant or trending relationships between number of medication changes and outcome variables.
Postdischarge Health Care Application Factors
The 16 participants who attended posthospital physical therapy trended towards less improvement in IADLs (median [IQR] 0 [-0.5 to 1.5]; ES, -0.7; P = .11) and SPPB (median [IQR] 2 [-3.0 to 4.5]; ES, -0.5; P = .15) than the 8 patients with no postdischarge physical therapy. Eleven participants were readmitted, while 13 had no readmissions in their medical records between baseline and endpoint. Participants with ≥ 1 readmission experienced a greater increase in Rosow-Breslau score (median [IQR] 0 [-0.5 to 1.0]) than those not readmitted (median [IQR] 0 [-1.25 to 0.25]; ES, 1.0; P = .03). Borderline greater improvement in number of steps was found in those not readmitted (median [IQR] 3365.6 [274.4-7710.9]) compared with those readmitted (median [IQR] 319.9 [-136.1 to 774.5]; ES, -1.3; P = .05). Patients who were readmitted also tended to have lower and not statistically significant improvements in SPPB (median [IQR] 1 [-4.0 to 5.3]) compared with those not readmitted (median [IQR] 2 [0.3-3.8]; ES, -0.5; P = .17) (Table 3).
Discussion
This study examined the association between hospitalization, posthospital syndrome, and postdischarge health care use in patients undergoing a VVC-based intervention following hospital discharge. Participants who had no or mild cognitive impairment, no readmissions, higher medication changes, and a shorter hospital length of stay tended to experience lower disability, including in mobility and ADLs. This suggests individuals who are less clinically complex may be more likely to benefit from this type of virtual rehabilitation program. These findings are consistent with clinical experiences; home-based programs to improve physical activity posthospital discharge can be challenging for those who were medically ill (and did not undergo a specific surgical procedure), cognitively impaired, and become acutely ill and trigger hospital readmission. 15 For example, the sample in this study had higher rates of falls, pain, and readmissions compared to previous research.2,3,34-39
The importance of posthospital syndrome in the context of recovery of function and health at home following hospitalization is well documented.16-18 The potential impact of posthospital syndrome on physical activity-focused interventions is less understood. In our analysis, participants with mild or moderate cognitive impairment tended to become more dependent in their ADLs, while those with no cognitive impairment tended to become more independent in their ADLs. This functional decline over time is perhaps expected in persons with cognitive impairment, but the significant difference with a large ES warrants further consideration on how to tailor interventions to better promote functional recovery in these individuals.40,41 While some cognitive decline may not be preventable, this finding supports the need to promote healthy cognitive aging, identify declines in cognition, and work to mitigate additional decline. Programs specifically designed to promote function and physical activity in older adults with cognitive impairment are needed, especially during care transitions.41-43
While participants reported that falls and pain interference did not have a significant impact on change in outcomes between baseline and endpoint, these areas need further investigation. Falls and pain have been associated with function and physical activity in older adults.42-46 Pain is common, yet underappreciated during older adult hospital-to-home transitions.11,12,45,46 There is a need for more comprehensive assessment of pain (including pain intensity) and qualitative research.
Hospitalization and postdischarge health care application factors may have a significant impact on home-telehealth physical activity intervention success. Individuals who were postsurgery tended to have greater improvements in ADLs and physical performance. Most postsurgery participants had joint replacement surgery. Postsurgery status may not be modifiable, but it is important to note expected differences in recovery between medical and surgical admissions and the need to tailor care based on admission diagnosis. Those with a longer length of hospital stay may be considered at higher risk of suboptimal outcomes postdischarge, which indicates an opportunity for targeting resources and support, in addition to efforts of reducing length of stay where possible.47
Readmissions were significantly related to a change in Rosow-Breslau mobility disability score. This may indicate the detrimental impact a readmission can have on increasing mobility and physical activity postdischarge, or the potential of this pilot program to impact readmissions by increasing mobility and physical activity, contrary to prior physical exercise interventions.5,7,9,48 With 5% to 79% of readmissions considered preventable, continued efforts and program dissemination and implementation to address preventable readmissions are warranted.49 Individuals with postdischarge physical therapy (prior to beginning the pilot program) tended to demonstrate less improvement in disability and physical performance. This relationship needs further investigation; the 2 groups did not appear to have significant differences at baseline, albeit with a small sample size. It is possible they experienced initial improvements with postdischarge physical therapy and plateaued or had little further reserve to improve upon entering the VVC program.
Strengths and Limitations
This pilot program provided evaluative data on the use of VVC to enhance function and physical activity in older adults posthospital discharge. It included individual (eg, fall, pain, cognitive impairment) and health service (eg, readmission, physical therapy) level factors as predictors of function and physical activity posthospitalization.5,7,9,15-19
The results of this pilot project stem from a small sample lacking diversity in terms of race, ethnicity, and sex. There was some variation in baseline and endpoints between participants, and when hospitalization, posthospital syndrome, and postdischarge health care application factors were collected. The majority of participants were recruited within a month postdischarge, and the program lasted about 6 months. Data collection was attempted at regular PAT contacts, but there was some variation in when visits occurred based on participant availability and preference. Some participants had missing data, which was handled using pairwise deletion.33 Larger studies are needed to confirm the findings of this study, particularly the trends that did not reach statistical significance. Home health services other than physical therapy (eg, nursing, occupational therapy) were not fully accounted for and should be considered in future research.
Conclusions
In patients undergoing a 6-month pilot VVC-based physical activity intervention posthospital discharge, improvements in mobility and disability were most likely in those who had no cognitive impairment and were not readmitted. Larger sample and qualitative investigations are necessary to optimize outcomes for patients who meet these clinical profiles.
- Liebzeit D, Bratzke L, Boltz M, Purvis S, King B. Getting back to normal: a grounded theory study of function in post-hospitalized older adults. Gerontologist. 2020;60:704-714. doi:10.1093/geront/gnz057
- Ponzetto M, Zanocchi M, Maero B, et al. Post-hospitalization mortality in the elderly. Arch Gerontol Geriatr. 2003;36:83-91. doi:10.1016/s0167-4943(02)00061-4
- Buurman BM, Hoogerduijn JG, de Haan RJ, et al. Geriatric conditions in acutely hospitalized older patients: prevalence and one-year survival and functional decline. PLoS One. 2011;6:e26951. doi:10.1371/journal.pone.0026951
- Ponzetto M, Maero B, Maina P, et al. Risk factors for early and late mortality in hospitalized older patients: the continuing importance of functional status. J Gerontol A Biol Sci Med Sci. 2003;58:1049-1054. doi:10.1093/gerona/58.11.m1049
- Huang HT, Chang CM, Liu LF, Lin HS, Chen CH. Trajectories and predictors of functional decline of hospitalised older patients. J Clin Nurs. 2013;22:1322-1331. doi:10.1111/jocn.12055
- Boyd CM, Landefeld CS, Counsell SR, et al. Recovery of activities of daily living in older adults after hospitalization for acute medical illness. J Am Geriatr Soc. 2008;56:2171- 2179. doi:10.1111/j.1532-5415.2008.02023.x
- Helvik AS, Selbæk G, Engedal K. Functional decline in older adults one year after hospitalization. Arch Gerontol Geriatr. 2013;57:305-310. doi:10.1016/j.archger.2013.05.008
- Zaslavsky O, Zisberg A, Shadmi E. Impact of functional change before and during hospitalization on functional recovery 1 month following hospitalization. J Gerontol Biol Sci Med Sci. 2015;70:381-386. doi:10.1093/gerona/glu168
- Chen CC, Wang C, Huang GH. Functional trajectory 6 months posthospitalization: a cohort study of older hospitalized patients in Taiwan. Nurs Res. 2008;57:93-100. doi:10.1097/01.NNR.0000313485.18670.e2
- Kleinpell RM, Fletcher K, Jennings BM. Reducing functional decline in hospitalized elderly. In: Hughes RG, ed. Patient Safety and Quality: An Evidence-Based Handbook for Nurses. Agency for Healthcare Research and Quality (US); 2008. Accessed September 3, 2025. http://www.ncbi.nlm.nih.gov/books/NBK2629/
- Liebzeit D, Rutkowski R, Arbaje AI, Fields B, Werner NE. A scoping review of interventions for older adults transitioning from hospital to home. J Am Geriatr Soc. 2021;69:2950-2962. doi:10.1111/jgs.17323
- Hladkowicz E, Dumitrascu F, Auais M, et al. Evaluations of postoperative transitions in care for older adults: a scoping review. BMC Geriatr. 2022;22:329. doi:10.1186/s12877-022-02989-6
- Alexander NB, Phillips K, Wagner-Felkey J, et al. Team VA Video Connect (VVC) to optimize mobility and physical activity in post-hospital discharge older veterans: baseline assessment. BMC Geriatr. 2021;21:502. doi:10.1186/s12877-021-02454-w
- Dawson R, Oliveira JS, Kwok WS, et al. Exercise interventions delivered through telehealth to improve physical functioning for older adults with frailty, cognitive, or mobility disability: a systematic review and meta-analysis. Telemed J E Health. 2024;30:940-950. doi:10.1089/tmj.2023.0177
- Liebzeit D, Phillips KK, Hogikyan RV, Cigolle CT, Alexander NB. A pilot home-telehealth program to enhance functional ability, physical performance, and physical activity in older adult veterans post-hospital discharge. Res Gerontol Nurs. 2024;17:271-279. doi:10.3928/19404921-20241105-01
- Krumholz HM. Post-hospital syndrome—an acquired, transient condition of generalized risk. N Engl J Med. 2013;368:100-102. doi:10.1056/NEJMp1212324
- Caraballo C, Dharmarajan K, Krumholz HM. Post hospital syndrome: is the stress of hospitalization causing harm? Rev Esp Cardiol (Engl Ed). 2019;72:896-898. doi:10.1016/j.rec.2019.04.010
- Rawal S, Kwan JL, Razak F, et al. Association of the trauma of hospitalization with 30-day readmission or emergency department visit. JAMA Intern Med. 2019;179:38- 45. doi:10.1001/jamainternmed.2018.5100
- Dutzi I, Schwenk M, Kirchner M, Jooss E, Bauer JM, Hauer K. Influence of cognitive impairment on rehabilitation received and its mediating effect on functional recovery. J Alzheimers Dis. 2021;84:745-756. doi:10.3233/JAD-210620
- Uriz-Otano F, Uriz-Otano JI, Malafarina V. Factors associated with short-term functional recovery in elderly people with a hip fracture. Influence ofcognitiveimpairment. JAmMedDirAssoc. 2015;16:215-220. doi:10.1016/j.jamda.2014.09.009
- Nasreddine ZS, Phillips NA, Bédirian V, et al. The Montreal Cognitive Assessment, MoCA: a brief screening tool for mild cognitive impairment. J Am Geriatr Soc. 2005;53:695-699. doi:10.1111/j.1532-5415.2005.53221.x
- Ware JE Jr, Sherbourne CD. The MOS 36-item short-form health survey (SF-36). I. Conceptual framework and item selection. Med Care. 1992;30:473-483.
- White RS, Jiang J, Hall CB, et al. Higher perceived stress scale scores are associated with higher pain intensity and pain interference levels in older adults. J Am Geriatr Soc. 2014;62:2350-2356. doi:10.1111/jgs.13135
- Blyth FM, March LM, Brnabic AJ, et al. Chronic pain in Australia: a prevalence study. Pain. 2001;89:127-134. doi:10.1016/s0304-3959(00)00355-9
- Thomas E, Peat G, Harris L, Wilkie R, Croft PR. The prevalence of pain and pain interference in a general population of older adults: cross-sectional findings from the North Staffordshire Osteoarthritis Project (NorStOP). Pain. 2004;110:361-368. doi:10.1016/j.pain.2004.04.017
- Katz S, Ford AB, Moskowitz RW, Jackson BA, Jaffe MW. Studies of illness in the aged. The index of ADL: a standardized measure of biological and psychosocial function. JAMA. 1963;185:914-919. doi:10.1001/jama.1963.03060120024016
- Lawton MP, Brody EM. Assessment of older people: self-maintaining and instrumental activities of daily living. Gerontologist. 1969;9:179-186.
- Alexander NB, Guire KE, Thelen DG, et al. Self-reported walking ability predicts functional mobility performance in frail older adults. J Am Geriatr Soc. 2000;48:1408-1413. doi:10.1111/j.1532-5415.2000.tb02630.x
- Rosow I, Breslau N. A Guttman health scale for the aged. J Gerontol. 1966;21:556-559. doi:10.1093/geronj/21.4.556
- Guralnik JM, Simonsick EM, Ferrucci L, et al. A short physical performance battery assessing lower extremity function: association with self-reported disability and prediction of mortality and nursing home admission. J Gerontol. 1994;49:M85-M94. doi:10.1093/geronj/49.2.m85
- Chan CS, Slaughter SE, Jones CA, Ickert C, Wagg AS. Measuring activity performance of older adults using the activPAL: a rapid review. Healthcare (Basel). 2017;5:94. doi:10.3390/healthcare5040094
- IBM SPSS software. IBM Corp; 2019. Accessed September 3, 2025. https://www.ibm.com/spss
- Kang H. The prevention and handling of the missing data. Korean J Anesthesiol. 2013;64:402-406. doi:10.4097/kjae.2013.64.5.402
- Epstein AM, Jha AK, Orav EJ. The relationship between hospital admission rates and rehospitalizations. N Engl J Med. 2011;365:2287-2295. doi:10.1056/NEJMsa1101942
- Bogaisky M, Dezieck L. Early hospital readmission of nursing home residents and community-dwelling elderly adults discharged from the geriatrics service of an urban teaching hospital: patterns and risk factors. J Am Geriatr Soc. 2015;63:548-552. doi:10.1111/jgs.13317
- Jencks SF, Williams MV, Coleman EA. Rehospitalizations among patients in the Medicare fee-for-service program. N Engl J Med. 2009;360:1418-1428. doi:10.1056/NEJMsa0803563
- Hoyer EH, Needham DM, Atanelov L, Knox B, Friedman M, Brotman DJ. Association of impaired functional status at hospital discharge and subsequent rehospitalization. J Hosp Med. 2014;9:277-282. doi:10.1002/jhm.2152
- Mahoney J, Sager M, Dunham NC, Johnson J. Risk of falls after hospital discharge. J Am Geriatr Soc. 1994;42:269- 274. doi:10.1111/j.1532-5415.1994.tb01750.x
- Hoffman GJ, Liu H, Alexander NB, Tinetti M, Braun TM, Min LC. Posthospital fall injuries and 30-day readmissions in adults 65 years and older. JAMA Netw Open. 2019;2:e194276. doi:10.1001/jamanetworkopen.2019.4276
- Gill DP, Hubbard RA, Koepsell TD, et al. Differences in rate of functional decline across three dementia types. Alzheimers Dement. 2013;9:S63-S71. doi:10.1016/j.jalz.2012.10.010
- Auyeung TW, Kwok T, Lee J, Leung PC, Leung J, Woo J. Functional decline in cognitive impairment–the relationship between physical and cognitive function. Neuroepidemiology. 2008;31:167-173. doi:10.1159/000154929
- Patti A, Zangla D, Sahin FN, et al. Physical exercise and prevention of falls. Effects of a Pilates training method compared with a general physical activity program. Medicine (Baltimore). 2021;100:e25289. doi:10.1097/MD.0000000000025289
- Nagarkar A, Kulkarni S. Association between daily activities and fall in older adults: an analysis of longitudinal ageing study in India (2017-18). BMC Geriatr. 2022;22:203. doi:10.1186/s12877-022-02879-x
- Ek S, Rizzuto D, Xu W, Calderón-Larrañaga A, Welmer AK. Predictors for functional decline after an injurious fall: a population-based cohort study. Aging Clin Exp Res. 2021;33:2183-2190. doi:10.1007/s40520-020-01747-1
- Dagnino APA, Campos MM. Chronic pain in the elderly: mechanisms and perspectives. Front Hum Neurosci. 2022;16:736688. doi:10.3389/fnhum.2022.736688
- Ritchie CS, Patel K, Boscardin J, et al. Impact of persistent pain on function, cognition, and well-being of older adults. J Am Geriatr Soc. 2023;71:26-35. doi:10.1111/jgs.18125
- Han TS, Murray P, Robin J, et al. Evaluation of the association of length of stay in hospital and outcomes. Int J Qual Health Care. 2022;34:mzab160. doi:10.1093/intqhc/ mzab160
- Lærum-Onsager E, Molin M, Olsen CF, et al. Effect of nutritional and physical exercise intervention on hospital readmission for patients aged 65 or older: a systematic review and meta-analysis of randomized controlled trials. Int J Behav Nutr Phys Act. 2021;18:62. doi:10.1186/s12966-021-01123-w
- Van Walraven C, Bennett C, Jennings A, Austin PC, Forster AJ. Proportion of hospital readmissions deemed avoidable: a systematic review. CMAJ. 2011;183:E391-E402. doi:10.1503/cmaj.101860
Factors Influencing Outcomes of a Telehealth-Based Physical Activity Program in Older Veterans Postdischarge
Factors Influencing Outcomes of a Telehealth-Based Physical Activity Program in Older Veterans Postdischarge
Preoperative Diabetes Management for Patients Undergoing Elective Surgeries at a Veterans Affairs Medical Center
Preoperative Diabetes Management for Patients Undergoing Elective Surgeries at a Veterans Affairs Medical Center
More than 38 million people in the United States (12%) have diabetes mellitus (DM), though 1 in 5 are unaware they have DM.1 The prevalence among veterans is even more substantial, impacting nearly 25% of those who received care from the US Department of Veterans Affairs (VA).2 DM can lead to increased health care costs in addition to various complications (eg, cardiovascular, renal), especially if left uncontrolled.1,3 similar impact is found in the perioperative period (defined as at or around the time of an operation), as multiple studies have found that uncontrolled preoperative DM can result in worsened surgical outcomes, including longer hospital stays, more infectious complications, and higher perioperative mortality.4-6
In contrast, adequate glycemic control assessed with blood glucose levels has been shown to decrease the incidence of postoperative infections.7 Optimizing glycemic control during hospital stays, especially postsurgery, has become the standard of care, with most health systems establishing specific protocols. In current literature, most studies examining DM management in the perioperative period are focused on postoperative care, with little attention to the preoperative period.4,6,7
One study found that patients with poor presurgery glycemic control assessed by hemoglobin A1c (HbA1c) levels were more likely to remain hyperglycemic during and after surgery. 8 Blood glucose levels < 200 mg/dL can lead to an increased risk of infection and impaired wound healing, meaning a well-controlled HbA1c before a procedure serves as a potential factor for success.9 The 2025 American Diabetes Association (ADA) Standards of Care (SOC) recommendation is to target HbA1c < 8% whenever possible, and some health systems require lower levels (eg, < 7% or 7.5%).10 With that goal in mind and knowing that preoperative hyperglycemia has been shown to be a contributing factor in the delay or cancellation of surgical cases, an argument can be made that attention to preoperative DM management also should be a focus for health care systems performing surgeries.8,9,11
Attention to glucose control during preoperative care offers an opportunity to screen for DM in patients who may not have been screened otherwise and to standardize perioperative DM management. Since DM disproportionately impacts veterans, this is a pertinent issue to the VA. Veterans can be more susceptible to complications if DM is left uncontrolled prior to surgery. To determine readiness for surgery and control of comorbid conditions such as DM before a planned surgery, facilities often perform a preoperative clinic assessment, often in a multidisciplinary clinic.
At Veteran Health Indiana (VHI), a presurgery clinic visit involving the primary surgery service (physician, nurse practitioner, and/or a physician assistant) is conducted 1 to 2 months prior to the planned procedure to determine whether a patient is ready for surgery. During this visit, patients receive a packet with instructions for various tasks and medications, such as applying topical antibiotic prophylaxis on the anticipated surgical site. This is documented in the form of a note in the VHI Computerized Patient Record System (CPRS). The medication instructions are provided according to the preferences of the surgical team. These may be templated notes that contain general directions on the timing and dosing of specific medications, in addition to instructions for holding or reducing doses when appropriate. The instructions can be tailored by the team conducting the preoperative visit (eg, “Take 20 units of insulin glargine the day before surgery” vs “Take half of your long-acting insulin the night before surgery”). Specific to DM, VHI has a nurse-driven day of surgery glucose assessment where point-of-care blood glucose is collected during preoperative holding for most patients.
There is limited research assessing the level of preoperative glycemic control and the incidence of complications in a veteran population. The objective of this study was to gain a baseline understanding of what, if any, standardization exists for preoperative instructions for DM medications and to assess the level of preoperative glycemic control and postoperative complications in patients with DM undergoing major elective surgical procedures.
Methods
This retrospective, single-center chart review was conducted at VHI. The Indiana University and VHI institutional review boards determined that this quality improvement project was exempt from review.
The primary outcome was the number of patients with surgical procedures delayed or canceled due to hyperglycemia or hypoglycemia. Hyperglycemia was defined as blood glucose > 180 mg/dL and hypoglycemia was defined as < 70 mg/dL, slight variations from the current ADA SOC preoperative specific recommendation of a blood glucose reading of 100 to 180 mg/dL within 4 hours of surgery.10 The standard outpatient hypoglycemia definition of blood glucose < 70 mg/dL was chosen because the current goal (< 100 mg/dL) was not the standard in previous ADA SOCs that were in place during the study period. Specifically, the 2018 ADA SOC did not provide preoperative recommendations and the 2019-2021 ADA SOC recommended 80 to 180 mg/dL.10,12-18 For patients who had multiple preoperative blood glucose measurements, the first recorded glucose on the day of the procedure was used.
The secondary outcomes of this study were focused on the preoperative process/care at VHI and postoperative glycemic control. The preoperative process included examining whether medication instructions were given and their quality. Additionally, the number of interventions for hyperglycemia and hypoglycemia were required immediately prior to surgery and the average preoperative HbA1c (measured within 3 months prior to surgery) were collected and analyzed. For postoperative glycemic control, average blood glucose measurements and number of hypoglycemic (< 70 mg/dL) and hyperglycemic (> 180 mg/dL) events were measured in addition to the frequency of changes made at discharge to patients’ DM medication regimens.
The safety outcome of this study assessed commonly observed postoperative complications and was examined up to 30 days postsurgery. These included acute kidney injury (defined using Kidney Disease: Improving Global Outcomes 2012, the standard during the study period), nonfatal myocardial infarction, nonfatal stroke, and surgical site infections, which were identified from the discharge summary written by the primary surgery service.19 All-cause mortality also was collected.
Patients were included if they were admitted for major elective surgeries and had a diagnosis of either type 1 or type 2 DM on their problem list, determined by International Classification of Diseases, Tenth Revision codes. Major elective surgery was defined as a procedure that would likely result in a hospital admission of > 24 hours. Of note, patients may have been included in this study more than once if they had > 1 procedure at least 30 days apart and met inclusion criteria within the time frame. Patients were excluded if they were taking no DM medications or chronic steroids (at any dose), residing in a long-term care facility, being managed by a non-VA clinician prior to surgery, or missing a preoperative blood glucose measurement.
All data were collected from the CPRS. A list of surgical cases involving patients with DM who were scheduled to undergo major elective surgeries from January 1, 2018, to December 31, 2021, at VHI was generated. The list was randomized to a smaller number (N = 394) for data collection due to the time and resource constraints for a pharmacy residency project. All data were deidentified and stored in a secured VA server to protect patient confidentiality. Descriptive statistics were used for all results.
Results
Initially, 2362 surgeries were identified. A randomized sample of 394 charts were reviewed and 131 cases met inclusion criteria. Each case involved a unique patient (Figure). The most common reasons for exclusion were 143 patients with diet-controlled DM and 78 nonelective surgeries. The mean (SD) age of patients was 68 (8) years, and the most were male (98.5%) and White (76.3%) (Table 1).
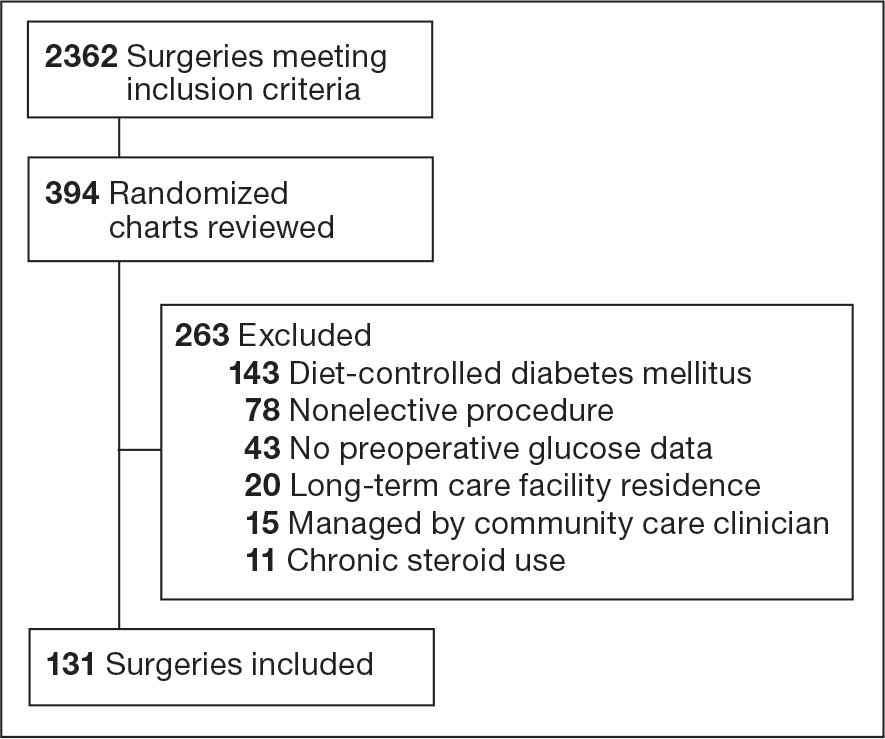
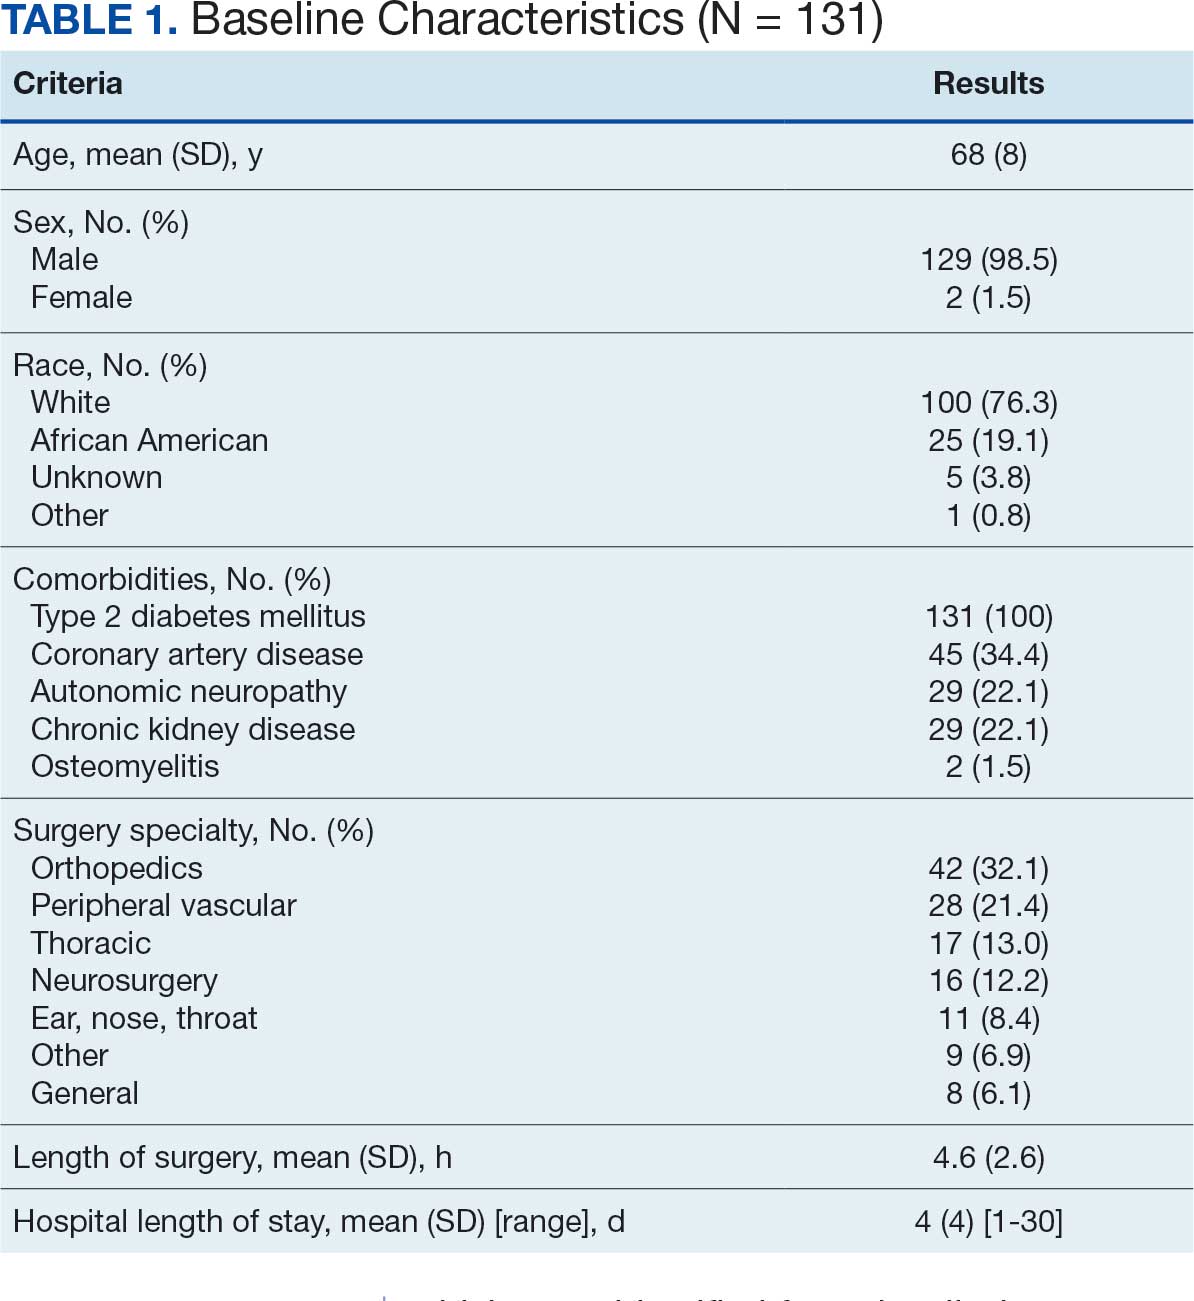
At baseline, 45 of 131 patients (34.4%) had coronary artery disease and 29 (22.1%) each had autonomic neuropathy and chronic kidney disease. Most surgeries were conducted by orthopedic (32.1%) and peripheral vascular (21.4%) specialties. The mean (SD) length of surgery was 4.6 (2.6) hours and of hospital length of stay was 4 (4) days. No patients stayed longer than the 30-day safety outcome follow-up period. All patients had type 2 DM and took a mean 2 DM medications. The 63 patients taking insulin had a mean (SD) total daily dose of 99 (77) U (Table 2). A preoperative HbA1c was collected in 116 patients within 3 months of surgery, with a mean HbA1c of 7.0% (range, 5.3-10.7).
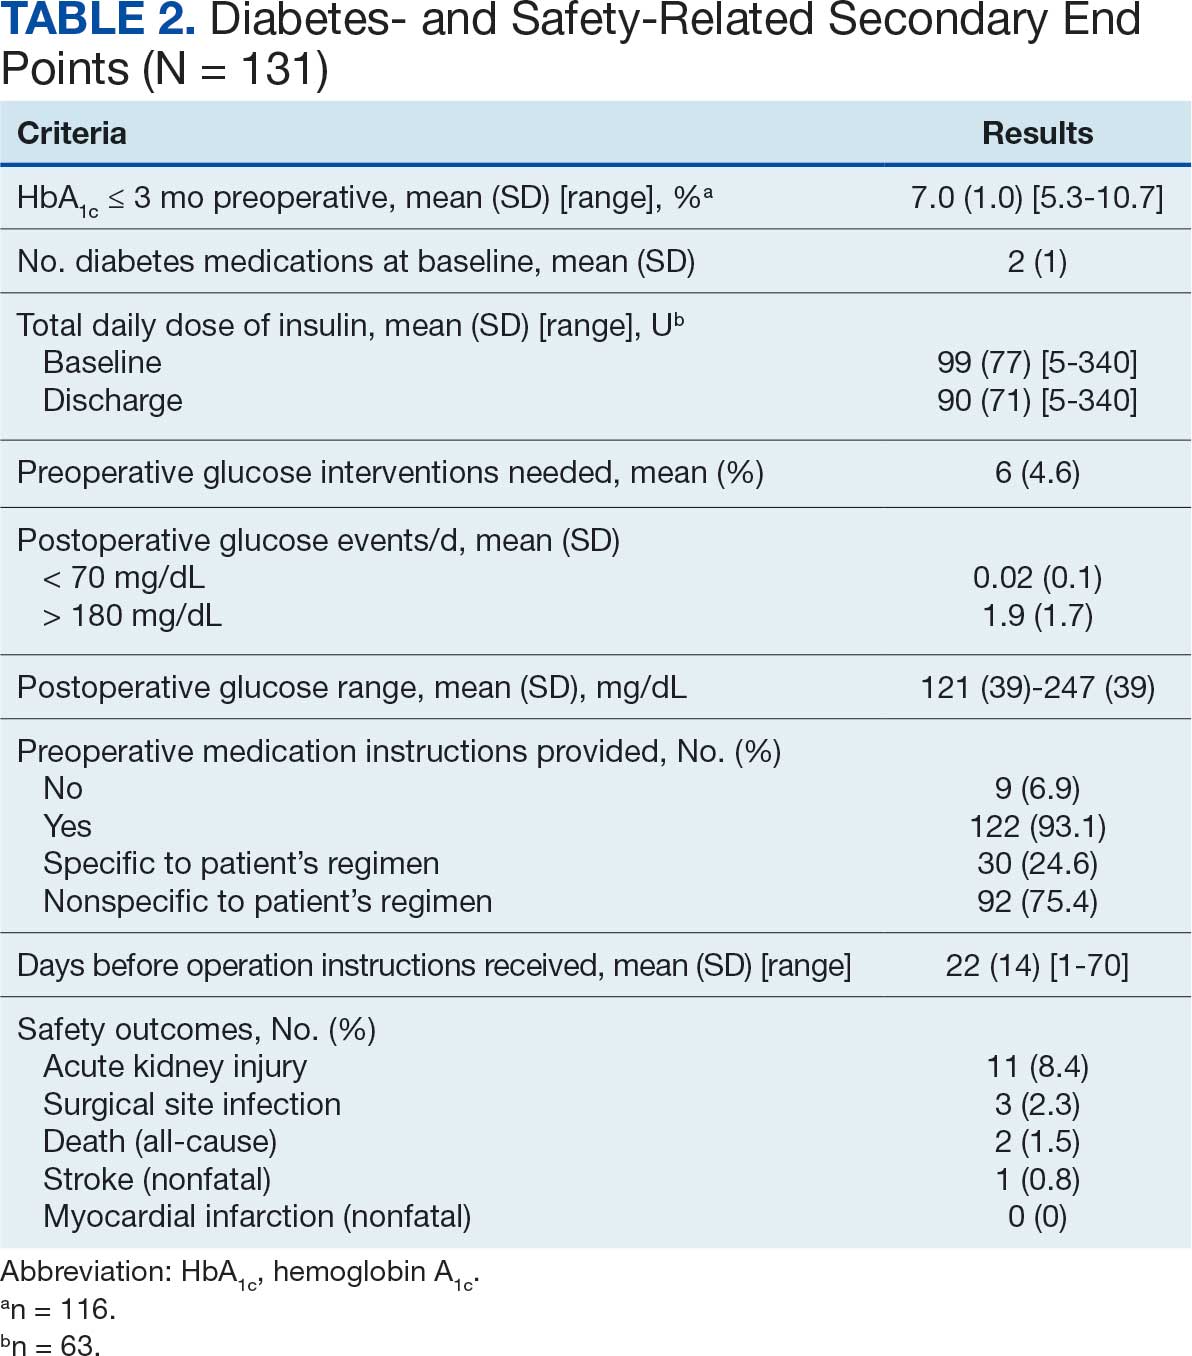
No patients had surgeries delayed or canceled because of uncontrolled DM on the day of surgery. The mean preoperative blood glucose level was 146 mg/dL (range, 73-365) (Table 3). No patients had a preoperative blood glucose level of < 70 mg/dL and 19 (14.5%) had a blood glucose level > 180 mg/dL. Among patients with hyperglycemia immediately prior to surgery, 6 (31.6%) had documentation of insulin being provided.
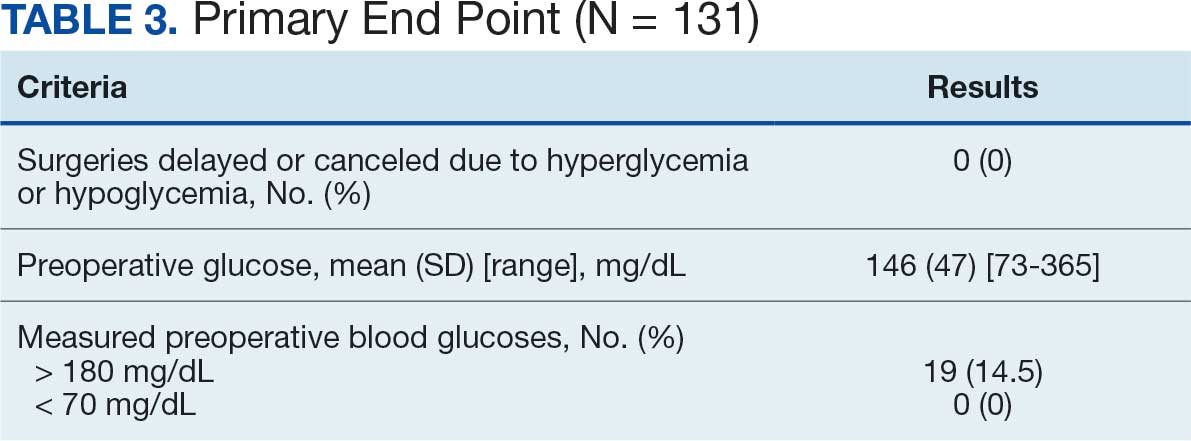
For this sample of patients, the preoperative clinic visit was conducted a mean 22 days prior to the planned surgery date. Among the 131 included patients, 122 (93.1%) had documentation of receiving instructions for DM medications. Among patients who had documented receipt of instructions, only 30 (24.6%) had instructions specifically tailored to their regimen rather than a generic templated form. The mean (SD) preoperative blood glucose was similar for those who received specific perioperative DM instructions at 146 (50) mg/dL when compared with those who did not at 147 (45) mg/dL. The mean (SD) preoperative blood glucose reading for those who had no documentation of receipt of perioperative instructions was 126 (54) mg/dL compared with 147 (46) mg/dL for those who did.
The mean number of postoperative blood glucose events per day was negligible for hypoglycemia and more frequent for hyperglycemia with a mean of 2 events per day. The mean postoperative blood glucose range was 121 to 247 mg/dL with most readings < 180 mg/dL. Upon discharge, most patients continued their home DM regimen with 5 patients (3.8%) having changes made to their regimen upon discharge.
Very few postoperative complications were identified from chart review. The most frequently observed postoperative complications were acute kidney injury, surgical site infections, and nonfatal stroke. There were no documented nonfatal myocardial infarctions. Two patients (1.5%) died within 30 days of the surgery; neither death was deemed to have been related to poor perioperative glycemic control.
Discussion
To our knowledge, this retrospective chart review was the first study to assess preoperative DM management and postoperative complications in a veteran population. VHI is a large, tertiary, level 1a, academic medical center that serves approximately 62,000 veterans annually and performs about 5000 to 6000 surgeries annually, a total that is increasing following the COVID-19 pandemic.20 This study found that the current process of a presurgery clinic visit and day of surgery glucose assessment has prevented surgical delays or cancellations.
Most patients included in this study were well controlled at baseline in accordance with the 2025 ADA SOC HbA1c recommendation of a preoperative HbA1c of < 8%, which may have contributed to no surgical delays or cancellations.10 However, not all patients had HbA1c collected within 3 months of surgery or even had one collected at all. Despite the ADA SOC providing no explicit recommendation for universal HbA1c screening prior to elective procedures, its importance cannot be understated given the body of evidence demonstrating poor outcomes with uncontrolled preoperative DM.8,10 The glycemic control at baseline may have contributed to the very few postsurgical complications observed in this study.
Although the current process at VHI prevented surgical delays and cancellations in this sample, there are still identified areas for improvement. One area is the instructions the patients received. Patients with DM are often prescribed ≥ 1 medication or a combination of insulins, noninsulin injectables, and oral DM medications, and this study population was no different. Because these medications may influence the anesthesia and perioperative periods, the ADA has specific guidance for altering administration schedules in the days leading up to surgery.10
Inappropriate administration of DM medications could lead to perioperative hypoglycemia or hyperglycemia, possibly causing surgical delays, case cancellations, and/or postoperative complications.21 Although these data reveal the specificity and documented receipt that the preoperative DM instructions did not impact the first recorded preoperative blood glucose, future studies should examine patient confidence in how to properly administer their DM medications prior to surgery. It is vital that patients receive clear instructions in accordance with the ADA SOC on whether to continue, hold, or adjust the dose of their medications to prevent fluctuations in blood glucose levels in the perioperative period, ensure safety with anesthesia, and prevent postoperative complications such as acute kidney injury. Of note, compliance with guideline recommendations for medication instructions was not examined because the data collection time frame expanded over multiple years and the recommendations have evolved each year as new data emerge.
Preoperative DM Management
The first key takeaway from this study is to ensure patients are ready for surgery with a formal assessment (typically in the form of a clinic visit) prior to the surgery. One private sector health system published their approach to this by administering an automatic preoperative HbA1c screening for those with a DM diagnosis and all patients with a random plasma glucose ≥ 200 mg/dL.22 Additionally, if the patient's HbA1c level was not at goal prior to surgery (≥ 8% for those with known DM and ≥ 6.5% with no known DM), patients were referred to endocrinology for further management. Increasing attention to the preoperative visit and extending HbA1c testing to all patients regardless of DM status also provides an opportunity to identify individuals living with undiagnosed DM.1
Even though there was no difference in the mean preoperative blood glucose level based on receipt or specificity of preoperative DM instructions, a second takeaway from this study is the importance of ensuring patients receive clear instructions on their DM medication schedule in the perioperative period. A practical first step may be updating the templates used by the primary surgery teams and providing education to the clinicians in the clinic on how to personalize the visits. Because the current preoperative DM process at VHI is managed by the primary surgical team in a clinic visit, there is an opportunity to shift this responsibility to other health care professionals, such as pharmacists—a change shown to reduce unintended omission of home medications following surgery during hospitalization and reduce costs.23,24
Limitations
This study relied on data included in the patient chart. These data include medication interventions made immediately prior to surgery, which can sometimes be inaccurately charted or difficult to find as they are not documented in the typical medication administration record. Also, the safety outcomes were collected from a discharge summary written by different clinicians, which may lead to information bias. Special attention was taken to ensure these data points were collected as accurately as possible, but it is possible some data may be inaccurate from unintentional human error. Additionally, the safety outcome was limited to a 30-day follow-up, but encompassed the entire length of postoperative stay for all included patients. Finally, given this study was retrospective with no comparison group and the intent was to improve processes at VHI, only hypotheses and potential interventions can be generated from this study. Future prospective studies with larger sample sizes and comparator groups are needed to draw further conclusions.
Conclusions
This study found that the current presurgery process at VHI appears to be successful in preventing surgical delays or cancellations due to hyperglycemia or hypoglycemia. Optimizing DM management can improve surgical outcomes by decreasing rates of postoperative complications, and this study added additional evidence in support of that in a unique population: veterans. Insight on the awareness of preoperative blood glucose management should be gleaned from this study, and based on this sample and site, the preadmission screening process and instructions provided to patients can serve as 2 starting points for optimizing elective surgery.
- Centers for Disease Control and Prevention. Diabetes basics. May 15, 2024. Accessed September 24, 2025. https://www.cdc.gov/diabetes/about/index.html
- Liu Y, Sayam S, Shao X, et al. Prevalence of and trends in diabetes among veterans, United States, 2005-2014. Prev Chronic Dis. 2017;14:E135. doi:10.5888/pcd14.170230
- Farmaki P, Damaskos C, Garmpis N, et al . Complications of the Type 2 Diabetes Mellitus. Curr Cardiol Rev. 2020;16(4):249-251. doi:10.2174/1573403X1604201229115531
- Frisch A, Chandra P, Smiley D, et al. Prevalence and clinical outcome of hyperglycemia in the perioperative period in noncardiac surgery. Diabetes Care. 2010;33:1783-1788. doi:10.2337/dc10-0304
- Noordzij PG, Boersma E, Schreiner F, et al. Increased preoperative glucose levels are associated with perioperative mortality in patients undergoing noncardiac, nonvascular surgery. Eur J Endocrinol. 2007;156:137 -142. doi:10.1530/eje.1.02321
- Pomposelli JJ, Baxter JK 3rd, Babineau TJ, et al. Early postoperative glucose control predicts nosocomial infection rate in diabetic patients. JPEN J Parenter Enteral Nutr. 1998;22:77-81. doi:10.1177/01486071980220027
- Umpierrez GE, Smiley D, Jacobs S, et al. Randomized study of basal-bolus insulin therapy in the inpatient management of patients with type 2 diabetes undergoing general surgery (RABBIT 2 surgery). Diabetes Care. 2011;34:256-261. doi:10.2337/dc10-1407
- Pasquel FJ, Gomez-Huelgas R, Anzola I, et al. Predictive value of admission hemoglobin A1c on inpatient glycemic control and response to insulin therapy in medicine and surgery patients with type 2 diabetes. Diabetes Care. 2015;38:e202-e203. doi:10.2337/dc15-1835
- Alexiewicz JM, Kumar D, Smogorzewski M, et al. Polymorphonuclear leukocytes in non-insulin-dependent diabetes mellitus: abnormalities in metabolism and function. Ann Intern Med. 1995;123:919-924. doi:10.7326/0003-4819-123-12-199512150-00004
- American Diabetes Association Professional Practice Committee. 16. Diabetes care in the hospital: Standards of Medical Care in Diabetes—2025. Diabetes Care. 2025;48(1 suppl 1):S321-S334. doi:10.2337/dc25-S016
- Kumar R, Gandhi R. Reasons for cancellation of operation on the day of intended surgery in a multidisciplinary 500 bedded hospital. J Anaesthesiol Clin Pharmacol. 2012;28:66-69. doi:10.4103/0970-9185.92442
- American Diabetes Association. 14. Diabetes care in the hospital: Standards of Medical Care in Diabetes— 2018. Diabetes Care. 2018;41(1 suppl 1):S144- S151. doi:10.2337/dc18-S014
- American Diabetes Association. 15. Diabetes care in the hospital: Standards of Medical Care in Diabetes— 2019. Diabetes Care. 2019;42(suppl 1):S173- S181. doi:10.2337/dc19-S015
- American Diabetes Association. 15. Diabetes care in the hospital: Standards of Medical Care in Diabetes— 2020. Diabetes Care. 2020;43(suppl 1):S193- S202. doi:10.2337/dc20-S015
- American Diabetes Association. 15. Diabetes care in the hospital: Standards of Medical Care in Diabetes— 2021. Diabetes Care. 2021;44(suppl 1):S211- S220. doi:10.2337/dc21-S015
- American Diabetes Association Professional Practice Committee. 16. Diabetes care in the hospital: Standards of Medical Care in Diabetes—2022. Diabetes Care. 2022;45(suppl 1):S244-S253. doi:10.2337/dc22-S016
- ElSayed NA, Aleppo G, Aroda VR, et al. 16. Diabetes care in the hospital: Standards of Care in Diabetes—2023. Diabetes Care. 2023;46(suppl 1):S267-S278. doi:10.2337/dc23-S016
- American Diabetes Association Professional Practice Committee. 16. Diabetes care in the hospital: Standards of Care in Diabetes—2024. Diabetes Care. 2024;47(suppl 1):S295-S306. doi:10.2337/dc24-S016
- Kidney Disease: Improving Global Outcomes (KDIGO) Acute Kidney Injury Work Group. KDIGO Clinical Practice Guideline for Acute Kidney Injury. Kidney Int Suppl. 2012;2:1-138. Accessed September 24, 2025. https:// www.kisupplements.org/issue/S2157-1716(12)X7200-9
- US Department of Veterans Affairs. VA Indiana Healthcare: about us. Accessed September 24, 2025. https:// www.va.gov/indiana-health-care/about-us/
- Koh WX, Phelan R, Hopman WM, et al. Cancellation of elective surgery: rates, reasons and effect on patient satisfaction. Can J Surg. 2021;64:E155-E161. doi:10.1503/cjs.008119
- Pai S-L, Haehn DA, Pitruzzello NE, et al. Reducing infection rates with enhanced preoperative diabetes mellitus diagnosis and optimization processes. South Med J. 2023;116:215-219. doi:10.14423/SMJ.0000000000001507
- Forrester TG, Sullivan S, Snoswell CL, et al. Integrating a pharmacist into the perioperative setting. Aust Health Rev. 2020;44:563-568. doi:10.1071/AH19126
- Hale AR, Coombes ID, Stokes J, et al. Perioperative medication management: expanding the role of the preadmission clinic pharmacist in a single centre, randomised controlled trial of collaborative prescribing. BMJ Open. 2013;3:e003027. doi:10.1136/bmjopen-2013-003027
More than 38 million people in the United States (12%) have diabetes mellitus (DM), though 1 in 5 are unaware they have DM.1 The prevalence among veterans is even more substantial, impacting nearly 25% of those who received care from the US Department of Veterans Affairs (VA).2 DM can lead to increased health care costs in addition to various complications (eg, cardiovascular, renal), especially if left uncontrolled.1,3 similar impact is found in the perioperative period (defined as at or around the time of an operation), as multiple studies have found that uncontrolled preoperative DM can result in worsened surgical outcomes, including longer hospital stays, more infectious complications, and higher perioperative mortality.4-6
In contrast, adequate glycemic control assessed with blood glucose levels has been shown to decrease the incidence of postoperative infections.7 Optimizing glycemic control during hospital stays, especially postsurgery, has become the standard of care, with most health systems establishing specific protocols. In current literature, most studies examining DM management in the perioperative period are focused on postoperative care, with little attention to the preoperative period.4,6,7
One study found that patients with poor presurgery glycemic control assessed by hemoglobin A1c (HbA1c) levels were more likely to remain hyperglycemic during and after surgery. 8 Blood glucose levels < 200 mg/dL can lead to an increased risk of infection and impaired wound healing, meaning a well-controlled HbA1c before a procedure serves as a potential factor for success.9 The 2025 American Diabetes Association (ADA) Standards of Care (SOC) recommendation is to target HbA1c < 8% whenever possible, and some health systems require lower levels (eg, < 7% or 7.5%).10 With that goal in mind and knowing that preoperative hyperglycemia has been shown to be a contributing factor in the delay or cancellation of surgical cases, an argument can be made that attention to preoperative DM management also should be a focus for health care systems performing surgeries.8,9,11
Attention to glucose control during preoperative care offers an opportunity to screen for DM in patients who may not have been screened otherwise and to standardize perioperative DM management. Since DM disproportionately impacts veterans, this is a pertinent issue to the VA. Veterans can be more susceptible to complications if DM is left uncontrolled prior to surgery. To determine readiness for surgery and control of comorbid conditions such as DM before a planned surgery, facilities often perform a preoperative clinic assessment, often in a multidisciplinary clinic.
At Veteran Health Indiana (VHI), a presurgery clinic visit involving the primary surgery service (physician, nurse practitioner, and/or a physician assistant) is conducted 1 to 2 months prior to the planned procedure to determine whether a patient is ready for surgery. During this visit, patients receive a packet with instructions for various tasks and medications, such as applying topical antibiotic prophylaxis on the anticipated surgical site. This is documented in the form of a note in the VHI Computerized Patient Record System (CPRS). The medication instructions are provided according to the preferences of the surgical team. These may be templated notes that contain general directions on the timing and dosing of specific medications, in addition to instructions for holding or reducing doses when appropriate. The instructions can be tailored by the team conducting the preoperative visit (eg, “Take 20 units of insulin glargine the day before surgery” vs “Take half of your long-acting insulin the night before surgery”). Specific to DM, VHI has a nurse-driven day of surgery glucose assessment where point-of-care blood glucose is collected during preoperative holding for most patients.
There is limited research assessing the level of preoperative glycemic control and the incidence of complications in a veteran population. The objective of this study was to gain a baseline understanding of what, if any, standardization exists for preoperative instructions for DM medications and to assess the level of preoperative glycemic control and postoperative complications in patients with DM undergoing major elective surgical procedures.
Methods
This retrospective, single-center chart review was conducted at VHI. The Indiana University and VHI institutional review boards determined that this quality improvement project was exempt from review.
The primary outcome was the number of patients with surgical procedures delayed or canceled due to hyperglycemia or hypoglycemia. Hyperglycemia was defined as blood glucose > 180 mg/dL and hypoglycemia was defined as < 70 mg/dL, slight variations from the current ADA SOC preoperative specific recommendation of a blood glucose reading of 100 to 180 mg/dL within 4 hours of surgery.10 The standard outpatient hypoglycemia definition of blood glucose < 70 mg/dL was chosen because the current goal (< 100 mg/dL) was not the standard in previous ADA SOCs that were in place during the study period. Specifically, the 2018 ADA SOC did not provide preoperative recommendations and the 2019-2021 ADA SOC recommended 80 to 180 mg/dL.10,12-18 For patients who had multiple preoperative blood glucose measurements, the first recorded glucose on the day of the procedure was used.
The secondary outcomes of this study were focused on the preoperative process/care at VHI and postoperative glycemic control. The preoperative process included examining whether medication instructions were given and their quality. Additionally, the number of interventions for hyperglycemia and hypoglycemia were required immediately prior to surgery and the average preoperative HbA1c (measured within 3 months prior to surgery) were collected and analyzed. For postoperative glycemic control, average blood glucose measurements and number of hypoglycemic (< 70 mg/dL) and hyperglycemic (> 180 mg/dL) events were measured in addition to the frequency of changes made at discharge to patients’ DM medication regimens.
The safety outcome of this study assessed commonly observed postoperative complications and was examined up to 30 days postsurgery. These included acute kidney injury (defined using Kidney Disease: Improving Global Outcomes 2012, the standard during the study period), nonfatal myocardial infarction, nonfatal stroke, and surgical site infections, which were identified from the discharge summary written by the primary surgery service.19 All-cause mortality also was collected.
Patients were included if they were admitted for major elective surgeries and had a diagnosis of either type 1 or type 2 DM on their problem list, determined by International Classification of Diseases, Tenth Revision codes. Major elective surgery was defined as a procedure that would likely result in a hospital admission of > 24 hours. Of note, patients may have been included in this study more than once if they had > 1 procedure at least 30 days apart and met inclusion criteria within the time frame. Patients were excluded if they were taking no DM medications or chronic steroids (at any dose), residing in a long-term care facility, being managed by a non-VA clinician prior to surgery, or missing a preoperative blood glucose measurement.
All data were collected from the CPRS. A list of surgical cases involving patients with DM who were scheduled to undergo major elective surgeries from January 1, 2018, to December 31, 2021, at VHI was generated. The list was randomized to a smaller number (N = 394) for data collection due to the time and resource constraints for a pharmacy residency project. All data were deidentified and stored in a secured VA server to protect patient confidentiality. Descriptive statistics were used for all results.
Results
Initially, 2362 surgeries were identified. A randomized sample of 394 charts were reviewed and 131 cases met inclusion criteria. Each case involved a unique patient (Figure). The most common reasons for exclusion were 143 patients with diet-controlled DM and 78 nonelective surgeries. The mean (SD) age of patients was 68 (8) years, and the most were male (98.5%) and White (76.3%) (Table 1).
At baseline, 45 of 131 patients (34.4%) had coronary artery disease and 29 (22.1%) each had autonomic neuropathy and chronic kidney disease. Most surgeries were conducted by orthopedic (32.1%) and peripheral vascular (21.4%) specialties. The mean (SD) length of surgery was 4.6 (2.6) hours and of hospital length of stay was 4 (4) days. No patients stayed longer than the 30-day safety outcome follow-up period. All patients had type 2 DM and took a mean 2 DM medications. The 63 patients taking insulin had a mean (SD) total daily dose of 99 (77) U (Table 2). A preoperative HbA1c was collected in 116 patients within 3 months of surgery, with a mean HbA1c of 7.0% (range, 5.3-10.7).
No patients had surgeries delayed or canceled because of uncontrolled DM on the day of surgery. The mean preoperative blood glucose level was 146 mg/dL (range, 73-365) (Table 3). No patients had a preoperative blood glucose level of < 70 mg/dL and 19 (14.5%) had a blood glucose level > 180 mg/dL. Among patients with hyperglycemia immediately prior to surgery, 6 (31.6%) had documentation of insulin being provided.
For this sample of patients, the preoperative clinic visit was conducted a mean 22 days prior to the planned surgery date. Among the 131 included patients, 122 (93.1%) had documentation of receiving instructions for DM medications. Among patients who had documented receipt of instructions, only 30 (24.6%) had instructions specifically tailored to their regimen rather than a generic templated form. The mean (SD) preoperative blood glucose was similar for those who received specific perioperative DM instructions at 146 (50) mg/dL when compared with those who did not at 147 (45) mg/dL. The mean (SD) preoperative blood glucose reading for those who had no documentation of receipt of perioperative instructions was 126 (54) mg/dL compared with 147 (46) mg/dL for those who did.
The mean number of postoperative blood glucose events per day was negligible for hypoglycemia and more frequent for hyperglycemia with a mean of 2 events per day. The mean postoperative blood glucose range was 121 to 247 mg/dL with most readings < 180 mg/dL. Upon discharge, most patients continued their home DM regimen with 5 patients (3.8%) having changes made to their regimen upon discharge.
Very few postoperative complications were identified from chart review. The most frequently observed postoperative complications were acute kidney injury, surgical site infections, and nonfatal stroke. There were no documented nonfatal myocardial infarctions. Two patients (1.5%) died within 30 days of the surgery; neither death was deemed to have been related to poor perioperative glycemic control.
Discussion
To our knowledge, this retrospective chart review was the first study to assess preoperative DM management and postoperative complications in a veteran population. VHI is a large, tertiary, level 1a, academic medical center that serves approximately 62,000 veterans annually and performs about 5000 to 6000 surgeries annually, a total that is increasing following the COVID-19 pandemic.20 This study found that the current process of a presurgery clinic visit and day of surgery glucose assessment has prevented surgical delays or cancellations.
Most patients included in this study were well controlled at baseline in accordance with the 2025 ADA SOC HbA1c recommendation of a preoperative HbA1c of < 8%, which may have contributed to no surgical delays or cancellations.10 However, not all patients had HbA1c collected within 3 months of surgery or even had one collected at all. Despite the ADA SOC providing no explicit recommendation for universal HbA1c screening prior to elective procedures, its importance cannot be understated given the body of evidence demonstrating poor outcomes with uncontrolled preoperative DM.8,10 The glycemic control at baseline may have contributed to the very few postsurgical complications observed in this study.
Although the current process at VHI prevented surgical delays and cancellations in this sample, there are still identified areas for improvement. One area is the instructions the patients received. Patients with DM are often prescribed ≥ 1 medication or a combination of insulins, noninsulin injectables, and oral DM medications, and this study population was no different. Because these medications may influence the anesthesia and perioperative periods, the ADA has specific guidance for altering administration schedules in the days leading up to surgery.10
Inappropriate administration of DM medications could lead to perioperative hypoglycemia or hyperglycemia, possibly causing surgical delays, case cancellations, and/or postoperative complications.21 Although these data reveal the specificity and documented receipt that the preoperative DM instructions did not impact the first recorded preoperative blood glucose, future studies should examine patient confidence in how to properly administer their DM medications prior to surgery. It is vital that patients receive clear instructions in accordance with the ADA SOC on whether to continue, hold, or adjust the dose of their medications to prevent fluctuations in blood glucose levels in the perioperative period, ensure safety with anesthesia, and prevent postoperative complications such as acute kidney injury. Of note, compliance with guideline recommendations for medication instructions was not examined because the data collection time frame expanded over multiple years and the recommendations have evolved each year as new data emerge.
Preoperative DM Management
The first key takeaway from this study is to ensure patients are ready for surgery with a formal assessment (typically in the form of a clinic visit) prior to the surgery. One private sector health system published their approach to this by administering an automatic preoperative HbA1c screening for those with a DM diagnosis and all patients with a random plasma glucose ≥ 200 mg/dL.22 Additionally, if the patient's HbA1c level was not at goal prior to surgery (≥ 8% for those with known DM and ≥ 6.5% with no known DM), patients were referred to endocrinology for further management. Increasing attention to the preoperative visit and extending HbA1c testing to all patients regardless of DM status also provides an opportunity to identify individuals living with undiagnosed DM.1
Even though there was no difference in the mean preoperative blood glucose level based on receipt or specificity of preoperative DM instructions, a second takeaway from this study is the importance of ensuring patients receive clear instructions on their DM medication schedule in the perioperative period. A practical first step may be updating the templates used by the primary surgery teams and providing education to the clinicians in the clinic on how to personalize the visits. Because the current preoperative DM process at VHI is managed by the primary surgical team in a clinic visit, there is an opportunity to shift this responsibility to other health care professionals, such as pharmacists—a change shown to reduce unintended omission of home medications following surgery during hospitalization and reduce costs.23,24
Limitations
This study relied on data included in the patient chart. These data include medication interventions made immediately prior to surgery, which can sometimes be inaccurately charted or difficult to find as they are not documented in the typical medication administration record. Also, the safety outcomes were collected from a discharge summary written by different clinicians, which may lead to information bias. Special attention was taken to ensure these data points were collected as accurately as possible, but it is possible some data may be inaccurate from unintentional human error. Additionally, the safety outcome was limited to a 30-day follow-up, but encompassed the entire length of postoperative stay for all included patients. Finally, given this study was retrospective with no comparison group and the intent was to improve processes at VHI, only hypotheses and potential interventions can be generated from this study. Future prospective studies with larger sample sizes and comparator groups are needed to draw further conclusions.
Conclusions
This study found that the current presurgery process at VHI appears to be successful in preventing surgical delays or cancellations due to hyperglycemia or hypoglycemia. Optimizing DM management can improve surgical outcomes by decreasing rates of postoperative complications, and this study added additional evidence in support of that in a unique population: veterans. Insight on the awareness of preoperative blood glucose management should be gleaned from this study, and based on this sample and site, the preadmission screening process and instructions provided to patients can serve as 2 starting points for optimizing elective surgery.
- Centers for Disease Control and Prevention. Diabetes basics. May 15, 2024. Accessed September 24, 2025. https://www.cdc.gov/diabetes/about/index.html
- Liu Y, Sayam S, Shao X, et al. Prevalence of and trends in diabetes among veterans, United States, 2005-2014. Prev Chronic Dis. 2017;14:E135. doi:10.5888/pcd14.170230
- Farmaki P, Damaskos C, Garmpis N, et al . Complications of the Type 2 Diabetes Mellitus. Curr Cardiol Rev. 2020;16(4):249-251. doi:10.2174/1573403X1604201229115531
- Frisch A, Chandra P, Smiley D, et al. Prevalence and clinical outcome of hyperglycemia in the perioperative period in noncardiac surgery. Diabetes Care. 2010;33:1783-1788. doi:10.2337/dc10-0304
- Noordzij PG, Boersma E, Schreiner F, et al. Increased preoperative glucose levels are associated with perioperative mortality in patients undergoing noncardiac, nonvascular surgery. Eur J Endocrinol. 2007;156:137 -142. doi:10.1530/eje.1.02321
- Pomposelli JJ, Baxter JK 3rd, Babineau TJ, et al. Early postoperative glucose control predicts nosocomial infection rate in diabetic patients. JPEN J Parenter Enteral Nutr. 1998;22:77-81. doi:10.1177/01486071980220027
- Umpierrez GE, Smiley D, Jacobs S, et al. Randomized study of basal-bolus insulin therapy in the inpatient management of patients with type 2 diabetes undergoing general surgery (RABBIT 2 surgery). Diabetes Care. 2011;34:256-261. doi:10.2337/dc10-1407
- Pasquel FJ, Gomez-Huelgas R, Anzola I, et al. Predictive value of admission hemoglobin A1c on inpatient glycemic control and response to insulin therapy in medicine and surgery patients with type 2 diabetes. Diabetes Care. 2015;38:e202-e203. doi:10.2337/dc15-1835
- Alexiewicz JM, Kumar D, Smogorzewski M, et al. Polymorphonuclear leukocytes in non-insulin-dependent diabetes mellitus: abnormalities in metabolism and function. Ann Intern Med. 1995;123:919-924. doi:10.7326/0003-4819-123-12-199512150-00004
- American Diabetes Association Professional Practice Committee. 16. Diabetes care in the hospital: Standards of Medical Care in Diabetes—2025. Diabetes Care. 2025;48(1 suppl 1):S321-S334. doi:10.2337/dc25-S016
- Kumar R, Gandhi R. Reasons for cancellation of operation on the day of intended surgery in a multidisciplinary 500 bedded hospital. J Anaesthesiol Clin Pharmacol. 2012;28:66-69. doi:10.4103/0970-9185.92442
- American Diabetes Association. 14. Diabetes care in the hospital: Standards of Medical Care in Diabetes— 2018. Diabetes Care. 2018;41(1 suppl 1):S144- S151. doi:10.2337/dc18-S014
- American Diabetes Association. 15. Diabetes care in the hospital: Standards of Medical Care in Diabetes— 2019. Diabetes Care. 2019;42(suppl 1):S173- S181. doi:10.2337/dc19-S015
- American Diabetes Association. 15. Diabetes care in the hospital: Standards of Medical Care in Diabetes— 2020. Diabetes Care. 2020;43(suppl 1):S193- S202. doi:10.2337/dc20-S015
- American Diabetes Association. 15. Diabetes care in the hospital: Standards of Medical Care in Diabetes— 2021. Diabetes Care. 2021;44(suppl 1):S211- S220. doi:10.2337/dc21-S015
- American Diabetes Association Professional Practice Committee. 16. Diabetes care in the hospital: Standards of Medical Care in Diabetes—2022. Diabetes Care. 2022;45(suppl 1):S244-S253. doi:10.2337/dc22-S016
- ElSayed NA, Aleppo G, Aroda VR, et al. 16. Diabetes care in the hospital: Standards of Care in Diabetes—2023. Diabetes Care. 2023;46(suppl 1):S267-S278. doi:10.2337/dc23-S016
- American Diabetes Association Professional Practice Committee. 16. Diabetes care in the hospital: Standards of Care in Diabetes—2024. Diabetes Care. 2024;47(suppl 1):S295-S306. doi:10.2337/dc24-S016
- Kidney Disease: Improving Global Outcomes (KDIGO) Acute Kidney Injury Work Group. KDIGO Clinical Practice Guideline for Acute Kidney Injury. Kidney Int Suppl. 2012;2:1-138. Accessed September 24, 2025. https:// www.kisupplements.org/issue/S2157-1716(12)X7200-9
- US Department of Veterans Affairs. VA Indiana Healthcare: about us. Accessed September 24, 2025. https:// www.va.gov/indiana-health-care/about-us/
- Koh WX, Phelan R, Hopman WM, et al. Cancellation of elective surgery: rates, reasons and effect on patient satisfaction. Can J Surg. 2021;64:E155-E161. doi:10.1503/cjs.008119
- Pai S-L, Haehn DA, Pitruzzello NE, et al. Reducing infection rates with enhanced preoperative diabetes mellitus diagnosis and optimization processes. South Med J. 2023;116:215-219. doi:10.14423/SMJ.0000000000001507
- Forrester TG, Sullivan S, Snoswell CL, et al. Integrating a pharmacist into the perioperative setting. Aust Health Rev. 2020;44:563-568. doi:10.1071/AH19126
- Hale AR, Coombes ID, Stokes J, et al. Perioperative medication management: expanding the role of the preadmission clinic pharmacist in a single centre, randomised controlled trial of collaborative prescribing. BMJ Open. 2013;3:e003027. doi:10.1136/bmjopen-2013-003027
Preoperative Diabetes Management for Patients Undergoing Elective Surgeries at a Veterans Affairs Medical Center
Preoperative Diabetes Management for Patients Undergoing Elective Surgeries at a Veterans Affairs Medical Center