User login
Improving Hospital Metrics Through the Implementation of a Comorbidity Capture Tool and Other Quality Initiatives
From the University of Miami Miller School of Medicine (Drs. Sosa, Ferreira, Gershengorn, Soto, Parekh, and Suarez), and the Quality Department of the University of Miami Hospital and Clinics (Estin Kelly, Ameena Shrestha, Julianne Burgos, and Sandeep Devabhaktuni), Miami, FL.
Abstract
Background: Case mix index (CMI) and expected mortality are determined based on comorbidities. Improving documentation and coding can impact performance indicators. During and prior to 2018, our patient acuity was under-represented, with low expected mortality and CMI. Those metrics motivated our quality team to develop the quality initiatives reported here.
Objectives: We sought to assess the impact of quality initiatives on number of comorbidities, diagnoses, CMI, and expected mortality at the University of Miami Health System.
Design: We conducted an observational study of a series of quality initiatives: (1) education of clinical documentation specialists (CDS) to capture comorbidities (10/2019); (2) facilitating the process for physician query response (2/2020); (3) implementation of computer logic to capture electrolyte disturbances and renal dysfunction (8/2020); (4) development of a tool to capture Elixhauser comorbidities (11/2020); and (5) provider education and electronic health record reviews by the quality team.
Setting and participants: All admissions during 2019 and 2020 at University of Miami Health System. The health system includes 2 academic inpatient facilities, a 560-bed tertiary hospital, and a 40-bed cancer facility. Our hospital is 1 of the 11 PPS-Exempt Cancer Hospitals and is the South Florida’s only NCI-Designated Cancer Center.
Conclusion:
Keywords: PS/QI, coding, case mix index, comorbidities, mortality.
Adoption of comprehensive electronic health record (EHR) systems by US hospitals, defined as an EHR capable of meeting all core meaningful-use metrics including evaluation and tracking of quality metrics, has been steadily increasing.3,4 Many institutions have looked to EHR system transitions as an inflection point to expand clinical documentation improvement (CDI) efforts. Over the past several years, our institution, an academic medical center, has endeavored to fully transition to a comprehensive EHR system (Epic from Epic Systems Corporation). Part of the purpose of this transition was to help study and improve outcomes, reduce readmissions, improve quality of care, and meet performance indicators.
Prior to 2019, our hospital’s patient acuity was low, with a CMI consistently below 2, ranging from 1.81 to 1.99, and an expected mortality consistently below 1.9%, ranging from 1.65% to 1.85%. Our concern that these values underestimated the real severity of illness of our patient population prompted the development of a quality improvement plan. In this report, we describe the processes we undertook to improve documentation and coding of comorbid illness, and report on the impact of these initiatives on performance indicators. We hypothesized that our initiatives would have a significant impact on our ability to capture patient complexity, and thus impact our CMI and expected mortality.
Methods
In the fall of 2019, we embarked on a multifaceted quality improvement project aimed at improving comorbidity capture for patients hospitalized at our institution. The health system includes 2 academic inpatient facilities, a 560-bed tertiary hospital and a 40-bed cancer facility. Since September 2017, we have used Epic as our EHR. In August 2019, we started working with Vizient Clinical Data Base5 to allow benchmarking with peer institutions. We assessed the impact of this initiative with a pre/post study design.
Quality Initiatives
This quality improvement project consisted of a series of 5 targeted interventions coupled with continuous monitoring and education.
1. Comorbidity coding. In October 2019, we met with the clinical documentation specialists (CDS) and the coding team to educate them on the value of coding all comorbidities that have an impact on
2. Physician query. In October 2019, we modified the process for physician query response, allowing physicians to answer queries in the EHR through a reply tool incorporated into the query and accept answers in the body of the Epic message as an active part of the EHR.
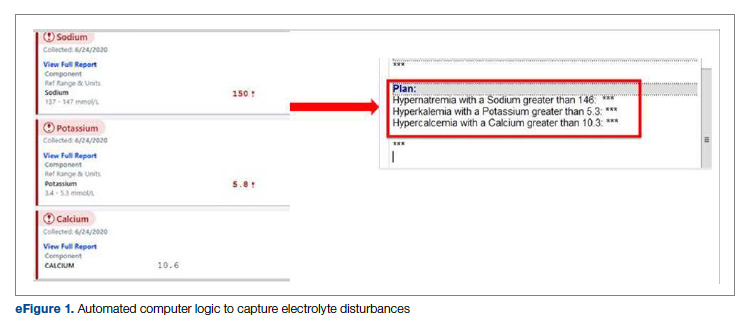
3. EHR logic. In August 2020, we developed an EHR smart logic to automatically capture fluid and electrolyte disturbances and renal dysfunction, based on the most recent laboratory values. The logic automatically populated potentially appropriate diagnoses in the assessment and plan of provider notes, which require provider acknowledgment and which providers are able to modify
4. Comorbidity capture tool. In November 2020, we developed a standardized tool to allow providers to easily capture Elixhauser comorbidities (eFigure 2). The Elixhauser index is a method for measuring comorbidities based on International Classification of Diseases, Ninth Revision, Clinical Modification and International Classification of Disease, Tenth Revision diagnosis codes found in administrative data1-6 and is used by US News & World Report and Vizient to assess comorbidity burden. Our tool automatically captures diagnoses recorded in previous documentation and allows providers to easily provide the management plan for each; this information is automatically pulled into the provider note.
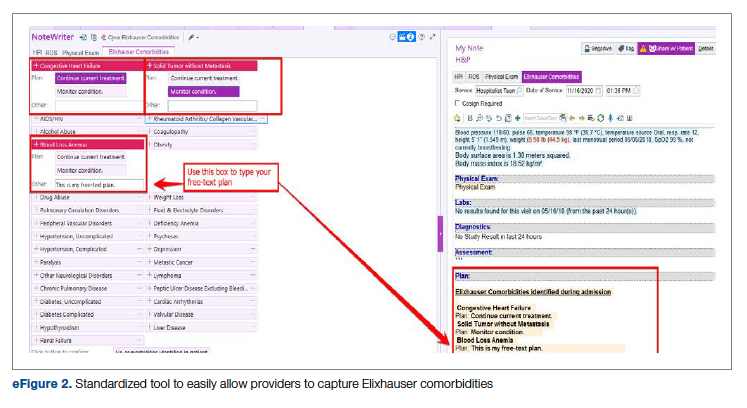
The development of this tool used an existing functionality within the Epic EHR called SmartForms, SmartData Elements, and SmartLinks. The only cost of tool development was the time invested—124 hours inclusive of 4 hours of staff education. Specifically, a panel of experts (including physicians of different specialties, an analyst, and representatives from the quality office) met weekly for 30 minutes per week over 5 weeks to agree on specific clinical criteria and guide the EHR build analyst. Individual panel members confirmed and validated design requirements (in 15 hours over 5 weeks). Our senior clinical analyst II dedicated 80 hours to actual build time, 15 hours to design time, and 25 hours to tailor the function to our institution’s workflow. This tool was introduced in November 2020; completion was optional at the time of hospital admission but mandatory at discharge to ensure compliance.
5. Quality team
Assessment of Quality Initiatives’ Impact
Data on the number of comorbidities and performance indicators were obtained retrospectively. The data included all hospital admissions from 2019 and 2020 divided into 2 periods: pre-intervention from January 1, 2019 through September 30, 2019, and intervention from October 1, 2019 through December 31, 2020. The primary outcome of this observational study was the rate of comorbidity capture during the intervention period. Comorbidity capture was assessed using the Vizient Clinical Data Base (CDB) health care performance tool.5 Vizient CDB uses the Agency for Healthcare Research and Quality Elixhauser index, which includes 29 of the initial 31 comorbidities described by Elixhauser,6 as it combines hypertension with and without complications into one. We secondarily aimed to examine the impact of the quality improvement initiatives on several institutional-level performance indicators, including total number of diagnoses, comorbidities or complications (CC), major comorbidities or complications (MCC), CMI, and expected mortality.
Case mix index is the average Medicare Severity-DRG (MS-DRG) weighted across all hospital discharges (appropriate to their discharge date). The expected mortality represents the average expected number of deaths based on diagnosed conditions, age, and gender within the same time frame, and it is based on coded diagnosis; we obtained the mortality index by dividing the observed mortality by the expected mortality. The Vizient CDB Mortality Risk Adjustment Model was used to assign an expected mortality (0%-100%) to each case based on factors such as demographics, admission type, diagnoses, and procedures.
Standard statistics were used to measure the outcomes. We used Excel to compare pre-intervention and intervention period characteristics and outcomes, using t-testing for continuous variables and Chi-square testing for categorial outcomes. P values <0.05 were considered statistically significant.
The study was reviewed by the institutional review board (IRB) of our institution (IRB ID: 20210070). The IRB determined that the proposed activity was not research involving human subjects, as defined by the Department of Health and Human Services and US Food and Drug Administration regulations, and that IRB review and approval by the organization were not required.
Results
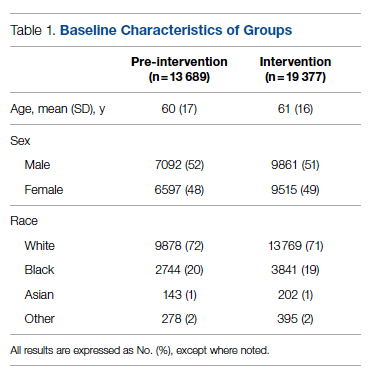
The health system had a total of 33 066 admissions during the study period—13 689 pre-intervention (January 1, 2019 through September 30, 2019) and 19,377 during the intervention period (October 1, 2019 to December 31, 2020). Demographics were similar among the pre-intervention and intervention periods: mean age was 60 years and 61 years, 52% and 51% of patients were male, 72% and 71% were White, and 20% and 19% were Black, respectively (Table 1).
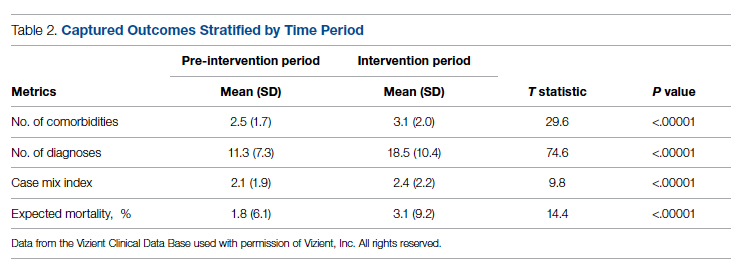
The multifaceted intervention resulted in a significant improvement in the primary outcome: mean comorbidity capture increased from 2.5 (SD, 1.7) before the intervention to 3.1 (SD, 2.0) during the intervention (P < .00001). Secondary outcomes also improved. The mean number of secondary diagnoses for admissions increased from 11.3 (SD, 7.3) prior to the intervention to 18.5 (SD, 10.4) (P < .00001) during the intervention period. The mean CMI increased from 2.1 (SD, 1.9) to 2.4 (SD, 2.2) post intervention (P < .00001), an increase during the intervention period of 14%. The expected mortality increased from 1.8% (SD, 6.1%) to 3.1% (SD, 9.2%) after the intervention (P < .00001) (Table 2).
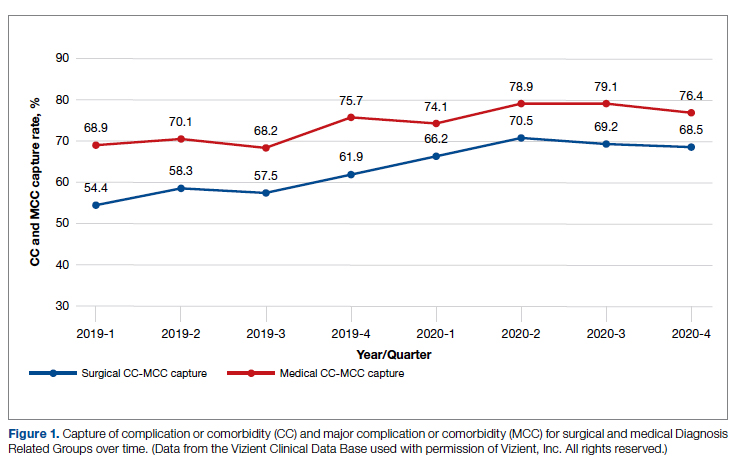
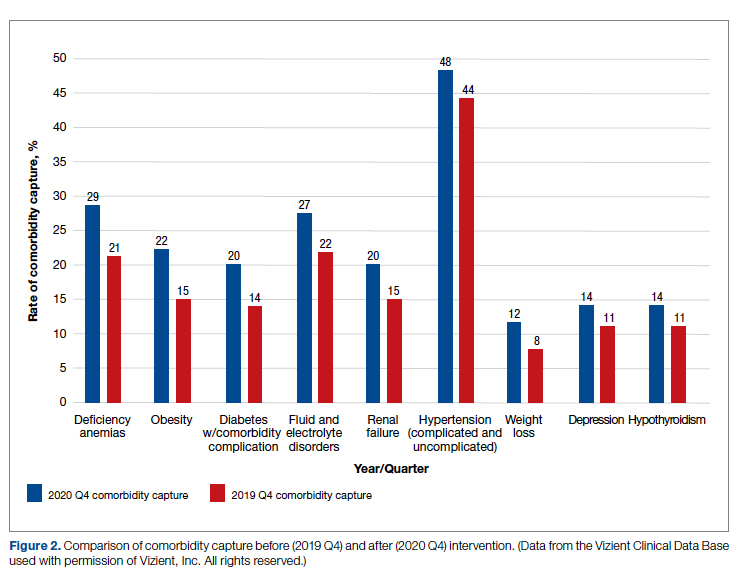
There was an overall observed improvement in percentage of discharges with documented CC and MCC for both surgical and medical specialties. Both CC and MCC increased for surgical specialties, from 54.4% to 68.5%, and for medical specialties, from 68.9% to 76.4%. (Figure 1). The diagnoses that were captured more consistently included deficiency anemia, obesity, diabetes with complications, fluid and electrolyte disorders and renal failure, hypertension, weight loss, depression, and hypothyroidism (Figure 2).
During the 9-month pre-intervention period (January 1 through September 30, 2019), there were 2795 queries, with an agreed volume of 1823; the agreement rate was 65% and the average provider turnaround time was 12.53 days. In the 15-month postintervention period, there were 10 216 queries, with an agreed volume of 6802 at 66%. We created a policy to encourage responses no later than 10 days after the query, and our average turnaround time decreased by more than 50% to 5.86 days. The average number of monthly queries increased by 55%, from an average of 311 monthly queries in the pre-intervention period to an average of 681 per month in the postintervention period. The more common queries that had an impact on CMI included sepsis, antineoplastic chemotherapy–induced pancytopenia, acute posthemorrhagic anemia, malnutrition, hyponatremia, and metabolic encephalopathy.
Discussion
The need for accurate documentation by physicians has been recognized for many years.7
With the growing complexity of the documentation and coding process, it is difficult for clinicians to keep up with the terminology required by the Centers for Medicare and Medicaid Services (CMS). Several different methods to improve documentation have been proposed. Prior interventions to standardize documentation templates in the trauma service have shown improvement in CMI.8 An educational program on coding for internal medicine that included a lecture series and creation of a laminated pocket card listing common CMS diagnoses, CC, and MCC has been implemented, with an improvement in the capture rate of CC and MCC from 42% to 48% and an impact on expected mortality.9 This program resulted in a 30% decrease in the median quarterly mortality index and an increase in CMI from 1.27 to 1.36.
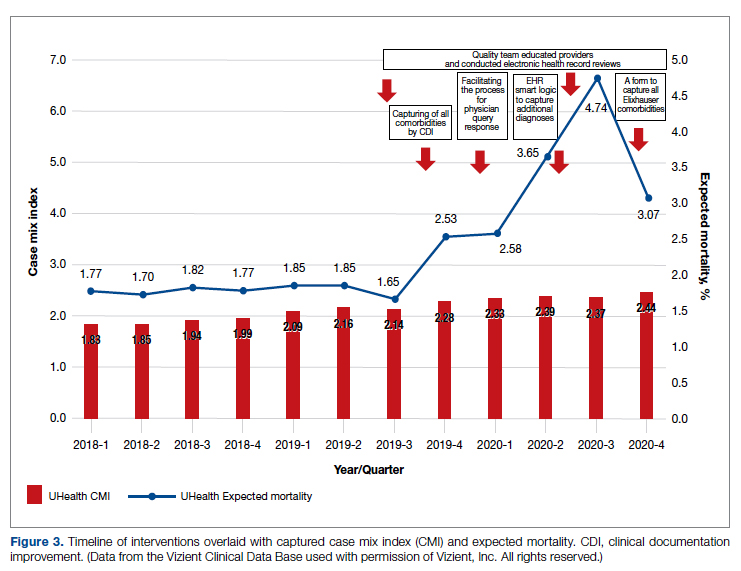
Our results show that there was an increase in comorbidities documentation of admitted patients after all interventions were implemented, more accurately reflecting the complexity of our patient population in a tertiary care academic medical center. Our CMI increased by 14% during the intervention period. The estimated CMI dollar impact increased by 75% from the pre-intervention period (adjusted for PPS-exempt hospital). The hospital-expected mortality increased from 1.77 to 3.07 (peak at 4.74 during third quarter of 2020) during the implementation period, which is a key driver of quality rankings for national outcomes reporting services such as US News & World Report.
There was increased physician satisfaction as a result of the change of functionality of the query response system, and no additional monetary provider incentive for complete documentation was allocated, apart from education and 1:1 support that improved physician engagement. Our next steps include the implementation of an advanced program to concurrently and automatically capture and nudge providers to respond and complete their documentation in real time.
Limitations
The limitations of our study include those inherent to a retrospective review and are associative and observational in nature. Although we used expected mortality and CMI as a surrogate for patient acuity for comparison, there was no way to control for actual changes in patient acuity that contributed to the increase in CMI, although we believe that the population we served and the services provided and their structure did not change significantly during the intervention period. Additionally, the observed increase in CMI during the implementation period may be a result of described variabilities in CMI and would be better studied over a longer period. Also, during the year of our interventions, 2020, we were affected by the COVID-19 pandemic. Patients with COVID-19 are known to carry a lower-than-expected mortality, and that could have had a negative impact on our results. In fact, we did observe a decrease in our expected mortality during the last quarter of 2020, which correlated with one of our regional peaks for COVID-19, and that could be a confounding factor. While the described intervention process is potentially applicable to multiple EHR systems, the exact form to capture the Elixhauser comorbidities was built into the Epic EHR, limiting external applicability of this tool to other EHR software.
Conclusion
A continuous comprehensive series of interventions substantially increased our patient acuity scores. The increased scores have implications for reimbursement and quality comparisons for hospitals and physicians. Our institution can now be stratified more accurately with our peers and other hospitals. Accurate medical record documentation has become increasingly important, but also increasingly complex. Leveraging the EHR through quality initiatives that facilitate the workflow for providers can have an impact on documentation, coding, and ultimately risk-adjusted outcomes data that influence institutional reputation.
Corresponding author: Marie Anne Sosa, MD; 1120 NW 14th St., Suite 809, Miami, FL, 33134; mxs2157@med.miami.edu
Disclosures: None reported.
doi:10.12788/jcom.0088
1. Elixhauser A, Steiner C, Harris DR, Coffey RM. Comorbidity measures for use with administrative data. Med Care. 1998;36(1):8-27. doi:10.1097/00005650-199801000-00004.
2. Sehgal AR. The role of reputation in U.S. News & World Report’s rankings of the top 50 American hospitals. Ann Intern Med. 2010;152(8):521-525. doi:10.7326/0003-4819-152-8-201004200-00009
3. Jha AK, DesRoches CM, Campbell EG, et al. Use of electronic health records in U.S. hospitals. N Engl J Med. 2009;360(16):1628-1638. doi:10.1056/NEJMsa0900592.
4. Adler-Milstein J, DesRoches CM, Kralovec, et al. Electronic health record adoption in US hospitals: progress continues, but challenges persist. Health Aff (Millwood). 2015;34(12):2174-2180. doi:10.1377/hlthaff.2015.0992
5. Vizient Clinical Data Base/Resource ManagerTM. Irving, TX: Vizient, Inc.; 2019. Accessed March 10, 2022. https://www.vizientinc.com
6. Moore BJ, White S, Washington R, Coenen N, Elixhauser A. Identifying increased risk of readmission and in-hospital mortality using hospital administrative data: the AHRQ Elixhauser Comorbidity Index. Med Care. 2017;55(7):698-705. doi:10.1097/MLR.0000000000000735
7. Payne T. Improving clinical documentation in an EMR world. Healthc Financ Manage. 2010;64(2):70-74.
8. Barnes SL, Waterman M, Macintyre D, Coughenour J, Kessel J. Impact of standardized trauma documentation to the hospital’s bottom line. Surgery. 2010;148(4):793-797. doi:10.1016/j.surg.2010.07.040
9. Spellberg B, Harrington D, Black S, Sue D, Stringer W, Witt M. Capturing the diagnosis: an internal medicine education program to improve documentation. Am J Med. 2013;126(8):739-743.e1. doi:10.1016/j.amjmed.2012.11.035
From the University of Miami Miller School of Medicine (Drs. Sosa, Ferreira, Gershengorn, Soto, Parekh, and Suarez), and the Quality Department of the University of Miami Hospital and Clinics (Estin Kelly, Ameena Shrestha, Julianne Burgos, and Sandeep Devabhaktuni), Miami, FL.
Abstract
Background: Case mix index (CMI) and expected mortality are determined based on comorbidities. Improving documentation and coding can impact performance indicators. During and prior to 2018, our patient acuity was under-represented, with low expected mortality and CMI. Those metrics motivated our quality team to develop the quality initiatives reported here.
Objectives: We sought to assess the impact of quality initiatives on number of comorbidities, diagnoses, CMI, and expected mortality at the University of Miami Health System.
Design: We conducted an observational study of a series of quality initiatives: (1) education of clinical documentation specialists (CDS) to capture comorbidities (10/2019); (2) facilitating the process for physician query response (2/2020); (3) implementation of computer logic to capture electrolyte disturbances and renal dysfunction (8/2020); (4) development of a tool to capture Elixhauser comorbidities (11/2020); and (5) provider education and electronic health record reviews by the quality team.
Setting and participants: All admissions during 2019 and 2020 at University of Miami Health System. The health system includes 2 academic inpatient facilities, a 560-bed tertiary hospital, and a 40-bed cancer facility. Our hospital is 1 of the 11 PPS-Exempt Cancer Hospitals and is the South Florida’s only NCI-Designated Cancer Center.
Conclusion:
Keywords: PS/QI, coding, case mix index, comorbidities, mortality.
Adoption of comprehensive electronic health record (EHR) systems by US hospitals, defined as an EHR capable of meeting all core meaningful-use metrics including evaluation and tracking of quality metrics, has been steadily increasing.3,4 Many institutions have looked to EHR system transitions as an inflection point to expand clinical documentation improvement (CDI) efforts. Over the past several years, our institution, an academic medical center, has endeavored to fully transition to a comprehensive EHR system (Epic from Epic Systems Corporation). Part of the purpose of this transition was to help study and improve outcomes, reduce readmissions, improve quality of care, and meet performance indicators.
Prior to 2019, our hospital’s patient acuity was low, with a CMI consistently below 2, ranging from 1.81 to 1.99, and an expected mortality consistently below 1.9%, ranging from 1.65% to 1.85%. Our concern that these values underestimated the real severity of illness of our patient population prompted the development of a quality improvement plan. In this report, we describe the processes we undertook to improve documentation and coding of comorbid illness, and report on the impact of these initiatives on performance indicators. We hypothesized that our initiatives would have a significant impact on our ability to capture patient complexity, and thus impact our CMI and expected mortality.
Methods
In the fall of 2019, we embarked on a multifaceted quality improvement project aimed at improving comorbidity capture for patients hospitalized at our institution. The health system includes 2 academic inpatient facilities, a 560-bed tertiary hospital and a 40-bed cancer facility. Since September 2017, we have used Epic as our EHR. In August 2019, we started working with Vizient Clinical Data Base5 to allow benchmarking with peer institutions. We assessed the impact of this initiative with a pre/post study design.
Quality Initiatives
This quality improvement project consisted of a series of 5 targeted interventions coupled with continuous monitoring and education.
1. Comorbidity coding. In October 2019, we met with the clinical documentation specialists (CDS) and the coding team to educate them on the value of coding all comorbidities that have an impact on
2. Physician query. In October 2019, we modified the process for physician query response, allowing physicians to answer queries in the EHR through a reply tool incorporated into the query and accept answers in the body of the Epic message as an active part of the EHR.
3. EHR logic. In August 2020, we developed an EHR smart logic to automatically capture fluid and electrolyte disturbances and renal dysfunction, based on the most recent laboratory values. The logic automatically populated potentially appropriate diagnoses in the assessment and plan of provider notes, which require provider acknowledgment and which providers are able to modify
4. Comorbidity capture tool. In November 2020, we developed a standardized tool to allow providers to easily capture Elixhauser comorbidities (eFigure 2). The Elixhauser index is a method for measuring comorbidities based on International Classification of Diseases, Ninth Revision, Clinical Modification and International Classification of Disease, Tenth Revision diagnosis codes found in administrative data1-6 and is used by US News & World Report and Vizient to assess comorbidity burden. Our tool automatically captures diagnoses recorded in previous documentation and allows providers to easily provide the management plan for each; this information is automatically pulled into the provider note.
The development of this tool used an existing functionality within the Epic EHR called SmartForms, SmartData Elements, and SmartLinks. The only cost of tool development was the time invested—124 hours inclusive of 4 hours of staff education. Specifically, a panel of experts (including physicians of different specialties, an analyst, and representatives from the quality office) met weekly for 30 minutes per week over 5 weeks to agree on specific clinical criteria and guide the EHR build analyst. Individual panel members confirmed and validated design requirements (in 15 hours over 5 weeks). Our senior clinical analyst II dedicated 80 hours to actual build time, 15 hours to design time, and 25 hours to tailor the function to our institution’s workflow. This tool was introduced in November 2020; completion was optional at the time of hospital admission but mandatory at discharge to ensure compliance.
5. Quality team
Assessment of Quality Initiatives’ Impact
Data on the number of comorbidities and performance indicators were obtained retrospectively. The data included all hospital admissions from 2019 and 2020 divided into 2 periods: pre-intervention from January 1, 2019 through September 30, 2019, and intervention from October 1, 2019 through December 31, 2020. The primary outcome of this observational study was the rate of comorbidity capture during the intervention period. Comorbidity capture was assessed using the Vizient Clinical Data Base (CDB) health care performance tool.5 Vizient CDB uses the Agency for Healthcare Research and Quality Elixhauser index, which includes 29 of the initial 31 comorbidities described by Elixhauser,6 as it combines hypertension with and without complications into one. We secondarily aimed to examine the impact of the quality improvement initiatives on several institutional-level performance indicators, including total number of diagnoses, comorbidities or complications (CC), major comorbidities or complications (MCC), CMI, and expected mortality.
Case mix index is the average Medicare Severity-DRG (MS-DRG) weighted across all hospital discharges (appropriate to their discharge date). The expected mortality represents the average expected number of deaths based on diagnosed conditions, age, and gender within the same time frame, and it is based on coded diagnosis; we obtained the mortality index by dividing the observed mortality by the expected mortality. The Vizient CDB Mortality Risk Adjustment Model was used to assign an expected mortality (0%-100%) to each case based on factors such as demographics, admission type, diagnoses, and procedures.
Standard statistics were used to measure the outcomes. We used Excel to compare pre-intervention and intervention period characteristics and outcomes, using t-testing for continuous variables and Chi-square testing for categorial outcomes. P values <0.05 were considered statistically significant.
The study was reviewed by the institutional review board (IRB) of our institution (IRB ID: 20210070). The IRB determined that the proposed activity was not research involving human subjects, as defined by the Department of Health and Human Services and US Food and Drug Administration regulations, and that IRB review and approval by the organization were not required.
Results
The health system had a total of 33 066 admissions during the study period—13 689 pre-intervention (January 1, 2019 through September 30, 2019) and 19,377 during the intervention period (October 1, 2019 to December 31, 2020). Demographics were similar among the pre-intervention and intervention periods: mean age was 60 years and 61 years, 52% and 51% of patients were male, 72% and 71% were White, and 20% and 19% were Black, respectively (Table 1).
The multifaceted intervention resulted in a significant improvement in the primary outcome: mean comorbidity capture increased from 2.5 (SD, 1.7) before the intervention to 3.1 (SD, 2.0) during the intervention (P < .00001). Secondary outcomes also improved. The mean number of secondary diagnoses for admissions increased from 11.3 (SD, 7.3) prior to the intervention to 18.5 (SD, 10.4) (P < .00001) during the intervention period. The mean CMI increased from 2.1 (SD, 1.9) to 2.4 (SD, 2.2) post intervention (P < .00001), an increase during the intervention period of 14%. The expected mortality increased from 1.8% (SD, 6.1%) to 3.1% (SD, 9.2%) after the intervention (P < .00001) (Table 2).
There was an overall observed improvement in percentage of discharges with documented CC and MCC for both surgical and medical specialties. Both CC and MCC increased for surgical specialties, from 54.4% to 68.5%, and for medical specialties, from 68.9% to 76.4%. (Figure 1). The diagnoses that were captured more consistently included deficiency anemia, obesity, diabetes with complications, fluid and electrolyte disorders and renal failure, hypertension, weight loss, depression, and hypothyroidism (Figure 2).
During the 9-month pre-intervention period (January 1 through September 30, 2019), there were 2795 queries, with an agreed volume of 1823; the agreement rate was 65% and the average provider turnaround time was 12.53 days. In the 15-month postintervention period, there were 10 216 queries, with an agreed volume of 6802 at 66%. We created a policy to encourage responses no later than 10 days after the query, and our average turnaround time decreased by more than 50% to 5.86 days. The average number of monthly queries increased by 55%, from an average of 311 monthly queries in the pre-intervention period to an average of 681 per month in the postintervention period. The more common queries that had an impact on CMI included sepsis, antineoplastic chemotherapy–induced pancytopenia, acute posthemorrhagic anemia, malnutrition, hyponatremia, and metabolic encephalopathy.
Discussion
The need for accurate documentation by physicians has been recognized for many years.7
With the growing complexity of the documentation and coding process, it is difficult for clinicians to keep up with the terminology required by the Centers for Medicare and Medicaid Services (CMS). Several different methods to improve documentation have been proposed. Prior interventions to standardize documentation templates in the trauma service have shown improvement in CMI.8 An educational program on coding for internal medicine that included a lecture series and creation of a laminated pocket card listing common CMS diagnoses, CC, and MCC has been implemented, with an improvement in the capture rate of CC and MCC from 42% to 48% and an impact on expected mortality.9 This program resulted in a 30% decrease in the median quarterly mortality index and an increase in CMI from 1.27 to 1.36.
Our results show that there was an increase in comorbidities documentation of admitted patients after all interventions were implemented, more accurately reflecting the complexity of our patient population in a tertiary care academic medical center. Our CMI increased by 14% during the intervention period. The estimated CMI dollar impact increased by 75% from the pre-intervention period (adjusted for PPS-exempt hospital). The hospital-expected mortality increased from 1.77 to 3.07 (peak at 4.74 during third quarter of 2020) during the implementation period, which is a key driver of quality rankings for national outcomes reporting services such as US News & World Report.
There was increased physician satisfaction as a result of the change of functionality of the query response system, and no additional monetary provider incentive for complete documentation was allocated, apart from education and 1:1 support that improved physician engagement. Our next steps include the implementation of an advanced program to concurrently and automatically capture and nudge providers to respond and complete their documentation in real time.
Limitations
The limitations of our study include those inherent to a retrospective review and are associative and observational in nature. Although we used expected mortality and CMI as a surrogate for patient acuity for comparison, there was no way to control for actual changes in patient acuity that contributed to the increase in CMI, although we believe that the population we served and the services provided and their structure did not change significantly during the intervention period. Additionally, the observed increase in CMI during the implementation period may be a result of described variabilities in CMI and would be better studied over a longer period. Also, during the year of our interventions, 2020, we were affected by the COVID-19 pandemic. Patients with COVID-19 are known to carry a lower-than-expected mortality, and that could have had a negative impact on our results. In fact, we did observe a decrease in our expected mortality during the last quarter of 2020, which correlated with one of our regional peaks for COVID-19, and that could be a confounding factor. While the described intervention process is potentially applicable to multiple EHR systems, the exact form to capture the Elixhauser comorbidities was built into the Epic EHR, limiting external applicability of this tool to other EHR software.
Conclusion
A continuous comprehensive series of interventions substantially increased our patient acuity scores. The increased scores have implications for reimbursement and quality comparisons for hospitals and physicians. Our institution can now be stratified more accurately with our peers and other hospitals. Accurate medical record documentation has become increasingly important, but also increasingly complex. Leveraging the EHR through quality initiatives that facilitate the workflow for providers can have an impact on documentation, coding, and ultimately risk-adjusted outcomes data that influence institutional reputation.
Corresponding author: Marie Anne Sosa, MD; 1120 NW 14th St., Suite 809, Miami, FL, 33134; mxs2157@med.miami.edu
Disclosures: None reported.
doi:10.12788/jcom.0088
1. Elixhauser A, Steiner C, Harris DR, Coffey RM. Comorbidity measures for use with administrative data. Med Care. 1998;36(1):8-27. doi:10.1097/00005650-199801000-00004.
2. Sehgal AR. The role of reputation in U.S. News & World Report’s rankings of the top 50 American hospitals. Ann Intern Med. 2010;152(8):521-525. doi:10.7326/0003-4819-152-8-201004200-00009
3. Jha AK, DesRoches CM, Campbell EG, et al. Use of electronic health records in U.S. hospitals. N Engl J Med. 2009;360(16):1628-1638. doi:10.1056/NEJMsa0900592.
4. Adler-Milstein J, DesRoches CM, Kralovec, et al. Electronic health record adoption in US hospitals: progress continues, but challenges persist. Health Aff (Millwood). 2015;34(12):2174-2180. doi:10.1377/hlthaff.2015.0992
5. Vizient Clinical Data Base/Resource ManagerTM. Irving, TX: Vizient, Inc.; 2019. Accessed March 10, 2022. https://www.vizientinc.com
6. Moore BJ, White S, Washington R, Coenen N, Elixhauser A. Identifying increased risk of readmission and in-hospital mortality using hospital administrative data: the AHRQ Elixhauser Comorbidity Index. Med Care. 2017;55(7):698-705. doi:10.1097/MLR.0000000000000735
7. Payne T. Improving clinical documentation in an EMR world. Healthc Financ Manage. 2010;64(2):70-74.
8. Barnes SL, Waterman M, Macintyre D, Coughenour J, Kessel J. Impact of standardized trauma documentation to the hospital’s bottom line. Surgery. 2010;148(4):793-797. doi:10.1016/j.surg.2010.07.040
9. Spellberg B, Harrington D, Black S, Sue D, Stringer W, Witt M. Capturing the diagnosis: an internal medicine education program to improve documentation. Am J Med. 2013;126(8):739-743.e1. doi:10.1016/j.amjmed.2012.11.035
A Practical and Cost-Effective Approach to the Diagnosis of Heparin-Induced Thrombocytopenia: A Single-Center Quality Improvement Study
From the Veterans Affairs Ann Arbor Healthcare System Medicine Service (Dr. Cusick), University of Michigan College of Pharmacy, Clinical Pharmacy Service, Michigan Medicine (Dr. Hanigan), Department of Internal Medicine Clinical Experience and Quality, Michigan Medicine (Linda Bashaw), Department of Internal Medicine, University of Michigan Medical School, Ann Arbor, MI (Dr. Heidemann), and the Operational Excellence Department, Sparrow Health System, Lansing, MI (Matthew Johnson).
Abstract
Background: Diagnosis of heparin-induced thrombocytopenia (HIT) requires completion of an enzyme-linked immunosorbent assay (ELISA)–based heparin-platelet factor 4 (PF4) antibody test. If this test is negative, HIT is excluded. If positive, a serotonin-release assay (SRA) test is indicated. The SRA is expensive and sometimes inappropriately ordered despite negative PF4 results, leading to unnecessary treatment with argatroban while awaiting SRA results.
Objectives: The primary objectives of this project were to reduce unnecessary SRA testing and argatroban utilization in patients with suspected HIT.
Methods: The authors implemented an intervention at a tertiary care academic hospital in November 2017 targeting patients hospitalized with suspected HIT. The intervention was controlled at the level of the laboratory and prevented ordering of SRA tests in the absence of a positive PF4 test. The number of SRA tests performed and argatroban bags administered were identified retrospectively via chart review before the intervention (January 2016 to November 2017) and post intervention (December 2017 to March 2020). Associated costs were calculated based on institutional SRA testing cost as well as the average wholesale price of argatroban.
Results: SRA testing decreased from an average of 3.7 SRA results per 1000 admissions before the intervention to an average of 0.6 results per 1000 admissions post intervention. The number of 50-mL argatroban bags used per 1000 admissions decreased from 18.8 prior to the intervention to 14.3 post intervention. Total estimated cost savings per 1000 admissions was $2361.20.
Conclusion: An evidence-based testing strategy for HIT can be effectively implemented at the level of the laboratory. This approach led to reductions in SRA testing and argatroban utilization with resultant cost savings.
Keywords: HIT, argatroban, anticoagulation, serotonin-release assay.
Thrombocytopenia is a common finding in hospitalized patients.1,2 Heparin-induced thrombocytopenia (HIT) is one of the many potential causes of thrombocytopenia in hospitalized patients and occurs when antibodies to the heparin-platelet factor 4 (PF4) complex develop after heparin exposure. This triggers a cascade of events, leading to platelet activation, platelet consumption, and thrombosis. While HIT is relatively rare, occurring in 0.3% to 0.5% of critically ill patients, many patients will be tested to rule out this potentially life-threatening cause of thrombocytopenia.3
The diagnosis of HIT utilizes a combination of both clinical suspicion and laboratory testing.4 The 4T score (Table) was developed to evaluate the clinical probability of HIT and involves assessing the degree and timing of thrombocytopenia, the presence or absence of thrombosis, and other potential causes of the thrombocytopenia.5 The 4T score is designed to be utilized to identify patients who require laboratory testing for HIT; however, it has low inter-rater agreement in patients undergoing evaluation for HIT,6 and, in our experience, completion of this scoring is time-consuming.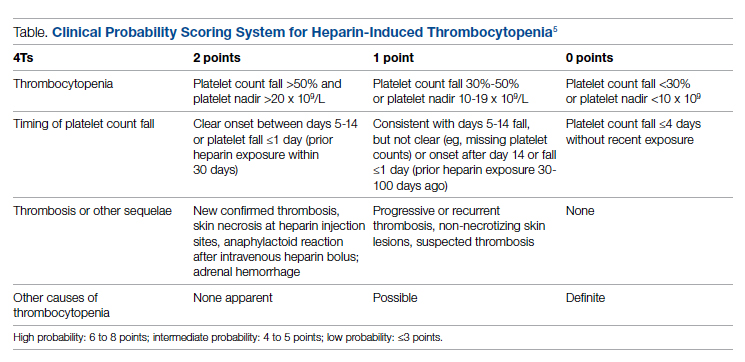
The enzyme-linked immunosorbent assay (ELISA) is a commonly used laboratory test to diagnose HIT that detects antibodies to the heparin-PF4 complex utilizing optical density (OD) units. When using an OD cutoff of 0.400, ELISA PF4 (PF4) tests have a sensitivity of 99.6%, but poor specificity at 69.3%.7 When the PF4 antibody test is positive with an OD ≥0.400, then a functional test is used to determine whether the antibodies detected will activate platelets. The serotonin-release assay (SRA) is a functional test that measures 14C-labeled serotonin release from donor platelets when mixed with patient serum or plasma containing HIT antibodies. In the correct clinical context, a positive ELISA PF4 antibody test along with a positive SRA is diagnostic of HIT.8
The process of diagnosing HIT in a timely and cost-effective manner is dependent on the clinician’s experience in diagnosing HIT as well as access to the laboratory testing necessary to confirm the diagnosis. PF4 antibody tests are time-consuming and not always available daily and/or are not available onsite. The SRA requires access to donor platelets and specialized radioactivity counting equipment, making it available only at particular centers.
The treatment of HIT is more straightforward and involves stopping all heparin products and starting a nonheparin anticoagulant. The direct thrombin inhibitor argatroban is one of the standard nonheparin anticoagulants used in patients with suspected HIT.4 While it is expensive, its short half-life and lack of renal clearance make it ideal for treatment of hospitalized patients with suspected HIT, many of whom need frequent procedures and/or have renal disease.
At our academic tertiary care center, we performed a retrospective analysis that showed inappropriate ordering of diagnostic HIT testing as well as unnecessary use of argatroban even when there was low suspicion for HIT based on laboratory findings. The aim of our project was to reduce unnecessary HIT testing and argatroban utilization without overburdening providers or interfering with established workflows.
Methods
Setting
The University of Michigan (UM) hospital is a 1000-bed tertiary care center in Ann Arbor, Michigan. The UM guidelines reflect evidence-based guidelines for the diagnosis and treatment of HIT.4 In 2016 the UM guidelines for laboratory testing included sending the PF4 antibody test first when there was clinical suspicion of HIT. The SRA was to be sent separately only when the PF4 returned positive (OD ≥ 0.400). Standard guidelines at UM also included switching patients with suspected HIT from heparin to a nonheparin anticoagulant and stopping all heparin products while awaiting the SRA results. The direct thrombin inhibitor argatroban is utilized at UM and monitored with anti-IIa levels. University of Michigan Hospital utilizes the Immucor PF4 IgG ELISA for detecting heparin-associated antibodies.9 In 2016, this PF4 test was performed in the UM onsite laboratory Monday through Friday. At UM the SRA is performed off site, with a turnaround time of 3 to 5 business days.
Baseline Data
We retrospectively reviewed PF4 and SRA testing as well as argatroban usage from December 2016 to May 2017. Despite the institutional guidelines, providers were sending PF4 and SRA simultaneously as soon as HIT was suspected; 62% of PF4 tests were ordered simultaneously with the SRA, but only 8% of these PF4 tests were positive with an OD ≥0.400. Of those patients with negative PF4 testing, argatroban was continued until the SRA returned negative, leading to many days of unnecessary argatroban usage. An informal survey of the anticoagulation pharmacists revealed that many recommended discontinuing argatroban when the PF4 test was negative, but providers routinely did not feel comfortable with this approach. This suggested many providers misunderstood the performance characteristics of the PF4 test.
Intervention
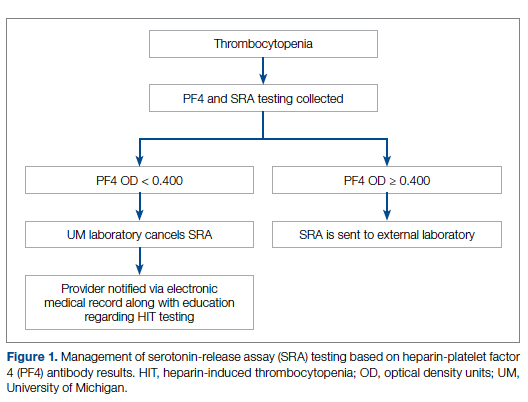
Our team consisted of hematology and internal medicine faculty, pharmacists, coagulation laboratory personnel, and quality improvement specialists. We designed and implemented an intervention in November 2017 focused on controlling the ordering of the SRA test. We chose to focus on this step due to the excellent sensitivity of the PF4 test with a cutoff of OD <0.400 and the significant expense of the SRA test. Under direction of the Coagulation Laboratory Director, a standard operating procedure was developed where the coagulation laboratory personnel did not send out the SRA until a positive PF4 test (OD ≥ 0.400) was reported. If the PF4 was negative, the SRA was canceled and the ordering provider received notification of the cancelled test via the electronic medical record, accompanied by education about HIT testing (Figure 1). In addition, the lab increased the availability of PF4 testing from 5 days to 7 days a week so there were no delays in tests ordered on Fridays or weekends.
Outcomes
Our primary goals were to decrease both SRA testing and argatroban use. Secondarily, we examined the cost-effectiveness of this intervention. We hypothesized that controlling the SRA testing at the laboratory level would decrease both SRA testing and argatroban use.
Data Collection
Pre- and postintervention data were collected retrospectively. Pre-intervention data were from January 2016 through November 2017, and postintervention data were from December 2017 through March 2020. The number of SRA tests performed were identified retrospectively via review of electronic ordering records. All patients who had a hospital admission after January 1, 2016, were included. These patients were filtered to include only those who had a result for an SRA test. In order to calculate cost-savings, we identified both the number of SRA tests ordered retrospectively as well as patients who had both an SRA resulted and had been administered argatroban. Cost-savings were calculated based on our institutional cost of $357 per SRA test.
At our institution, argatroban is supplied in 50-mL bags; therefore, we utilized the number of bags to identify argatroban usage. Savings were calculated using the average wholesale price (AWP) of $292.50 per 50-mL bag. The amounts billed or collected for the SRA testing or argatroban treatment were not collected. Costs were estimated using only direct costs to the institution. Safety data were not collected. As the intent of our project was a quality improvement activity, this project did not require institutional review board regulation per our institutional guidance.
Results
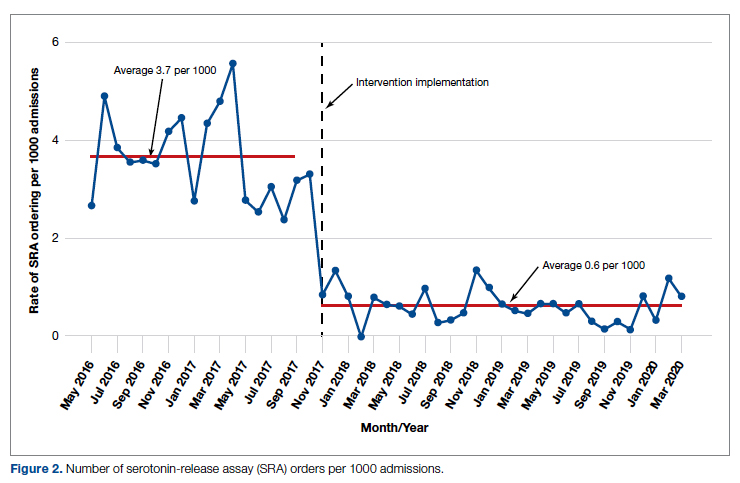
During the pre-intervention period, the average number of admissions (adults and children) at UM was 5863 per month. Post intervention there was an average of 5842 admissions per month. A total of 1192 PF4 tests were ordered before the intervention and 1148 were ordered post intervention. Prior to the intervention, 481 SRA tests were completed, while post intervention 105 were completed. Serotonin-release testing decreased from an average of 3.7 SRA results per 1000 admissions during the pre-intervention period to an average of 0.6 per 1000 admissions post intervention (Figure 2). Cost-savings were $1045 per 1000 admissions.
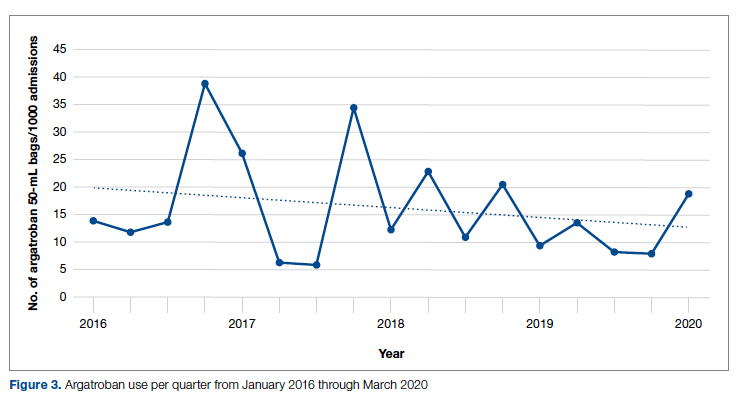
During the pre-intervention period, 2539 bags of argatroban were used, while 2337 bags were used post intervention. The number of 50-mL argatroban bags used per 1000 admissions decreased from 18.8 before the intervention to 14.3 post intervention. Cost-savings were $1316.20 per 1000 admissions. Figure 3 illustrates the monthly argatroban utilization per 1000 admissions during each quarter from January 2016 through March 2020.
Discussion
We designed and implemented an evidence-based strategy for HIT at our academic institution which led to a decrease in unnecessary SRA testing and argatroban utilization, with associated cost savings. By focusing on a single point of intervention at the laboratory level where SRA tests were held and canceled if the PF4 test was negative, we helped offload the decision-making from the provider while simultaneously providing just-in-time education to the provider. This intervention was designed with input from multiple stakeholders, including physicians, quality improvement specialists, pharmacists, and coagulation laboratory personnel.
Serotonin-release testing dramatically decreased post intervention even though a similar number of PF4 tests were performed before and after the intervention. This suggests that the decrease in SRA testing was a direct consequence of our intervention. Post intervention the number of completed SRA tests was 9% of the number of PF4 tests sent. This is consistent with our baseline pre-intervention data showing that only 8% of all PF4 tests sent were positive.
While the absolute number of argatroban bags utilized did not dramatically decrease after the intervention, the quarterly rate did, particularly after 2018. Given that argatroban data were only drawn from patients with a concurrent SRA test, this decrease is clearly from decreased usage in patients with suspected HIT. We suspect the decrease occurred because argatroban was not being continued while awaiting an SRA test in patients with a negative PF4 test. Decreasing the utilization of argatroban not only saved money but also reduced days of exposure to argatroban. While we do not have data regarding adverse events related to argatroban prior to the intervention, it is logical to conclude that reducing unnecessary exposure to argatroban reduces the risk of adverse events related to bleeding. Future studies would ideally address specific safety outcome metrics such as adverse events, bleeding risk, or missed diagnoses of HIT.
Our institutional guidelines for the diagnosis of HIT are evidence-based and helpful but are rarely followed by busy inpatient providers. Controlling the utilization of the SRA at the laboratory level had several advantages. First, removing SRA decision-making from providers who are not experts in the diagnosis of HIT guaranteed adherence to evidence-based guidelines. Second, pharmacists could safely recommend discontinuing argatroban when the PF4 test was negative as there was no SRA pending. Third, with cancellation at the laboratory level there was no need to further burden providers with yet another alert in the electronic health record. Fourth, just-in-time education was provided to the providers with justification for why the SRA test was canceled. Last, ruling out HIT within 24 hours with the PF4 test alone allowed providers to evaluate patients for other causes of thrombocytopenia much earlier than the 3 to 5 business days before the SRA results returned.
A limitation of this study is that it was conducted at a single center. Our approach is also limited by the lack of universal applicability. At our institution we are fortunate to have PF4 testing available in our coagulation laboratory 7 days a week. In addition, the coagulation laboratory controls sending the SRA to the reference laboratory. The specific intervention of controlling the SRA testing is therefore applicable only to institutions similar to ours; however, the concept of removing control of specialized testing from the provider is not unique. Inpatient thrombophilia testing has been a successful target of this approach.11-13 While electronic alerts and education of individual providers can also be effective initially, the effectiveness of these interventions has been repeatedly shown to wane over time.14-16
Conclusion
At our institution we were able to implement practical, evidence-based testing for HIT by implementing control over SRA testing at the level of the laboratory. This approach led to decreased argatroban utilization and cost savings.
Corresponding author: Alice Cusick, MD; LTC Charles S Kettles VA Medical Center, 2215 Fuller Road, Ann Arbor, MI 48105; mccoyag@med.umich.edu
Disclosures: None reported.
doi: 10.12788/jcom.0087
1. Fountain E, Arepally GM. Thrombocytopenia in hospitalized non-ICU patients. Blood. 2015;126(23):1060. doi:10.1182/blood.v126.23.1060.1060
2. Hui P, Cook DJ, Lim W, Fraser GA, Arnold DM. The frequency and clinical significance of thrombocytopenia complicating critical illness: a systematic review. Chest. 2011;139(2):271-278. doi:10.1378/chest.10-2243
3. Warkentin TE. Heparin-induced thrombocytopenia. Curr Opin Crit Care. 2015;21(6):576-585. doi:10.1097/MCC.0000000000000259
4. Cuker A, Arepally GM, Chong BH, et al. American Society of Hematology 2018 guidelines for management of venous thromboembolism: heparin-induced thrombocytopenia. Blood Adv. 2018;2(22):3360-3392. doi:10.1182/bloodadvances.2018024489
5. Cuker A, Gimotty PA, Crowther MA, Warkentin TE. Predictive value of the 4Ts scoring system for heparin-induced thrombocytopenia: a systematic review and meta-analysis. Blood. 2012;120(20):4160-4167. doi:10.1182/blood-2012-07-443051
6. Northam KA, Parker WF, Chen S-L, et al. Evaluation of 4Ts score inter-rater agreement in patients undergoing evaluation for heparin-induced thrombocytopenia. Blood Coagul Fibrinolysis. 2021;32(5):328-334. doi:10.1097/MBC.0000000000001042
7. Raschke RA, Curry SC, Warkentin TE, Gerkin RD. Improving clinical interpretation of the anti-platelet factor 4/heparin enzyme-linked immunosorbent assay for the diagnosis of heparin-induced thrombocytopenia through the use of receiver operating characteristic analysis, stratum-specific likelihood ratios, and Bayes theorem. Chest. 2013;144(4):1269-1275. doi:10.1378/chest.12-2712
8. Warkentin TE, Arnold DM, Nazi I, Kelton JG. The platelet serotonin-release assay. Am J Hematol. 2015;90(6):564-572. doi:10.1002/ajh.24006
9. Use IFOR, Contents TOF. LIFECODES ® PF4 IgG assay:1-9.
10. Ancker JS, Edwards A, Nosal S, Hauser D, Mauer E, Kaushal R. Effects of workload, work complexity, and repeated alerts on alert fatigue in a clinical decision support system. BMC Med Inform Decis Mak. 2017;17(1):1-9. doi:10.1186/s12911-017-0430-8
11. O’Connor N, Carter-Johnson R. Effective screening of pathology tests controls costs: thrombophilia testing. J Clin Pathol. 2006;59(5):556. doi:10.1136/jcp.2005.030700
12. Lim MY, Greenberg CS. Inpatient thrombophilia testing: Impact of healthcare system technology and targeted clinician education on changing practice patterns. Vasc Med (United Kingdom). 2018;23(1):78-79. doi:10.1177/1358863X17742509
13. Cox JL, Shunkwiler SM, Koepsell SA. Requirement for a pathologist’s second signature limits inappropriate inpatient thrombophilia testing. Lab Med. 2017;48(4):367-371. doi:10.1093/labmed/lmx040
14. Kwang H, Mou E, Richman I, et al. Thrombophilia testing in the inpatient setting: impact of an educational intervention. BMC Med Inform Decis Mak. 2019;19(1):167. doi:10.1186/s12911-019-0889-6
15. Shah T, Patel-Teague S, Kroupa L, Meyer AND, Singh H. Impact of a national QI programme on reducing electronic health record notifications to clinicians. BMJ Qual Saf. 2019;28(1):10-14. doi:10.1136/bmjqs-2017-007447
16. Singh H, Spitzmueller C, Petersen NJ, Sawhney MK, Sittig DF. Information overload and missed test results in electronic health record-based settings. JAMA Intern Med. 2013;173(8):702-704. doi:10.1001/2013.jamainternmed.61
From the Veterans Affairs Ann Arbor Healthcare System Medicine Service (Dr. Cusick), University of Michigan College of Pharmacy, Clinical Pharmacy Service, Michigan Medicine (Dr. Hanigan), Department of Internal Medicine Clinical Experience and Quality, Michigan Medicine (Linda Bashaw), Department of Internal Medicine, University of Michigan Medical School, Ann Arbor, MI (Dr. Heidemann), and the Operational Excellence Department, Sparrow Health System, Lansing, MI (Matthew Johnson).
Abstract
Background: Diagnosis of heparin-induced thrombocytopenia (HIT) requires completion of an enzyme-linked immunosorbent assay (ELISA)–based heparin-platelet factor 4 (PF4) antibody test. If this test is negative, HIT is excluded. If positive, a serotonin-release assay (SRA) test is indicated. The SRA is expensive and sometimes inappropriately ordered despite negative PF4 results, leading to unnecessary treatment with argatroban while awaiting SRA results.
Objectives: The primary objectives of this project were to reduce unnecessary SRA testing and argatroban utilization in patients with suspected HIT.
Methods: The authors implemented an intervention at a tertiary care academic hospital in November 2017 targeting patients hospitalized with suspected HIT. The intervention was controlled at the level of the laboratory and prevented ordering of SRA tests in the absence of a positive PF4 test. The number of SRA tests performed and argatroban bags administered were identified retrospectively via chart review before the intervention (January 2016 to November 2017) and post intervention (December 2017 to March 2020). Associated costs were calculated based on institutional SRA testing cost as well as the average wholesale price of argatroban.
Results: SRA testing decreased from an average of 3.7 SRA results per 1000 admissions before the intervention to an average of 0.6 results per 1000 admissions post intervention. The number of 50-mL argatroban bags used per 1000 admissions decreased from 18.8 prior to the intervention to 14.3 post intervention. Total estimated cost savings per 1000 admissions was $2361.20.
Conclusion: An evidence-based testing strategy for HIT can be effectively implemented at the level of the laboratory. This approach led to reductions in SRA testing and argatroban utilization with resultant cost savings.
Keywords: HIT, argatroban, anticoagulation, serotonin-release assay.
Thrombocytopenia is a common finding in hospitalized patients.1,2 Heparin-induced thrombocytopenia (HIT) is one of the many potential causes of thrombocytopenia in hospitalized patients and occurs when antibodies to the heparin-platelet factor 4 (PF4) complex develop after heparin exposure. This triggers a cascade of events, leading to platelet activation, platelet consumption, and thrombosis. While HIT is relatively rare, occurring in 0.3% to 0.5% of critically ill patients, many patients will be tested to rule out this potentially life-threatening cause of thrombocytopenia.3
The diagnosis of HIT utilizes a combination of both clinical suspicion and laboratory testing.4 The 4T score (Table) was developed to evaluate the clinical probability of HIT and involves assessing the degree and timing of thrombocytopenia, the presence or absence of thrombosis, and other potential causes of the thrombocytopenia.5 The 4T score is designed to be utilized to identify patients who require laboratory testing for HIT; however, it has low inter-rater agreement in patients undergoing evaluation for HIT,6 and, in our experience, completion of this scoring is time-consuming.
The enzyme-linked immunosorbent assay (ELISA) is a commonly used laboratory test to diagnose HIT that detects antibodies to the heparin-PF4 complex utilizing optical density (OD) units. When using an OD cutoff of 0.400, ELISA PF4 (PF4) tests have a sensitivity of 99.6%, but poor specificity at 69.3%.7 When the PF4 antibody test is positive with an OD ≥0.400, then a functional test is used to determine whether the antibodies detected will activate platelets. The serotonin-release assay (SRA) is a functional test that measures 14C-labeled serotonin release from donor platelets when mixed with patient serum or plasma containing HIT antibodies. In the correct clinical context, a positive ELISA PF4 antibody test along with a positive SRA is diagnostic of HIT.8
The process of diagnosing HIT in a timely and cost-effective manner is dependent on the clinician’s experience in diagnosing HIT as well as access to the laboratory testing necessary to confirm the diagnosis. PF4 antibody tests are time-consuming and not always available daily and/or are not available onsite. The SRA requires access to donor platelets and specialized radioactivity counting equipment, making it available only at particular centers.
The treatment of HIT is more straightforward and involves stopping all heparin products and starting a nonheparin anticoagulant. The direct thrombin inhibitor argatroban is one of the standard nonheparin anticoagulants used in patients with suspected HIT.4 While it is expensive, its short half-life and lack of renal clearance make it ideal for treatment of hospitalized patients with suspected HIT, many of whom need frequent procedures and/or have renal disease.
At our academic tertiary care center, we performed a retrospective analysis that showed inappropriate ordering of diagnostic HIT testing as well as unnecessary use of argatroban even when there was low suspicion for HIT based on laboratory findings. The aim of our project was to reduce unnecessary HIT testing and argatroban utilization without overburdening providers or interfering with established workflows.
Methods
Setting
The University of Michigan (UM) hospital is a 1000-bed tertiary care center in Ann Arbor, Michigan. The UM guidelines reflect evidence-based guidelines for the diagnosis and treatment of HIT.4 In 2016 the UM guidelines for laboratory testing included sending the PF4 antibody test first when there was clinical suspicion of HIT. The SRA was to be sent separately only when the PF4 returned positive (OD ≥ 0.400). Standard guidelines at UM also included switching patients with suspected HIT from heparin to a nonheparin anticoagulant and stopping all heparin products while awaiting the SRA results. The direct thrombin inhibitor argatroban is utilized at UM and monitored with anti-IIa levels. University of Michigan Hospital utilizes the Immucor PF4 IgG ELISA for detecting heparin-associated antibodies.9 In 2016, this PF4 test was performed in the UM onsite laboratory Monday through Friday. At UM the SRA is performed off site, with a turnaround time of 3 to 5 business days.
Baseline Data
We retrospectively reviewed PF4 and SRA testing as well as argatroban usage from December 2016 to May 2017. Despite the institutional guidelines, providers were sending PF4 and SRA simultaneously as soon as HIT was suspected; 62% of PF4 tests were ordered simultaneously with the SRA, but only 8% of these PF4 tests were positive with an OD ≥0.400. Of those patients with negative PF4 testing, argatroban was continued until the SRA returned negative, leading to many days of unnecessary argatroban usage. An informal survey of the anticoagulation pharmacists revealed that many recommended discontinuing argatroban when the PF4 test was negative, but providers routinely did not feel comfortable with this approach. This suggested many providers misunderstood the performance characteristics of the PF4 test.
Intervention
Our team consisted of hematology and internal medicine faculty, pharmacists, coagulation laboratory personnel, and quality improvement specialists. We designed and implemented an intervention in November 2017 focused on controlling the ordering of the SRA test. We chose to focus on this step due to the excellent sensitivity of the PF4 test with a cutoff of OD <0.400 and the significant expense of the SRA test. Under direction of the Coagulation Laboratory Director, a standard operating procedure was developed where the coagulation laboratory personnel did not send out the SRA until a positive PF4 test (OD ≥ 0.400) was reported. If the PF4 was negative, the SRA was canceled and the ordering provider received notification of the cancelled test via the electronic medical record, accompanied by education about HIT testing (Figure 1). In addition, the lab increased the availability of PF4 testing from 5 days to 7 days a week so there were no delays in tests ordered on Fridays or weekends.
Outcomes
Our primary goals were to decrease both SRA testing and argatroban use. Secondarily, we examined the cost-effectiveness of this intervention. We hypothesized that controlling the SRA testing at the laboratory level would decrease both SRA testing and argatroban use.
Data Collection
Pre- and postintervention data were collected retrospectively. Pre-intervention data were from January 2016 through November 2017, and postintervention data were from December 2017 through March 2020. The number of SRA tests performed were identified retrospectively via review of electronic ordering records. All patients who had a hospital admission after January 1, 2016, were included. These patients were filtered to include only those who had a result for an SRA test. In order to calculate cost-savings, we identified both the number of SRA tests ordered retrospectively as well as patients who had both an SRA resulted and had been administered argatroban. Cost-savings were calculated based on our institutional cost of $357 per SRA test.
At our institution, argatroban is supplied in 50-mL bags; therefore, we utilized the number of bags to identify argatroban usage. Savings were calculated using the average wholesale price (AWP) of $292.50 per 50-mL bag. The amounts billed or collected for the SRA testing or argatroban treatment were not collected. Costs were estimated using only direct costs to the institution. Safety data were not collected. As the intent of our project was a quality improvement activity, this project did not require institutional review board regulation per our institutional guidance.
Results
During the pre-intervention period, the average number of admissions (adults and children) at UM was 5863 per month. Post intervention there was an average of 5842 admissions per month. A total of 1192 PF4 tests were ordered before the intervention and 1148 were ordered post intervention. Prior to the intervention, 481 SRA tests were completed, while post intervention 105 were completed. Serotonin-release testing decreased from an average of 3.7 SRA results per 1000 admissions during the pre-intervention period to an average of 0.6 per 1000 admissions post intervention (Figure 2). Cost-savings were $1045 per 1000 admissions.
During the pre-intervention period, 2539 bags of argatroban were used, while 2337 bags were used post intervention. The number of 50-mL argatroban bags used per 1000 admissions decreased from 18.8 before the intervention to 14.3 post intervention. Cost-savings were $1316.20 per 1000 admissions. Figure 3 illustrates the monthly argatroban utilization per 1000 admissions during each quarter from January 2016 through March 2020.
Discussion
We designed and implemented an evidence-based strategy for HIT at our academic institution which led to a decrease in unnecessary SRA testing and argatroban utilization, with associated cost savings. By focusing on a single point of intervention at the laboratory level where SRA tests were held and canceled if the PF4 test was negative, we helped offload the decision-making from the provider while simultaneously providing just-in-time education to the provider. This intervention was designed with input from multiple stakeholders, including physicians, quality improvement specialists, pharmacists, and coagulation laboratory personnel.
Serotonin-release testing dramatically decreased post intervention even though a similar number of PF4 tests were performed before and after the intervention. This suggests that the decrease in SRA testing was a direct consequence of our intervention. Post intervention the number of completed SRA tests was 9% of the number of PF4 tests sent. This is consistent with our baseline pre-intervention data showing that only 8% of all PF4 tests sent were positive.
While the absolute number of argatroban bags utilized did not dramatically decrease after the intervention, the quarterly rate did, particularly after 2018. Given that argatroban data were only drawn from patients with a concurrent SRA test, this decrease is clearly from decreased usage in patients with suspected HIT. We suspect the decrease occurred because argatroban was not being continued while awaiting an SRA test in patients with a negative PF4 test. Decreasing the utilization of argatroban not only saved money but also reduced days of exposure to argatroban. While we do not have data regarding adverse events related to argatroban prior to the intervention, it is logical to conclude that reducing unnecessary exposure to argatroban reduces the risk of adverse events related to bleeding. Future studies would ideally address specific safety outcome metrics such as adverse events, bleeding risk, or missed diagnoses of HIT.
Our institutional guidelines for the diagnosis of HIT are evidence-based and helpful but are rarely followed by busy inpatient providers. Controlling the utilization of the SRA at the laboratory level had several advantages. First, removing SRA decision-making from providers who are not experts in the diagnosis of HIT guaranteed adherence to evidence-based guidelines. Second, pharmacists could safely recommend discontinuing argatroban when the PF4 test was negative as there was no SRA pending. Third, with cancellation at the laboratory level there was no need to further burden providers with yet another alert in the electronic health record. Fourth, just-in-time education was provided to the providers with justification for why the SRA test was canceled. Last, ruling out HIT within 24 hours with the PF4 test alone allowed providers to evaluate patients for other causes of thrombocytopenia much earlier than the 3 to 5 business days before the SRA results returned.
A limitation of this study is that it was conducted at a single center. Our approach is also limited by the lack of universal applicability. At our institution we are fortunate to have PF4 testing available in our coagulation laboratory 7 days a week. In addition, the coagulation laboratory controls sending the SRA to the reference laboratory. The specific intervention of controlling the SRA testing is therefore applicable only to institutions similar to ours; however, the concept of removing control of specialized testing from the provider is not unique. Inpatient thrombophilia testing has been a successful target of this approach.11-13 While electronic alerts and education of individual providers can also be effective initially, the effectiveness of these interventions has been repeatedly shown to wane over time.14-16
Conclusion
At our institution we were able to implement practical, evidence-based testing for HIT by implementing control over SRA testing at the level of the laboratory. This approach led to decreased argatroban utilization and cost savings.
Corresponding author: Alice Cusick, MD; LTC Charles S Kettles VA Medical Center, 2215 Fuller Road, Ann Arbor, MI 48105; mccoyag@med.umich.edu
Disclosures: None reported.
doi: 10.12788/jcom.0087
1. Fountain E, Arepally GM. Thrombocytopenia in hospitalized non-ICU patients. Blood. 2015;126(23):1060. doi:10.1182/blood.v126.23.1060.1060
2. Hui P, Cook DJ, Lim W, Fraser GA, Arnold DM. The frequency and clinical significance of thrombocytopenia complicating critical illness: a systematic review. Chest. 2011;139(2):271-278. doi:10.1378/chest.10-2243
3. Warkentin TE. Heparin-induced thrombocytopenia. Curr Opin Crit Care. 2015;21(6):576-585. doi:10.1097/MCC.0000000000000259
4. Cuker A, Arepally GM, Chong BH, et al. American Society of Hematology 2018 guidelines for management of venous thromboembolism: heparin-induced thrombocytopenia. Blood Adv. 2018;2(22):3360-3392. doi:10.1182/bloodadvances.2018024489
5. Cuker A, Gimotty PA, Crowther MA, Warkentin TE. Predictive value of the 4Ts scoring system for heparin-induced thrombocytopenia: a systematic review and meta-analysis. Blood. 2012;120(20):4160-4167. doi:10.1182/blood-2012-07-443051
6. Northam KA, Parker WF, Chen S-L, et al. Evaluation of 4Ts score inter-rater agreement in patients undergoing evaluation for heparin-induced thrombocytopenia. Blood Coagul Fibrinolysis. 2021;32(5):328-334. doi:10.1097/MBC.0000000000001042
7. Raschke RA, Curry SC, Warkentin TE, Gerkin RD. Improving clinical interpretation of the anti-platelet factor 4/heparin enzyme-linked immunosorbent assay for the diagnosis of heparin-induced thrombocytopenia through the use of receiver operating characteristic analysis, stratum-specific likelihood ratios, and Bayes theorem. Chest. 2013;144(4):1269-1275. doi:10.1378/chest.12-2712
8. Warkentin TE, Arnold DM, Nazi I, Kelton JG. The platelet serotonin-release assay. Am J Hematol. 2015;90(6):564-572. doi:10.1002/ajh.24006
9. Use IFOR, Contents TOF. LIFECODES ® PF4 IgG assay:1-9.
10. Ancker JS, Edwards A, Nosal S, Hauser D, Mauer E, Kaushal R. Effects of workload, work complexity, and repeated alerts on alert fatigue in a clinical decision support system. BMC Med Inform Decis Mak. 2017;17(1):1-9. doi:10.1186/s12911-017-0430-8
11. O’Connor N, Carter-Johnson R. Effective screening of pathology tests controls costs: thrombophilia testing. J Clin Pathol. 2006;59(5):556. doi:10.1136/jcp.2005.030700
12. Lim MY, Greenberg CS. Inpatient thrombophilia testing: Impact of healthcare system technology and targeted clinician education on changing practice patterns. Vasc Med (United Kingdom). 2018;23(1):78-79. doi:10.1177/1358863X17742509
13. Cox JL, Shunkwiler SM, Koepsell SA. Requirement for a pathologist’s second signature limits inappropriate inpatient thrombophilia testing. Lab Med. 2017;48(4):367-371. doi:10.1093/labmed/lmx040
14. Kwang H, Mou E, Richman I, et al. Thrombophilia testing in the inpatient setting: impact of an educational intervention. BMC Med Inform Decis Mak. 2019;19(1):167. doi:10.1186/s12911-019-0889-6
15. Shah T, Patel-Teague S, Kroupa L, Meyer AND, Singh H. Impact of a national QI programme on reducing electronic health record notifications to clinicians. BMJ Qual Saf. 2019;28(1):10-14. doi:10.1136/bmjqs-2017-007447
16. Singh H, Spitzmueller C, Petersen NJ, Sawhney MK, Sittig DF. Information overload and missed test results in electronic health record-based settings. JAMA Intern Med. 2013;173(8):702-704. doi:10.1001/2013.jamainternmed.61
Acute STEMI During the COVID-19 Pandemic at a Regional Hospital: Incidence, Clinical Characteristics, and Outcomes
From the Department of Medicine, Medical College of Georgia at the Augusta University-University of Georgia Medical Partnership, Athens, GA (Syed H. Ali, Syed Hyder, and Dr. Murrow), and the Department of Cardiology, Piedmont Heart Institute, Piedmont Athens Regional, Athens, GA (Dr. Murrow and Mrs. Davis).
Abstract
Objectives: The aim of this study was to describe the characteristics and in-hospital outcomes of patients with acute ST-segment elevation myocardial infarction (STEMI) during the early COVID-19 pandemic at Piedmont Athens Regional (PAR), a 330-bed tertiary referral center in Northeast Georgia.
Methods: A retrospective study was conducted at PAR to evaluate patients with acute STEMI admitted over an 8-week period during the initial COVID-19 outbreak. This study group was compared to patients admitted during the corresponding period in 2019. The primary endpoint of this study was defined as a composite of sustained ventricular arrhythmia, congestive heart failure (CHF) with pulmonary congestion, and/or in-hospital mortality.
Results: This study cohort was composed of 64 patients with acute STEMI; 30 patients (46.9%) were hospitalized during the COVID-19 pandemic. Patients with STEMI in both the COVID-19 and control groups had similar comorbidities, Killip classification score, and clinical presentations. The median (interquartile range) time from symptom onset to reperfusion (total ischemic time) increased from 99.5 minutes (84.8-132) in 2019 to 149 minutes (96.3-231.8; P = .032) in 2020. Hospitalization during the COVID-19 period was associated with an increased risk for combined in-hospital outcome (odds ratio, 3.96; P = .046).
Conclusion: Patients with STEMI admitted during the first wave of the COVID-19 outbreak experienced longer total ischemic time and increased risk for combined in-hospital outcomes compared to patients admitted during the corresponding period in 2019.
Keywords: myocardial infarction, acute coronary syndrome, hospitalization, outcomes.

The emergence of the SARS-Cov-2 virus in December 2019 caused a worldwide shift in resource allocation and the restructuring of health care systems within the span of a few months. With the rapid spread of infection, the World Health Organization officially declared a pandemic in March 2020. The pandemic led to the deferral and cancellation of in-person patient visits, routine diagnostic studies, and nonessential surgeries and procedures. This response occurred secondary to a joint effort to reduce transmission via stay-at-home mandates and appropriate social distancing.1
Alongside the reduction in elective procedures and health care visits, significant reductions in hospitalization rates due to decreases in acute ST-segment elevation myocardial infarction (STEMI) and catheterization laboratory utilization have been reported in many studies from around the world.2-7 Comprehensive data demonstrating the impact of the COVID-19 pandemic on acute STEMI patient characteristics, clinical presentation, and in-hospital outcomes are lacking. Although patients with previously diagnosed cardiovascular disease are more likely to encounter worse outcomes in the setting of COVID-19, there may also be an indirect impact of the pandemic on high-risk patients, including those without the infection.8 Several theories have been hypothesized to explain this phenomenon. One theory postulates that the fear of contracting the virus during hospitalization is great enough to prevent patients from seeking care.2 Another theory suggests that the increased utilization of telemedicine prevents exacerbation of chronic conditions and the need for hospitalization.9 Contrary to this trend, previous studies have shown an increased incidence of acute STEMI following stressful events such as natural disasters.10
The aim of this study was to describe trends pertaining to clinical characteristics and in-hospital outcomes of patients with acute STEMI during the early COVID-19 pandemic at Piedmont Athens Regional (PAR), a 330-bed tertiary referral center in Northeast Georgia.
Methods
A retrospective cohort study was conducted at PAR to evaluate patients with STEMI admitted to the cardiovascular intensive care unit over an 8-week period (March 5 to May 5, 2020) during the COVID-19 outbreak. COVID-19 was declared a national emergency on March 13, 2020, in the United States. The institutional review board at PAR approved the study; the need for individual consent was waived under the condition that participant data would undergo de-identification and be strictly safeguarded.
Data Collection
Because there are seasonal variations in cardiovascular admissions, patient data from a control period (March 9 to May 9, 2019) were obtained to compare with data from the 2020 period. The number of patients with the diagnosis of acute STEMI during the COVID-19 period was recorded. Demographic data, clinical characteristics, and primary angiographic findings were gathered for all patients. Time from symptom onset to hospital admission and time from hospital admission to reperfusion (defined as door-to-balloon time) were documented for each patient. Killip classification was used to assess patients’ clinical status on admission. Length of stay was determined as days from hospital admission to discharge or death (if occurring during the same hospitalization).
Adverse in-hospital complications were also recorded. These were selected based on inclusion of the following categories of acute STEMI complications: ischemic, mechanical, arrhythmic, embolic, and inflammatory. The following complications occurred in our patient cohort: sustained ventricular arrhythmia, congestive heart failure (CHF) defined as congestion requiring intravenous diuretics, re-infarction, mechanical complications (free-wall rupture, ventricular septal defect, or mitral regurgitation), second- or third-degree atrioventricular block, atrial fibrillation, stroke, mechanical ventilation, major bleeding, pericarditis, cardiogenic shock, cardiac arrest, and in-hospital mortality. The primary outcome of this study was defined as a composite of sustained ventricular arrhythmia, CHF with congestion requiring intravenous diuretics, and/or in-hospital mortality. Ventricular arrythmia and CHF were included in the composite outcome because they are defined as the 2 most common causes of sudden cardiac death following acute STEMI.11,12
Statistical Analysis
Normally distributed continuous variables and categorical variables were compared using the paired t-test. A 2-sided P value <.05 was considered to be statistically significant. Mean admission rates for acute STEMI hospitalizations were determined by dividing the number of admissions by the number of days in each time period. The daily rate of COVID-19 cases per 100,000 individuals was obtained from the Centers for Disease Control and Prevention COVID-19 database. All data analyses were performed using Microsoft Excel.
Results
The study cohort consisted of 64 patients, of whom 30 (46.9%) were hospitalized between March 5 and May 5, 2020, and 34 (53.1%) who were admitted during the analogous time period in 2019. This reflected a 6% decrease in STEMI admissions at PAR in the COVID-19 cohort.
Acute STEMI Hospitalization Rates and COVID-19 Incidence
The mean daily acute STEMI admission rate was 0.50 during the study period compared to 0.57 during the control period. During the study period in 2020 in the state of Georgia, the daily rate of newly confirmed COVID-19 cases ranged from 0.194 per 100,000 on March 5 to 8.778 per 100,000 on May 5. Results of COVID-19 testing were available for 9 STEMI patients, and of these 0 tests were positive.
Baseline Characteristics
Baseline characteristics of the acute STEMI cohorts are presented in Table 1. Approximately 75% were male; median (interquartile range [IQR]) age was 60 (51-72) years. There were no significant differences in age and gender between the study periods. Three-quarters of patients had a history of hypertension, and 87.5% had a history of dyslipidemia. There was no significant difference in baseline comorbidity profiles between the 2 study periods; therefore, our sample populations shared similar characteristics.
Clinical Presentation
Significant differences were observed regarding the time intervals of STEMI patients in the COVID-19 period and the control period (Table 2). Median time from symptom onset to hospital admission (patient delay) was extended from 57.5 minutes (IQR, 40.3-106) in 2019 to 93 minutes (IQR, 48.8-132) in 2020; however, this difference was not statistically significant (P = .697). Median time from hospital admission to reperfusion (system delay) was prolonged from 45 minutes (IQR, 28-61) in 2019 to 78 minutes (IQR, 50-110) in 2020 (P < .001). Overall time from symptom onset to reperfusion (total ischemic time) increased from 99.5 minutes (IQR, 84.8-132) in 2019 to 149 minutes (IQR, 96.3-231.8) in 2020 (P = .032).
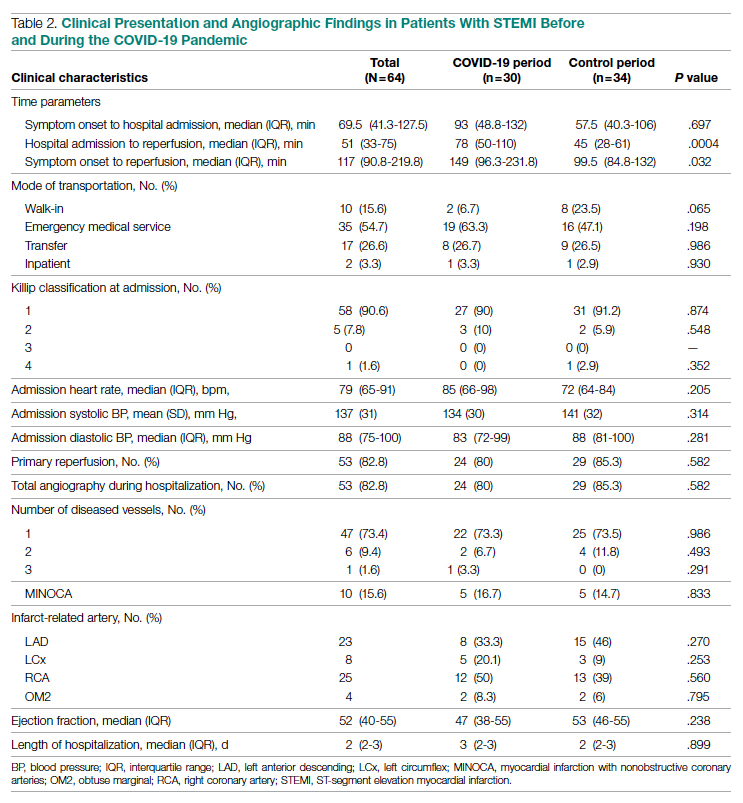
Regarding mode of transportation, 23.5% of patients in 2019 were walk-in admissions to the emergency department. During the COVID-19 period, walk-in admissions decreased to 6.7% (P = .065). There were no significant differences between emergency medical service, transfer, or in-patient admissions for STEMI cases between the 2 study periods.
Killip classification scores were calculated for all patients on admission; 90.6% of patients were classified as Killip Class 1. There was no significant difference between hemodynamic presentations during the COVID-19 period compared to the control period.
Angiographic Data
Overall, 53 (82.8%) patients admitted with acute STEMI underwent coronary angiography during their hospital stay. The proportion of patients who underwent primary reperfusion was greater in the control period than in the COVID-19 period (85.3% vs 80%; P = .582). Angiographic characteristics and findings were similar between the 2 study groups (Table 2).
In-Hospital Outcomes
In-hospital outcome data were available for all patients. As shown in Table 3, hospitalization during the COVID-19 period was independently associated with an increased risk for combined in-hospital outcome (odds ratio, 3.96; P = .046). The rate of in-hospital mortality was greater in the COVID-19 period (P = .013). We found no significant difference when comparing secondary outcomes from admissions during the COVID-19 period and the control period in 2019. For the 5 patients who died during the study period, the primary diagnosis at death was acute STEMI complicated by CHF (3 patients) or cardiogenic shock (2 patients).
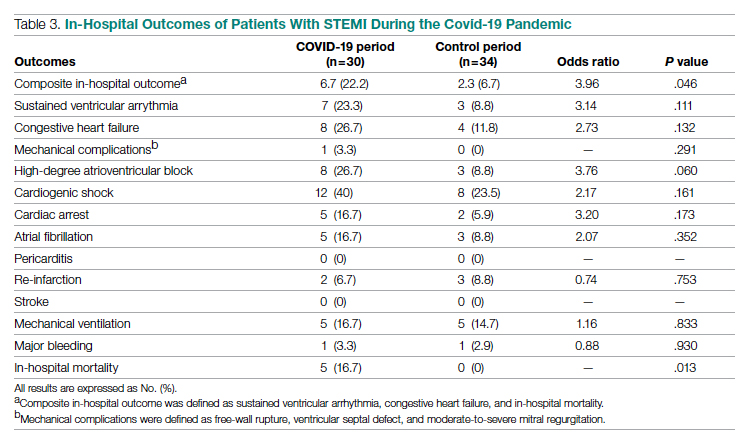
Discussion
This single-center retrospective study at PAR looks at the impact of COVID-19 on hospitalizations for acute STEMI during the initial peak of the pandemic. The key findings of this study show a significant increase in ischemic time parameters (symptom onset to reperfusion, hospital admission to reperfusion), in-hospital mortality, and combined in-hospital outcomes.
There was a 49.5-minute increase in total ischemic time noted in this study (P = .032). Though there was a numerical increase in time of symptom onset to hospital admission by 23.5 minutes, this difference was not statistically significant (P = .697). However, this study observed a statistically significant 33-minute increase in ischemic time from hospital admission to reperfusion (P < .001). Multiple studies globally have found a similar increase in total ischemic times, including those conducted in China and Europe.13-15 Every level of potential delay must be considered, including pre-hospital, triage and emergency department, and/or reperfusion team. Pre-hospital sources of delays that have been suggested include “stay-at-home” orders and apprehension to seek medical care due to concern about contracting the virus or overwhelming the health care facilities. There was a clinically significant 4-fold decrease in the number of walk-in acute STEMI cases in the study period. In 2019, there were 8 walk-in cases compared to 2 cases in 2020 (P = .065). However, this change was not statistically significant. In-hospital/systemic sources of delays have been mentioned in other studies; they include increased time taken to rule out COVID-19 (nasopharyngeal swab/chest x-ray) and increased time due to the need for intensive gowning and gloving procedures by staff. It was difficult to objectively determine the sources of system delay by the reperfusion team due to a lack of quantitative data.
In the current study, we found a significant increase in in-hospital mortality during the COVID-19 period compared to a parallel time frame in 2019. This finding is contrary to a multicenter study from Spain that reported no difference in in-hospital outcomes or mortality rates among all acute coronary syndrome cases.16 The worsening outcomes and prognosis may simply be a result of increased ischemic time; however, the virus that causes COVID-19 itself may play a role as well. Studies have found that SARS-Cov-2 infection places patients at greater risk for cardiovascular conditions such as hypercoagulability, myocarditis, and arrhythmias.17 In our study, however, there were no acute STEMI patients who tested positive for COVID-19. Therefore, we cannot discuss the impact of increased thrombus burden in patients with COVID-19. Piedmont Healthcare published a STEMI treatment protocol in May 2020 that advised increased use of tissue plasminogen activator (tPA) in COVID-19-positive cases; during the study period, however, there were no occasions when tPA use was deemed appropriate based on clinical judgment.
Our findings align with previous studies that describe an increase in combined in-hospital adverse outcomes during the COVID-19 era. Previous studies detected a higher rate of complications in the COVID-19 cohort, but in the current study, the adverse in-hospital course is unrelated to underlying infection.18,19 This study reports a higher incidence of major in-hospital outcomes, including a 65% increase in the rate of combined in-hospital outcomes, which is similar to a multicenter study conducted in Israel.19 There was a 2.3-fold numerical increase in sustained ventricular arrhythmias and a 2.5-fold numerical increase in the incidence of cardiac arrest in the study period. This phenomenon was observed despite a similar rate of reperfusion procedures in both groups.
Acute STEMI is a highly fatal condition with an incidence of 8.5 in 10,000 annually in the United States. While studies across the world have shown a 25% to 40% reduction in the rate of hospitalized acute coronary syndrome cases during the COVID-19 pandemic, the decrease from 34 to 30 STEMI admissions at PAR is not statistically significant.20 Possible reasons for the reduction globally include increased out-of-hospital mortality and decreased incidence of acute STEMI across the general population as a result of improved access to telemedicine or decreased levels of life stressors.20
In summary, there was an increase in ischemic time to reperfusion, in-hospital mortality, and combined in-hospital outcomes for acute STEMI patients at PAR during the COVID period.
Limitations
This study has several limitations. This is a single-center study, so the sample size is small and may not be generalizable to a larger population. This is a retrospective observational study, so causation cannot be inferred. This study analyzed ischemic time parameters as average rates over time rather than in an interrupted time series. Post-reperfusion outcomes were limited to hospital stay. Post-hospital follow-up would provide a better picture of the effects of STEMI intervention. There is no account of patients who died out-of-hospital secondary to acute STEMI. COVID-19 testing was not introduced until midway in our study period. Therefore, we cannot rule out the possibility of the SARS-Cov-2 virus inciting acute STEMI and subsequently leading to worse outcomes and poor prognosis.
Conclusions
This study provides an analysis of the incidence, characteristics, and clinical outcomes of patients presenting with acute STEMI during the early period of the COVID-19 pandemic. In-hospital mortality and ischemic time to reperfusion increased while combined in-hospital outcomes worsened.
Acknowledgment: The authors thank Piedmont Athens Regional IRB for approving this project and allowing access to patient data.
Corresponding author: Syed H. Ali; Department of Medicine, Medical College of Georgia at the Augusta University-University of Georgia Medical Partnership, 30606, Athens, GA; syedha.ali@gmail.com
Disclosures: None reported.
doi:10.12788/jcom.0085
1. Bhatt AS, Moscone A, McElrath EE, et al. Fewer hospitalizations for acute cardiovascular conditions during the COVID-19 pandemic. J Am Coll Cardiol. 2020;76(3):280-288. doi:10.1016/j.jacc.2020.05.038
2. Metzler B, Siostrzonek P, Binder RK, Bauer A, Reinstadler SJR. Decline of acute coronary syndrome admissions in Austria since the outbreak of Covid-19: the pandemic response causes cardiac collateral damage. Eur Heart J. 2020;41:1852-1853. doi:10.1093/eurheartj/ehaa314
3. De Rosa S, Spaccarotella C, Basso C, et al. Reduction of hospitalizations for myocardial infarction in Italy in the Covid-19 era. Eur Heart J. 2020;41(22):2083-2088.
4. Wilson SJ, Connolly MJ, Elghamry Z, et al. Effect of the COVID-19 pandemic on ST-segment-elevation myocardial infarction presentations and in-hospital outcomes. Circ Cardiovasc Interv. 2020; 13(7):e009438. doi:10.1161/CIRCINTERVENTIONS.120.009438
5. Mafham MM, Spata E, Goldacre R, et al. Covid-19 pandemic and admission rates for and management of acute coronary syndromes in England. Lancet. 2020;396 (10248):381-389. doi:10.1016/S0140-6736(20)31356-8
6. Bhatt AS, Moscone A, McElrath EE, et al. Fewer Hospitalizations for acute cardiovascular conditions during the COVID-19 pandemic. J Am Coll Cardiol. 2020;76(3):280-288. doi:10.1016/j.jacc.2020.05.038
7. Tam CF, Cheung KS, Lam S, et al. Impact of Coronavirus disease 2019 (Covid-19) outbreak on ST-segment elevation myocardial infarction care in Hong Kong, China. Circ Cardiovasc Qual Outcomes. 2020;13(4):e006631. doi:10.1161/CIRCOUTCOMES.120.006631
8. Clerkin KJ, Fried JA, Raikhelkar J, et al. Coronavirus disease 2019 (COVID-19) and cardiovascular disease. Circulation. 2020;141:1648-1655. doi:10.1161/CIRCULATIONAHA.120.046941
9. Ebinger JE, Shah PK. Declining admissions for acute cardiovascular illness: The Covid-19 paradox. J Am Coll Cardiol. 2020;76(3):289-291. doi:10.1016/j.jacc.2020.05.039
10 Leor J, Poole WK, Kloner RA. Sudden cardiac death triggered by an earthquake. N Engl J Med. 1996;334(7):413-419. doi:10.1056/NEJM199602153340701
11. Hiramori K. Major causes of death from acute myocardial infarction in a coronary care unit. Jpn Circ J. 1987;51(9):1041-1047. doi:10.1253/jcj.51.1041
12. Bui AH, Waks JW. Risk stratification of sudden cardiac death after acute myocardial infarction. J Innov Card Rhythm Manag. 2018;9(2):3035-3049. doi:10.19102/icrm.2018.090201
13. Xiang D, Xiang X, Zhang W, et al. Management and outcomes of patients with STEMI during the COVID-19 pandemic in China. J Am Coll Cardiol. 2020;76(11):1318-1324. doi:10.1016/j.jacc.2020.06.039
14. Hakim R, Motreff P, Rangé G. COVID-19 and STEMI. [Article in French]. Ann Cardiol Angeiol (Paris). 2020;69(6):355-359. doi:10.1016/j.ancard.2020.09.034
15. Soylu K, Coksevim M, Yanık A, Bugra Cerik I, Aksan G. Effect of Covid-19 pandemic process on STEMI patients timeline. Int J Clin Pract. 2021;75(5):e14005. doi:10.1111/ijcp.14005
16. Salinas P, Travieso A, Vergara-Uzcategui C, et al. Clinical profile and 30-day mortality of invasively managed patients with suspected acute coronary syndrome during the COVID-19 outbreak. Int Heart J. 2021;62(2):274-281. doi:10.1536/ihj.20-574
17. Hu Y, Sun J, Dai Z, et al. Prevalence and severity of corona virus disease 2019 (Covid-19): a systematic review and meta-analysis. J Clin Virol. 2020;127:104371. doi:10.1016/j.jcv.2020.104371
18. Rodriguez-Leor O, Cid Alvarez AB, Perez de Prado A, et al. In-hospital outcomes of COVID-19 ST-elevation myocardial infarction patients. EuroIntervention. 2021;16(17):1426-1433. doi:10.4244/EIJ-D-20-00935
19. Fardman A, Zahger D, Orvin K, et al. Acute myocardial infarction in the Covid-19 era: incidence, clinical characteristics and in-hospital outcomes—A multicenter registry. PLoS ONE. 2021;16(6): e0253524. doi:10.1371/journal.pone.0253524
20. Pessoa-Amorim G, Camm CF, Gajendragadkar P, et al. Admission of patients with STEMI since the outbreak of the COVID-19 pandemic: a survey by the European Society of Cardiology. Eur Heart J Qual Care Clin Outcomes. 2020;6(3):210-216. doi:10.1093/ehjqcco/qcaa046
From the Department of Medicine, Medical College of Georgia at the Augusta University-University of Georgia Medical Partnership, Athens, GA (Syed H. Ali, Syed Hyder, and Dr. Murrow), and the Department of Cardiology, Piedmont Heart Institute, Piedmont Athens Regional, Athens, GA (Dr. Murrow and Mrs. Davis).
Abstract
Objectives: The aim of this study was to describe the characteristics and in-hospital outcomes of patients with acute ST-segment elevation myocardial infarction (STEMI) during the early COVID-19 pandemic at Piedmont Athens Regional (PAR), a 330-bed tertiary referral center in Northeast Georgia.
Methods: A retrospective study was conducted at PAR to evaluate patients with acute STEMI admitted over an 8-week period during the initial COVID-19 outbreak. This study group was compared to patients admitted during the corresponding period in 2019. The primary endpoint of this study was defined as a composite of sustained ventricular arrhythmia, congestive heart failure (CHF) with pulmonary congestion, and/or in-hospital mortality.
Results: This study cohort was composed of 64 patients with acute STEMI; 30 patients (46.9%) were hospitalized during the COVID-19 pandemic. Patients with STEMI in both the COVID-19 and control groups had similar comorbidities, Killip classification score, and clinical presentations. The median (interquartile range) time from symptom onset to reperfusion (total ischemic time) increased from 99.5 minutes (84.8-132) in 2019 to 149 minutes (96.3-231.8; P = .032) in 2020. Hospitalization during the COVID-19 period was associated with an increased risk for combined in-hospital outcome (odds ratio, 3.96; P = .046).
Conclusion: Patients with STEMI admitted during the first wave of the COVID-19 outbreak experienced longer total ischemic time and increased risk for combined in-hospital outcomes compared to patients admitted during the corresponding period in 2019.
Keywords: myocardial infarction, acute coronary syndrome, hospitalization, outcomes.
The emergence of the SARS-Cov-2 virus in December 2019 caused a worldwide shift in resource allocation and the restructuring of health care systems within the span of a few months. With the rapid spread of infection, the World Health Organization officially declared a pandemic in March 2020. The pandemic led to the deferral and cancellation of in-person patient visits, routine diagnostic studies, and nonessential surgeries and procedures. This response occurred secondary to a joint effort to reduce transmission via stay-at-home mandates and appropriate social distancing.1
Alongside the reduction in elective procedures and health care visits, significant reductions in hospitalization rates due to decreases in acute ST-segment elevation myocardial infarction (STEMI) and catheterization laboratory utilization have been reported in many studies from around the world.2-7 Comprehensive data demonstrating the impact of the COVID-19 pandemic on acute STEMI patient characteristics, clinical presentation, and in-hospital outcomes are lacking. Although patients with previously diagnosed cardiovascular disease are more likely to encounter worse outcomes in the setting of COVID-19, there may also be an indirect impact of the pandemic on high-risk patients, including those without the infection.8 Several theories have been hypothesized to explain this phenomenon. One theory postulates that the fear of contracting the virus during hospitalization is great enough to prevent patients from seeking care.2 Another theory suggests that the increased utilization of telemedicine prevents exacerbation of chronic conditions and the need for hospitalization.9 Contrary to this trend, previous studies have shown an increased incidence of acute STEMI following stressful events such as natural disasters.10
The aim of this study was to describe trends pertaining to clinical characteristics and in-hospital outcomes of patients with acute STEMI during the early COVID-19 pandemic at Piedmont Athens Regional (PAR), a 330-bed tertiary referral center in Northeast Georgia.
Methods
A retrospective cohort study was conducted at PAR to evaluate patients with STEMI admitted to the cardiovascular intensive care unit over an 8-week period (March 5 to May 5, 2020) during the COVID-19 outbreak. COVID-19 was declared a national emergency on March 13, 2020, in the United States. The institutional review board at PAR approved the study; the need for individual consent was waived under the condition that participant data would undergo de-identification and be strictly safeguarded.
Data Collection
Because there are seasonal variations in cardiovascular admissions, patient data from a control period (March 9 to May 9, 2019) were obtained to compare with data from the 2020 period. The number of patients with the diagnosis of acute STEMI during the COVID-19 period was recorded. Demographic data, clinical characteristics, and primary angiographic findings were gathered for all patients. Time from symptom onset to hospital admission and time from hospital admission to reperfusion (defined as door-to-balloon time) were documented for each patient. Killip classification was used to assess patients’ clinical status on admission. Length of stay was determined as days from hospital admission to discharge or death (if occurring during the same hospitalization).
Adverse in-hospital complications were also recorded. These were selected based on inclusion of the following categories of acute STEMI complications: ischemic, mechanical, arrhythmic, embolic, and inflammatory. The following complications occurred in our patient cohort: sustained ventricular arrhythmia, congestive heart failure (CHF) defined as congestion requiring intravenous diuretics, re-infarction, mechanical complications (free-wall rupture, ventricular septal defect, or mitral regurgitation), second- or third-degree atrioventricular block, atrial fibrillation, stroke, mechanical ventilation, major bleeding, pericarditis, cardiogenic shock, cardiac arrest, and in-hospital mortality. The primary outcome of this study was defined as a composite of sustained ventricular arrhythmia, CHF with congestion requiring intravenous diuretics, and/or in-hospital mortality. Ventricular arrythmia and CHF were included in the composite outcome because they are defined as the 2 most common causes of sudden cardiac death following acute STEMI.11,12
Statistical Analysis
Normally distributed continuous variables and categorical variables were compared using the paired t-test. A 2-sided P value <.05 was considered to be statistically significant. Mean admission rates for acute STEMI hospitalizations were determined by dividing the number of admissions by the number of days in each time period. The daily rate of COVID-19 cases per 100,000 individuals was obtained from the Centers for Disease Control and Prevention COVID-19 database. All data analyses were performed using Microsoft Excel.
Results
The study cohort consisted of 64 patients, of whom 30 (46.9%) were hospitalized between March 5 and May 5, 2020, and 34 (53.1%) who were admitted during the analogous time period in 2019. This reflected a 6% decrease in STEMI admissions at PAR in the COVID-19 cohort.
Acute STEMI Hospitalization Rates and COVID-19 Incidence
The mean daily acute STEMI admission rate was 0.50 during the study period compared to 0.57 during the control period. During the study period in 2020 in the state of Georgia, the daily rate of newly confirmed COVID-19 cases ranged from 0.194 per 100,000 on March 5 to 8.778 per 100,000 on May 5. Results of COVID-19 testing were available for 9 STEMI patients, and of these 0 tests were positive.
Baseline Characteristics
Baseline characteristics of the acute STEMI cohorts are presented in Table 1. Approximately 75% were male; median (interquartile range [IQR]) age was 60 (51-72) years. There were no significant differences in age and gender between the study periods. Three-quarters of patients had a history of hypertension, and 87.5% had a history of dyslipidemia. There was no significant difference in baseline comorbidity profiles between the 2 study periods; therefore, our sample populations shared similar characteristics.
Clinical Presentation
Significant differences were observed regarding the time intervals of STEMI patients in the COVID-19 period and the control period (Table 2). Median time from symptom onset to hospital admission (patient delay) was extended from 57.5 minutes (IQR, 40.3-106) in 2019 to 93 minutes (IQR, 48.8-132) in 2020; however, this difference was not statistically significant (P = .697). Median time from hospital admission to reperfusion (system delay) was prolonged from 45 minutes (IQR, 28-61) in 2019 to 78 minutes (IQR, 50-110) in 2020 (P < .001). Overall time from symptom onset to reperfusion (total ischemic time) increased from 99.5 minutes (IQR, 84.8-132) in 2019 to 149 minutes (IQR, 96.3-231.8) in 2020 (P = .032).
Regarding mode of transportation, 23.5% of patients in 2019 were walk-in admissions to the emergency department. During the COVID-19 period, walk-in admissions decreased to 6.7% (P = .065). There were no significant differences between emergency medical service, transfer, or in-patient admissions for STEMI cases between the 2 study periods.
Killip classification scores were calculated for all patients on admission; 90.6% of patients were classified as Killip Class 1. There was no significant difference between hemodynamic presentations during the COVID-19 period compared to the control period.
Angiographic Data
Overall, 53 (82.8%) patients admitted with acute STEMI underwent coronary angiography during their hospital stay. The proportion of patients who underwent primary reperfusion was greater in the control period than in the COVID-19 period (85.3% vs 80%; P = .582). Angiographic characteristics and findings were similar between the 2 study groups (Table 2).
In-Hospital Outcomes
In-hospital outcome data were available for all patients. As shown in Table 3, hospitalization during the COVID-19 period was independently associated with an increased risk for combined in-hospital outcome (odds ratio, 3.96; P = .046). The rate of in-hospital mortality was greater in the COVID-19 period (P = .013). We found no significant difference when comparing secondary outcomes from admissions during the COVID-19 period and the control period in 2019. For the 5 patients who died during the study period, the primary diagnosis at death was acute STEMI complicated by CHF (3 patients) or cardiogenic shock (2 patients).
Discussion
This single-center retrospective study at PAR looks at the impact of COVID-19 on hospitalizations for acute STEMI during the initial peak of the pandemic. The key findings of this study show a significant increase in ischemic time parameters (symptom onset to reperfusion, hospital admission to reperfusion), in-hospital mortality, and combined in-hospital outcomes.
There was a 49.5-minute increase in total ischemic time noted in this study (P = .032). Though there was a numerical increase in time of symptom onset to hospital admission by 23.5 minutes, this difference was not statistically significant (P = .697). However, this study observed a statistically significant 33-minute increase in ischemic time from hospital admission to reperfusion (P < .001). Multiple studies globally have found a similar increase in total ischemic times, including those conducted in China and Europe.13-15 Every level of potential delay must be considered, including pre-hospital, triage and emergency department, and/or reperfusion team. Pre-hospital sources of delays that have been suggested include “stay-at-home” orders and apprehension to seek medical care due to concern about contracting the virus or overwhelming the health care facilities. There was a clinically significant 4-fold decrease in the number of walk-in acute STEMI cases in the study period. In 2019, there were 8 walk-in cases compared to 2 cases in 2020 (P = .065). However, this change was not statistically significant. In-hospital/systemic sources of delays have been mentioned in other studies; they include increased time taken to rule out COVID-19 (nasopharyngeal swab/chest x-ray) and increased time due to the need for intensive gowning and gloving procedures by staff. It was difficult to objectively determine the sources of system delay by the reperfusion team due to a lack of quantitative data.
In the current study, we found a significant increase in in-hospital mortality during the COVID-19 period compared to a parallel time frame in 2019. This finding is contrary to a multicenter study from Spain that reported no difference in in-hospital outcomes or mortality rates among all acute coronary syndrome cases.16 The worsening outcomes and prognosis may simply be a result of increased ischemic time; however, the virus that causes COVID-19 itself may play a role as well. Studies have found that SARS-Cov-2 infection places patients at greater risk for cardiovascular conditions such as hypercoagulability, myocarditis, and arrhythmias.17 In our study, however, there were no acute STEMI patients who tested positive for COVID-19. Therefore, we cannot discuss the impact of increased thrombus burden in patients with COVID-19. Piedmont Healthcare published a STEMI treatment protocol in May 2020 that advised increased use of tissue plasminogen activator (tPA) in COVID-19-positive cases; during the study period, however, there were no occasions when tPA use was deemed appropriate based on clinical judgment.
Our findings align with previous studies that describe an increase in combined in-hospital adverse outcomes during the COVID-19 era. Previous studies detected a higher rate of complications in the COVID-19 cohort, but in the current study, the adverse in-hospital course is unrelated to underlying infection.18,19 This study reports a higher incidence of major in-hospital outcomes, including a 65% increase in the rate of combined in-hospital outcomes, which is similar to a multicenter study conducted in Israel.19 There was a 2.3-fold numerical increase in sustained ventricular arrhythmias and a 2.5-fold numerical increase in the incidence of cardiac arrest in the study period. This phenomenon was observed despite a similar rate of reperfusion procedures in both groups.
Acute STEMI is a highly fatal condition with an incidence of 8.5 in 10,000 annually in the United States. While studies across the world have shown a 25% to 40% reduction in the rate of hospitalized acute coronary syndrome cases during the COVID-19 pandemic, the decrease from 34 to 30 STEMI admissions at PAR is not statistically significant.20 Possible reasons for the reduction globally include increased out-of-hospital mortality and decreased incidence of acute STEMI across the general population as a result of improved access to telemedicine or decreased levels of life stressors.20
In summary, there was an increase in ischemic time to reperfusion, in-hospital mortality, and combined in-hospital outcomes for acute STEMI patients at PAR during the COVID period.
Limitations
This study has several limitations. This is a single-center study, so the sample size is small and may not be generalizable to a larger population. This is a retrospective observational study, so causation cannot be inferred. This study analyzed ischemic time parameters as average rates over time rather than in an interrupted time series. Post-reperfusion outcomes were limited to hospital stay. Post-hospital follow-up would provide a better picture of the effects of STEMI intervention. There is no account of patients who died out-of-hospital secondary to acute STEMI. COVID-19 testing was not introduced until midway in our study period. Therefore, we cannot rule out the possibility of the SARS-Cov-2 virus inciting acute STEMI and subsequently leading to worse outcomes and poor prognosis.
Conclusions
This study provides an analysis of the incidence, characteristics, and clinical outcomes of patients presenting with acute STEMI during the early period of the COVID-19 pandemic. In-hospital mortality and ischemic time to reperfusion increased while combined in-hospital outcomes worsened.
Acknowledgment: The authors thank Piedmont Athens Regional IRB for approving this project and allowing access to patient data.
Corresponding author: Syed H. Ali; Department of Medicine, Medical College of Georgia at the Augusta University-University of Georgia Medical Partnership, 30606, Athens, GA; syedha.ali@gmail.com
Disclosures: None reported.
doi:10.12788/jcom.0085
1. Bhatt AS, Moscone A, McElrath EE, et al. Fewer hospitalizations for acute cardiovascular conditions during the COVID-19 pandemic. J Am Coll Cardiol. 2020;76(3):280-288. doi:10.1016/j.jacc.2020.05.038
2. Metzler B, Siostrzonek P, Binder RK, Bauer A, Reinstadler SJR. Decline of acute coronary syndrome admissions in Austria since the outbreak of Covid-19: the pandemic response causes cardiac collateral damage. Eur Heart J. 2020;41:1852-1853. doi:10.1093/eurheartj/ehaa314
3. De Rosa S, Spaccarotella C, Basso C, et al. Reduction of hospitalizations for myocardial infarction in Italy in the Covid-19 era. Eur Heart J. 2020;41(22):2083-2088.
4. Wilson SJ, Connolly MJ, Elghamry Z, et al. Effect of the COVID-19 pandemic on ST-segment-elevation myocardial infarction presentations and in-hospital outcomes. Circ Cardiovasc Interv. 2020; 13(7):e009438. doi:10.1161/CIRCINTERVENTIONS.120.009438
5. Mafham MM, Spata E, Goldacre R, et al. Covid-19 pandemic and admission rates for and management of acute coronary syndromes in England. Lancet. 2020;396 (10248):381-389. doi:10.1016/S0140-6736(20)31356-8
6. Bhatt AS, Moscone A, McElrath EE, et al. Fewer Hospitalizations for acute cardiovascular conditions during the COVID-19 pandemic. J Am Coll Cardiol. 2020;76(3):280-288. doi:10.1016/j.jacc.2020.05.038
7. Tam CF, Cheung KS, Lam S, et al. Impact of Coronavirus disease 2019 (Covid-19) outbreak on ST-segment elevation myocardial infarction care in Hong Kong, China. Circ Cardiovasc Qual Outcomes. 2020;13(4):e006631. doi:10.1161/CIRCOUTCOMES.120.006631
8. Clerkin KJ, Fried JA, Raikhelkar J, et al. Coronavirus disease 2019 (COVID-19) and cardiovascular disease. Circulation. 2020;141:1648-1655. doi:10.1161/CIRCULATIONAHA.120.046941
9. Ebinger JE, Shah PK. Declining admissions for acute cardiovascular illness: The Covid-19 paradox. J Am Coll Cardiol. 2020;76(3):289-291. doi:10.1016/j.jacc.2020.05.039
10 Leor J, Poole WK, Kloner RA. Sudden cardiac death triggered by an earthquake. N Engl J Med. 1996;334(7):413-419. doi:10.1056/NEJM199602153340701
11. Hiramori K. Major causes of death from acute myocardial infarction in a coronary care unit. Jpn Circ J. 1987;51(9):1041-1047. doi:10.1253/jcj.51.1041
12. Bui AH, Waks JW. Risk stratification of sudden cardiac death after acute myocardial infarction. J Innov Card Rhythm Manag. 2018;9(2):3035-3049. doi:10.19102/icrm.2018.090201
13. Xiang D, Xiang X, Zhang W, et al. Management and outcomes of patients with STEMI during the COVID-19 pandemic in China. J Am Coll Cardiol. 2020;76(11):1318-1324. doi:10.1016/j.jacc.2020.06.039
14. Hakim R, Motreff P, Rangé G. COVID-19 and STEMI. [Article in French]. Ann Cardiol Angeiol (Paris). 2020;69(6):355-359. doi:10.1016/j.ancard.2020.09.034
15. Soylu K, Coksevim M, Yanık A, Bugra Cerik I, Aksan G. Effect of Covid-19 pandemic process on STEMI patients timeline. Int J Clin Pract. 2021;75(5):e14005. doi:10.1111/ijcp.14005
16. Salinas P, Travieso A, Vergara-Uzcategui C, et al. Clinical profile and 30-day mortality of invasively managed patients with suspected acute coronary syndrome during the COVID-19 outbreak. Int Heart J. 2021;62(2):274-281. doi:10.1536/ihj.20-574
17. Hu Y, Sun J, Dai Z, et al. Prevalence and severity of corona virus disease 2019 (Covid-19): a systematic review and meta-analysis. J Clin Virol. 2020;127:104371. doi:10.1016/j.jcv.2020.104371
18. Rodriguez-Leor O, Cid Alvarez AB, Perez de Prado A, et al. In-hospital outcomes of COVID-19 ST-elevation myocardial infarction patients. EuroIntervention. 2021;16(17):1426-1433. doi:10.4244/EIJ-D-20-00935
19. Fardman A, Zahger D, Orvin K, et al. Acute myocardial infarction in the Covid-19 era: incidence, clinical characteristics and in-hospital outcomes—A multicenter registry. PLoS ONE. 2021;16(6): e0253524. doi:10.1371/journal.pone.0253524
20. Pessoa-Amorim G, Camm CF, Gajendragadkar P, et al. Admission of patients with STEMI since the outbreak of the COVID-19 pandemic: a survey by the European Society of Cardiology. Eur Heart J Qual Care Clin Outcomes. 2020;6(3):210-216. doi:10.1093/ehjqcco/qcaa046
Oxygen Therapies and Clinical Outcomes for Patients Hospitalized With COVID-19: First Surge vs Second Surge
From Lahey Hospital and Medical Center, Burlington, MA (Drs. Liesching and Lei), and Tufts University School of Medicine, Boston, MA (Dr. Liesching)
ABSTRACT
Objective: To compare the utilization of oxygen therapies and clinical outcomes of patients admitted for COVID-19 during the second surge of the pandemic to that of patients admitted during the first surge.
Design: Observational study using a registry database.
Setting: Three hospitals (791 inpatient beds and 76 intensive care unit [ICU] beds) within the Beth Israel Lahey Health system in Massachusetts.
Participants: We included 3183 patients with COVID-19 admitted to hospitals.
Measurements: Baseline data included demographics and comorbidities. Treatments included low-flow supplemental oxygen (2-6 L/min), high-flow oxygen via nasal cannula, and invasive mechanical ventilation. Outcomes included ICU admission, length of stay, ventilator days, and mortality.
Results: A total of 3183 patients were included: 1586 during the first surge and 1597 during the second surge. Compared to the first surge, patients admitted during the second surge had a similar rate of receiving low-flow supplemental oxygen (65.8% vs 64.1%, P = .3), a higher rate of receiving high-flow nasal cannula (15.4% vs 10.8%, P = .0001), and a lower ventilation rate (5.6% vs 9.7%, P < .0001). The outcomes during the second surge were better than those during the first surge: lower ICU admission rate (8.1% vs 12.7%, P < .0001), shorter length of hospital stay (5 vs 6 days, P < .0001), fewer ventilator days (10 vs 16, P = .01), and lower mortality (8.3% vs 19.2%, P < .0001). Among ventilated patients, those who received high-flow nasal cannula had lower mortality.
Conclusion: Compared to the first surge of the COVID-19 pandemic, patients admitted during the second surge had similar likelihood of receiving low-flow supplemental oxygen, were more likely to receive high-flow nasal cannula, were less likely to be ventilated, and had better outcomes.
Keywords: supplemental oxygen, high-flow nasal cannula, ventilator.
The respiratory system receives the major impact of SARS-CoV-2 virus, and hypoxemia has been the predominant diagnosis for patients hospitalized with COVID-19.1,2 During the initial stage of the pandemic, oxygen therapies and mechanical ventilation were the only choices for these patients.3-6 Standard-of-care treatment for patients with COVID-19 during the initial surge included oxygen therapies and mechanical ventilation for hypoxemia and medications for comorbidities and COVID-19–associated sequelae, such as multi-organ dysfunction and failure. A report from New York during the first surge (May 2020) showed that among 5700 hospitalized patients with COVID-19, 27.8% received supplemental oxygen and 12.2% received invasive mechanical ventilation.7 High-flow nasal cannula (HFNC) oxygen delivery has been utilized widely throughout the pandemic due to its superiority over other noninvasive respiratory support techniques.8-12 Mechanical ventilation is always necessary for critically ill patients with acute respiratory distress syndrome. However, ventilator scarcity has become a bottleneck in caring for severely ill patients with COVID-19 during the pandemic.13
The clinical outcomes of hospitalized COVID-19 patients include a high intubation rate, long length of hospital and intensive care unit (ICU) stay, and high mortality.14,15 As the pandemic evolved, new medications, including remdesivir, hydroxychloroquine, lopinavir, or interferon β-1a, were used in addition to the standard of care, but these did not result in significantly different mortality from standard of care.16 Steroids are becoming foundational to the treatment of severe COVID-19 pneumonia, but evidence from high-quality randomized controlled clinical trials is lacking.17
During the first surge from March to May 2020, Massachusetts had the third highest number of COVID-19 cases among states in the United States.18 In early 2021, COVID-19 cases were climbing close to the peak of the second surge in Massachusetts. In this study, we compared utilization of low-flow supplemental oxygen, HFNC, and mechanical ventilation and clinical outcomes of patients admitted to 3 hospitals in Massachusetts during the second surge of the pandemic to that of patients admitted during the first surge.
Methods
Setting
Beth Israel Lahey Health is a system of academic and teaching hospitals with primary care and specialty care providers. We included 3 centers within the Beth Israel Lahey Health system in Massachusetts: Lahey Hospital and Medical Center, with 335 inpatient hospital beds and 52 critical care beds; Beverly Hospital, with 227 beds and 14 critical care beds; and Winchester Hospital, with 229 beds and 10 ICU beds.
Participants
We included patients admitted to the 3 hospitals with COVID-19 as a primary or secondary diagnosis during the first surge of the pandemic (March 1, 2020 to June 15, 2020) and the second surge (November 15, 2020 to January 27, 2021). The timeframe of the first surge was defined as the window between the start date and the end date of data collection. During the time window of the first surge, 1586 patients were included. The start time of the second surge was defined as the date when the data collection was restarted; the end date was set when the number of patients (1597) accumulated was close to the number of patients in the first surge (1586), so that the two groups had similar sample size.
Study Design
A data registry of COVID-19 patients was created by our institution, and the data were prospectively collected starting in March 2020. We retrospectively extracted data on the following from the registry database for this observational study: demographics and baseline comorbidities; the use of low-flow supplemental oxygen, HFNC, and invasive mechanical ventilator; and ICU admission, length of hospital stay, length of ICU stay, and hospital discharge disposition. Start and end times for each oxygen therapy were not entered in the registry. Data about other oxygen therapies, such as noninvasive positive-pressure ventilation, were not collected in the registry database, and therefore were not included in the analysis.
Statistical Analysis
Continuous variables (eg, age) were tested for data distribution normality using the Shapiro-Wilk test. Normally distributed data were tested using unpaired t-tests and displayed as mean (SD). The skewed data were tested using the Wilcoxon rank sum test and displayed as median (interquartile range [IQR]). The categorical variables were compared using chi-square test. Comparisons with P ≤ .05 were considered significantly different. Statistical analysis for this study was generated using Statistical Analysis Software (SAS), version 9.4 for Windows (SAS Institute Inc.).
Results
Baseline Characteristics
We included 3183 patients: 1586 admitted during the first surge and 1597 admitted during the second surge. Baseline characteristics of patients with COVID-19 admitted during the first and second surges are shown in Table 1. Patients admitted during the second surge were older (73 years vs 71 years, P = .01) and had higher rates of hypertension (64.8% vs 59.6%, P = .003) and asthma (12.9% vs 10.7%, P = .049) but a lower rate of interstitial lung disease (3.3% vs 7.7%, P < .001). Sequential organ failure assessment scores at admission and the rates of other comorbidities were not significantly different between the 2 surges.

Oxygen Therapies
The number of patients who were hospitalized and received low-flow supplemental oxygen, and/or HFNC, and/or ventilator in the first surge and the second surge is shown in the Figure. Of all patients included, 2067 (64.9%) received low-flow supplemental oxygen; of these, 374 (18.1%) subsequently received HFNC, and 85 (22.7%) of these subsequently received mechanical ventilation. Of all 3183 patients, 417 (13.1%) received HFNC; 43 of these patients received HFNC without receiving low-flow supplemental oxygen, and 98 (23.5%) subsequently received mechanical ventilation. Out of all 3183 patients, 244 (7.7%) received mechanical ventilation; 98 (40.2%) of these received HFNC while the remaining 146 (59.8%) did not. At the beginning of the first surge, the ratio of patients who received invasive mechanical ventilation to patients who received HFNC was close to 1:1 (10/10); the ratio decreased to 6:10 in May and June 2020. At the beginning of the second surge, the ratio was 8:10 and then decreased to 3:10 in December 2020 and January 2021.
As shown in Table 2, the proportion of patients who received low-flow supplemental oxygen during the second surge was similar to that during the first surge (65.8% vs 64.1%, P = .3). Patients admitted during the second surge were more likely to receive HFNC than patients admitted during the first surge (15.4% vs 10.8%, P = .0001). Patients admitted during the second surge were less likely to be ventilated than the patients admitted during the first surge (5.6% vs 9.7%, P < .0001).
Clinical Outcomes
As shown in Table 3, second surge outcomes were much better than first surge outcomes: the ICU admission rate was lower (8.1% vs 12.7%, P < .0001); patients were more likely to be discharged to home (60.2% vs 47.4%, P < .0001), had a shorter length of hospital stay (5 vs 6 days, P < .0001), and had fewer ventilator days (10 vs 16, P = .01); and mortality was lower (8.3% vs 19.2%, P < .0001). There was a trend that length of ICU stay was shorter during the second surge than during the first surge (7 days vs 9 days, P = .09).
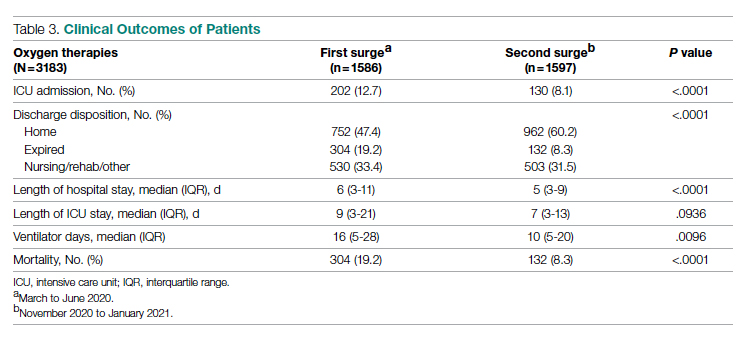
As noted (Figure), the ratio of patients who received invasive mechanical ventilation to patients who received HFNC was decreasing during both the first surge and the second surge. To further analyze the relation between ventilator and HFNC, we performed a subgroup analysis for 244 ventilated patients during both surges to compare outcomes between patients who received HFNC and those who did not receive HFNC (Table 4). Ninety-eight (40%) patients received HFNC. Ventilated patients who received HFNC had lower mortality than those patients who did not receive HFNC (31.6% vs 48%, P = .01), but had a longer length of hospital stay (29 days vs 14 days, P < .0001), longer length of ICU stay (17 days vs 9 days, P < .0001), and a higher number of ventilator days (16 vs 11, P = .001).
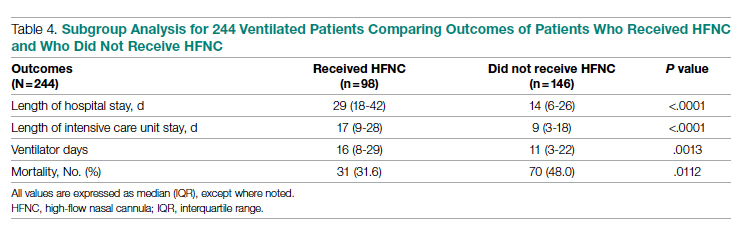
Discussion
Our study compared the baseline patient characteristics; utilization of low-flow supplemental oxygen therapy, HFNC, and mechanical ventilation; and clinical outcomes between the first surge (n = 1586) and the second surge (n = 1597) of the COVID-19 pandemic. During both surges, about two-thirds of admitted patients received low-flow supplemental oxygen. A higher proportion of the admitted patients received HFNC during the second surge than during the first surge, while the intubation rate was lower during the second surge than during the first surge.
Reported low-flow supplemental oxygen use ranged from 28% to 63% depending on the cohort characteristics and location during the first surge.6,7,19 A report from New York during the first surge (March 1 to April 4, 2020) showed that among 5700 hospitalized patients with COVID-19, 27.8% received low-flow supplemental oxygen.7 HFNC is recommended in guidelines on management of patients with acute respiratory failure due to COVID-19.20 In our study, HFNC was utilized in a higher proportion of patients admitted for COVID-19 during the second surge (15.5% vs 10.8%, P = .0001). During the early pandemic period in Wuhan, China, 11% to 21% of admitted COVID-19 patients received HFNC.21,22 Utilization of HFNC in New York during the first surge (March to May 2020) varied from 5% to 14.3% of patients admitted with COVID-19.23,24 Our subgroup analysis of the ventilated patients showed that patients who received HFNC had lower mortality than those who did not (31.6% vs 48.0%, P = .011). Comparably, a report from Paris, France, showed that among patients admitted to ICUs for acute hypoxemic respiratory failure, those who received HFNC had lower mortality at day 60 than those who did not (21% vs 31%, P = .052).25 Our recent analysis showed that patients treated with HFNC prior to mechanical ventilation had lower mortality than those treated with only conventional oxygen (30% vs 52%, P = .05).26 In this subgroup analysis, we could not determine if HFNC treatment was administered before or after ventilation because HFNC was entered as dichotomous data (“Yes” or “No”) in the registry database. We merely showed the beneficial effect of HFNC on reducing mortality for ventilated COVID-19 patients, but did not mean to focus on how and when to apply HFNC.
We observed that the patients admitted during the second surge were less likely to be ventilated than the patients admitted during the first surge (5.6% vs 9.7%, P < .0001). During the first surge in New York, among 5700 patients admitted with COVID-19, 12.2% received invasive mechanical ventilation.7 In another report, also from New York during the first surge, 26.1% of 2015 hospitalized COVID-19 patients received mechanical ventilation.27 In our study, the ventilation rate of 9.7% during the first surge was lower.
Outcomes during the second surge were better than during the first surge, including ICU admission rate, hospital and ICU length of stay, ventilator days, and mortality. The mortality was 19.2% during the first surge vs 8.3% during the second surge (P < .0001). The mortality of 19.2% was lower than the 30.6% mortality reported for 2015 hospitalized COVID-19 patients in New York during the first surge.27 A retrospective study showed that early administration of remdesivir was associated with reduced ICU admission, ventilation use, and mortality.28 The RECOVERY clinical trial showed that dexamethasone improved mortality for COVID-19 patients who received respiratory support, but not for patients who did not receive any respiratory support.29 Perhaps some, if not all, of the improvement in ICU admission and mortality during the second surge was attributed to the new medications, such as antivirals and steroids.
The length of hospital stay for patients with moderate to severe COVID-19 varied from 4 to 53 days at different locations of the world, as shown in a meta-analysis by Rees and colleagues.30 Our results showing a length of stay of 6 days during the first surge and 5 days during the second surge fell into the shorter end of this range. In a retrospective analysis of 1643 adults with severe COVID-19 admitted to hospitals in New York City between March 9, 2020 and April 23, 2020, median hospital length of stay was 7 (IQR, 3-14) days.31 For the ventilated patients in our study, the length of stay of 14 days (did not receive HFNC) and 29 days (received HFNC) was much longer. This longer length of stay might be attributed to the patients in our study being older and having more severe comorbidities.
The main purpose of this study was to compare the oxygen therapies and outcomes between 2 surges. It is difficult to associate the clinical outcomes with the oxygen therapies because new therapies and medications were available after the first surge. It was not possible to adjust the outcomes with confounders (other therapies and medications) because the registry data did not include the new therapies and medications.
A strength of this study was that we included a large, balanced number of patients in the first surge and the second surge. We did not plan the sample size in both groups as we could not predict the number of admissions. We set the end date of data collection for analysis as the time when the number of patients admitted during the second surge was similar to the number of patients admitted during the first surge. A limitation was that the registry database was created by the institution and was not designed solely for this study. The data for oxygen therapies were limited to low-flow supplemental oxygen, HFNC, and invasive mechanical ventilation; data for noninvasive ventilation were not included.
Conclusion
At our centers, during the second surge of COVID-19 pandemic, patients hospitalized with COVID-19 infection were more likely to receive HFNC but less likely to be ventilated. Compared to the first surge, the hospitalized patients with COVID-19 infection had a lower ICU admission rate, shorter length of hospital stay, fewer ventilator days, and lower mortality. For ventilated patients, those who received HFNC had lower mortality than those who did not.
Corresponding author: Timothy N. Liesching, MD, 41 Mall Road, Burlington, MA 01805; Timothy.N.Liesching@lahey.org
Disclosures: None reported.
doi:10.12788/jcom.0086
1. Xie J, Covassin N, Fan Z, et al. Association between hypoxemia and mortality in patients with COVID-19. Mayo Clin Proc. 2020;95(6):1138-1147. doi:10.1016/j.mayocp.2020.04.006
2. Asleh R, Asher E, Yagel O, et al. Predictors of hypoxemia and related adverse outcomes in patients hospitalized with COVID-19: a double-center retrospective study. J Clin Med. 2021;10(16):3581. doi:10.3390/jcm10163581
3. Choi KJ, Hong HL, Kim EJ. Association between oxygen saturation/fraction of inhaled oxygen and mortality in patients with COVID-19 associated pneumonia requiring oxygen therapy. Tuberc Respir Dis (Seoul). 2021;84(2):125-133. doi:10.4046/trd.2020.0126
4. Dixit SB. Role of noninvasive oxygen therapy strategies in COVID-19 patients: Where are we going? Indian J Crit Care Med. 2020;24(10):897-898. doi:10.5005/jp-journals-10071-23625
5. Gonzalez-Castro A, Fajardo Campoverde A, Medina A, et al. Non-invasive mechanical ventilation and high-flow oxygen therapy in the COVID-19 pandemic: the value of a draw. Med Intensiva (Engl Ed). 2021;45(5):320-321. doi:10.1016/j.medine.2021.04.001
6. Pan W, Li J, Ou Y, et al. Clinical outcome of standardized oxygen therapy nursing strategy in COVID-19. Ann Palliat Med. 2020;9(4):2171-2177. doi:10.21037/apm-20-1272
7. Richardson S, Hirsch JS, Narasimhan M, et al. Presenting characteristics, comorbidities, and outcomes among 5700 patients hospitalized with COVID-19 in the New York City area. JAMA. 2020;323(20):2052-2059. doi:10.1001/jama.2020.6775
8. He G, Han Y, Fang Q, et al. Clinical experience of high-flow nasal cannula oxygen therapy in severe COVID-19 patients. Article in Chinese. Zhejiang Da Xue Xue Bao Yi Xue Ban. 2020;49(2):232-239. doi:10.3785/j.issn.1008-9292.2020.03.13
9. Lalla U, Allwood BW, Louw EH, et al. The utility of high-flow nasal cannula oxygen therapy in the management of respiratory failure secondary to COVID-19 pneumonia. S Afr Med J. 2020;110(6):12941.
10. Zhang TT, Dai B, Wang W. Should the high-flow nasal oxygen therapy be used or avoided in COVID-19? J Transl Int Med. 2020;8(2):57-58. doi:10.2478/jtim-2020-0018
11. Agarwal A, Basmaji J, Muttalib F, et al. High-flow nasal cannula for acute hypoxemic respiratory failure in patients with COVID-19: systematic reviews of effectiveness and its risks of aerosolization, dispersion, and infection transmission. Can J Anaesth. 2020;67(9):1217-1248. doi:10.1007/s12630-020-01740-2
12. Geng S, Mei Q, Zhu C, et al. High flow nasal cannula is a good treatment option for COVID-19. Heart Lung. 2020;49(5):444-445. doi:10.1016/j.hrtlng.2020.03.018
13. Feinstein MM, Niforatos JD, Hyun I, et al. Considerations for ventilator triage during the COVID-19 pandemic. Lancet Respir Med. 2020;8(6):e53. doi:10.1016/S2213-2600(20)30192-2
14. Wu Z, McGoogan JM. Characteristics of and important lessons from the coronavirus disease 2019 (COVID-19) outbreak in China: summary of a report of 72314 cases from the Chinese Center for Disease Control and Prevention. JAMA. 2020;323(13):1239-1242. doi:10.1001/jama.2020.2648
15. Rojas-Marte G, Hashmi AT, Khalid M, et al. Outcomes in patients with COVID-19 disease and high oxygen requirements. J Clin Med Res. 2021;13(1):26-37. doi:10.14740/jocmr4405
16. Zhang R, Mylonakis E. In inpatients with COVID-19, none of remdesivir, hydroxychloroquine, lopinavir, or interferon β-1a differed from standard care for in-hospital mortality. Ann Intern Med. 2021;174(2):JC17. doi:10.7326/ACPJ202102160-017
17. Rello J, Waterer GW, Bourdiol A, Roquilly A. COVID-19, steroids and other immunomodulators: The jigsaw is not complete. Anaesth Crit Care Pain Med. 2020;39(6):699-701. doi:10.1016/j.accpm.2020.10.011
18. Dargin J, Stempek S, Lei Y, Gray Jr. A, Liesching T. The effect of a tiered provider staffing model on patient outcomes during the coronavirus disease 2019 pandemic: A single-center observational study. Int J Crit Illn Inj Sci. 2021;11(3). doi:10.4103/ijciis.ijciis_37_21
19. Ni YN, Wang T, Liang BM, Liang ZA. The independent factors associated with oxygen therapy in COVID-19 patients under 65 years old. PLoS One. 2021;16(1):e0245690. doi:10.1371/journal.pone.0245690
20. Alhazzani W, Moller MH, Arabi YM, et al. Surviving Sepsis Campaign: guidelines on the management of critically ill adults with coronavirus disease 2019 (COVID-19). Crit Care Med. 2020;48(6):e440-e469. doi:10.1097/CCM.0000000000004363
21. Wang D, Hu B, Hu C, et al. Clinical characteristics of 138 hospitalized patients with 2019 novel coronavirus-infected pneumonia in Wuhan, China. JAMA. 2020;323(11):1061-1069. doi:10.1001/jama.2020.1585
22. Zhou F, Yu T, Du R, et al. Clinical course and risk factors for mortality of adult inpatients with COVID-19 in Wuhan, China: a retrospective cohort study. Lancet. 2020;395(10229):1054-1062. doi:10.1016/S0140-6736(20)30566-3
23. Argenziano MG, Bruce SL, Slater CL, et al. Characterization and clinical course of 1000 patients with coronavirus disease 2019 in New York: retrospective case series. BMJ. 2020;369:m1996. doi:10.1136/bmj.m1996
24. Cummings MJ, Baldwin MR, Abrams D, et al. Epidemiology, clinical course, and outcomes of critically ill adults with COVID-19 in New York City: a prospective cohort study. Lancet. 2020;395(10239):1763-1770. doi:10.1016/S0140-6736(20)31189-2
25. Demoule A, Vieillard Baron A, Darmon M, et al. High-flow nasal cannula in critically ill patients with severe COVID-19. Am J Respir Crit Care Med. 2020;202(7):1039-1042. doi:10.1164/rccm.202005-2007LE
26. Hansen CK, Stempek S, Liesching T, Lei Y, Dargin J. Characteristics and outcomes of patients receiving high flow nasal cannula therapy prior to mechanical ventilation in COVID-19 respiratory failure: a prospective observational study. Int J Crit Illn Inj Sci. 2021;11(2):56-60. doi:10.4103/IJCIIS.IJCIIS_181_20
27. van Gerwen M, Alsen M, Little C, et al. Risk factors and outcomes of COVID-19 in New York City; a retrospective cohort study. J Med Virol. 2021;93(2):907-915. doi:10.1002/jmv.26337
28. Hussain Alsayed HA, Saheb Sharif-Askari F, Saheb Sharif-Askari N, Hussain AAS, Hamid Q, Halwani R. Early administration of remdesivir to COVID-19 patients associates with higher recovery rate and lower need for ICU admission: A retrospective cohort study. PLoS One. 2021;16(10):e0258643. doi:10.1371/journal.pone.0258643
29. RECOVERY Collaborative Group, Horby P, Lim WS, et al. Dexamethasone in hospitalized patients with Covid-19. N Engl J Med. 2021;384(8):693-704. doi:10.1056/NEJMoa2021436
30. Rees EM, Nightingale ES, Jafari Y, et al. COVID-19 length of hospital stay: a systematic review and data synthesis. BMC Med. 2020;18(1):270. doi:10.1186/s12916-020-01726-3
31. Anderson M, Bach P, Baldwin MR. Hospital length of stay for severe COVID-19: implications for Remdesivir’s value. medRxiv. 2020;2020.08.10.20171637. doi:10.1101/2020.08.10.20171637
From Lahey Hospital and Medical Center, Burlington, MA (Drs. Liesching and Lei), and Tufts University School of Medicine, Boston, MA (Dr. Liesching)
ABSTRACT
Objective: To compare the utilization of oxygen therapies and clinical outcomes of patients admitted for COVID-19 during the second surge of the pandemic to that of patients admitted during the first surge.
Design: Observational study using a registry database.
Setting: Three hospitals (791 inpatient beds and 76 intensive care unit [ICU] beds) within the Beth Israel Lahey Health system in Massachusetts.
Participants: We included 3183 patients with COVID-19 admitted to hospitals.
Measurements: Baseline data included demographics and comorbidities. Treatments included low-flow supplemental oxygen (2-6 L/min), high-flow oxygen via nasal cannula, and invasive mechanical ventilation. Outcomes included ICU admission, length of stay, ventilator days, and mortality.
Results: A total of 3183 patients were included: 1586 during the first surge and 1597 during the second surge. Compared to the first surge, patients admitted during the second surge had a similar rate of receiving low-flow supplemental oxygen (65.8% vs 64.1%, P = .3), a higher rate of receiving high-flow nasal cannula (15.4% vs 10.8%, P = .0001), and a lower ventilation rate (5.6% vs 9.7%, P < .0001). The outcomes during the second surge were better than those during the first surge: lower ICU admission rate (8.1% vs 12.7%, P < .0001), shorter length of hospital stay (5 vs 6 days, P < .0001), fewer ventilator days (10 vs 16, P = .01), and lower mortality (8.3% vs 19.2%, P < .0001). Among ventilated patients, those who received high-flow nasal cannula had lower mortality.
Conclusion: Compared to the first surge of the COVID-19 pandemic, patients admitted during the second surge had similar likelihood of receiving low-flow supplemental oxygen, were more likely to receive high-flow nasal cannula, were less likely to be ventilated, and had better outcomes.
Keywords: supplemental oxygen, high-flow nasal cannula, ventilator.
The respiratory system receives the major impact of SARS-CoV-2 virus, and hypoxemia has been the predominant diagnosis for patients hospitalized with COVID-19.1,2 During the initial stage of the pandemic, oxygen therapies and mechanical ventilation were the only choices for these patients.3-6 Standard-of-care treatment for patients with COVID-19 during the initial surge included oxygen therapies and mechanical ventilation for hypoxemia and medications for comorbidities and COVID-19–associated sequelae, such as multi-organ dysfunction and failure. A report from New York during the first surge (May 2020) showed that among 5700 hospitalized patients with COVID-19, 27.8% received supplemental oxygen and 12.2% received invasive mechanical ventilation.7 High-flow nasal cannula (HFNC) oxygen delivery has been utilized widely throughout the pandemic due to its superiority over other noninvasive respiratory support techniques.8-12 Mechanical ventilation is always necessary for critically ill patients with acute respiratory distress syndrome. However, ventilator scarcity has become a bottleneck in caring for severely ill patients with COVID-19 during the pandemic.13
The clinical outcomes of hospitalized COVID-19 patients include a high intubation rate, long length of hospital and intensive care unit (ICU) stay, and high mortality.14,15 As the pandemic evolved, new medications, including remdesivir, hydroxychloroquine, lopinavir, or interferon β-1a, were used in addition to the standard of care, but these did not result in significantly different mortality from standard of care.16 Steroids are becoming foundational to the treatment of severe COVID-19 pneumonia, but evidence from high-quality randomized controlled clinical trials is lacking.17
During the first surge from March to May 2020, Massachusetts had the third highest number of COVID-19 cases among states in the United States.18 In early 2021, COVID-19 cases were climbing close to the peak of the second surge in Massachusetts. In this study, we compared utilization of low-flow supplemental oxygen, HFNC, and mechanical ventilation and clinical outcomes of patients admitted to 3 hospitals in Massachusetts during the second surge of the pandemic to that of patients admitted during the first surge.
Methods
Setting
Beth Israel Lahey Health is a system of academic and teaching hospitals with primary care and specialty care providers. We included 3 centers within the Beth Israel Lahey Health system in Massachusetts: Lahey Hospital and Medical Center, with 335 inpatient hospital beds and 52 critical care beds; Beverly Hospital, with 227 beds and 14 critical care beds; and Winchester Hospital, with 229 beds and 10 ICU beds.
Participants
We included patients admitted to the 3 hospitals with COVID-19 as a primary or secondary diagnosis during the first surge of the pandemic (March 1, 2020 to June 15, 2020) and the second surge (November 15, 2020 to January 27, 2021). The timeframe of the first surge was defined as the window between the start date and the end date of data collection. During the time window of the first surge, 1586 patients were included. The start time of the second surge was defined as the date when the data collection was restarted; the end date was set when the number of patients (1597) accumulated was close to the number of patients in the first surge (1586), so that the two groups had similar sample size.
Study Design
A data registry of COVID-19 patients was created by our institution, and the data were prospectively collected starting in March 2020. We retrospectively extracted data on the following from the registry database for this observational study: demographics and baseline comorbidities; the use of low-flow supplemental oxygen, HFNC, and invasive mechanical ventilator; and ICU admission, length of hospital stay, length of ICU stay, and hospital discharge disposition. Start and end times for each oxygen therapy were not entered in the registry. Data about other oxygen therapies, such as noninvasive positive-pressure ventilation, were not collected in the registry database, and therefore were not included in the analysis.
Statistical Analysis
Continuous variables (eg, age) were tested for data distribution normality using the Shapiro-Wilk test. Normally distributed data were tested using unpaired t-tests and displayed as mean (SD). The skewed data were tested using the Wilcoxon rank sum test and displayed as median (interquartile range [IQR]). The categorical variables were compared using chi-square test. Comparisons with P ≤ .05 were considered significantly different. Statistical analysis for this study was generated using Statistical Analysis Software (SAS), version 9.4 for Windows (SAS Institute Inc.).
Results
Baseline Characteristics
We included 3183 patients: 1586 admitted during the first surge and 1597 admitted during the second surge. Baseline characteristics of patients with COVID-19 admitted during the first and second surges are shown in Table 1. Patients admitted during the second surge were older (73 years vs 71 years, P = .01) and had higher rates of hypertension (64.8% vs 59.6%, P = .003) and asthma (12.9% vs 10.7%, P = .049) but a lower rate of interstitial lung disease (3.3% vs 7.7%, P < .001). Sequential organ failure assessment scores at admission and the rates of other comorbidities were not significantly different between the 2 surges.
Oxygen Therapies
The number of patients who were hospitalized and received low-flow supplemental oxygen, and/or HFNC, and/or ventilator in the first surge and the second surge is shown in the Figure. Of all patients included, 2067 (64.9%) received low-flow supplemental oxygen; of these, 374 (18.1%) subsequently received HFNC, and 85 (22.7%) of these subsequently received mechanical ventilation. Of all 3183 patients, 417 (13.1%) received HFNC; 43 of these patients received HFNC without receiving low-flow supplemental oxygen, and 98 (23.5%) subsequently received mechanical ventilation. Out of all 3183 patients, 244 (7.7%) received mechanical ventilation; 98 (40.2%) of these received HFNC while the remaining 146 (59.8%) did not. At the beginning of the first surge, the ratio of patients who received invasive mechanical ventilation to patients who received HFNC was close to 1:1 (10/10); the ratio decreased to 6:10 in May and June 2020. At the beginning of the second surge, the ratio was 8:10 and then decreased to 3:10 in December 2020 and January 2021.
As shown in Table 2, the proportion of patients who received low-flow supplemental oxygen during the second surge was similar to that during the first surge (65.8% vs 64.1%, P = .3). Patients admitted during the second surge were more likely to receive HFNC than patients admitted during the first surge (15.4% vs 10.8%, P = .0001). Patients admitted during the second surge were less likely to be ventilated than the patients admitted during the first surge (5.6% vs 9.7%, P < .0001).
Clinical Outcomes
As shown in Table 3, second surge outcomes were much better than first surge outcomes: the ICU admission rate was lower (8.1% vs 12.7%, P < .0001); patients were more likely to be discharged to home (60.2% vs 47.4%, P < .0001), had a shorter length of hospital stay (5 vs 6 days, P < .0001), and had fewer ventilator days (10 vs 16, P = .01); and mortality was lower (8.3% vs 19.2%, P < .0001). There was a trend that length of ICU stay was shorter during the second surge than during the first surge (7 days vs 9 days, P = .09).
As noted (Figure), the ratio of patients who received invasive mechanical ventilation to patients who received HFNC was decreasing during both the first surge and the second surge. To further analyze the relation between ventilator and HFNC, we performed a subgroup analysis for 244 ventilated patients during both surges to compare outcomes between patients who received HFNC and those who did not receive HFNC (Table 4). Ninety-eight (40%) patients received HFNC. Ventilated patients who received HFNC had lower mortality than those patients who did not receive HFNC (31.6% vs 48%, P = .01), but had a longer length of hospital stay (29 days vs 14 days, P < .0001), longer length of ICU stay (17 days vs 9 days, P < .0001), and a higher number of ventilator days (16 vs 11, P = .001).
Discussion
Our study compared the baseline patient characteristics; utilization of low-flow supplemental oxygen therapy, HFNC, and mechanical ventilation; and clinical outcomes between the first surge (n = 1586) and the second surge (n = 1597) of the COVID-19 pandemic. During both surges, about two-thirds of admitted patients received low-flow supplemental oxygen. A higher proportion of the admitted patients received HFNC during the second surge than during the first surge, while the intubation rate was lower during the second surge than during the first surge.
Reported low-flow supplemental oxygen use ranged from 28% to 63% depending on the cohort characteristics and location during the first surge.6,7,19 A report from New York during the first surge (March 1 to April 4, 2020) showed that among 5700 hospitalized patients with COVID-19, 27.8% received low-flow supplemental oxygen.7 HFNC is recommended in guidelines on management of patients with acute respiratory failure due to COVID-19.20 In our study, HFNC was utilized in a higher proportion of patients admitted for COVID-19 during the second surge (15.5% vs 10.8%, P = .0001). During the early pandemic period in Wuhan, China, 11% to 21% of admitted COVID-19 patients received HFNC.21,22 Utilization of HFNC in New York during the first surge (March to May 2020) varied from 5% to 14.3% of patients admitted with COVID-19.23,24 Our subgroup analysis of the ventilated patients showed that patients who received HFNC had lower mortality than those who did not (31.6% vs 48.0%, P = .011). Comparably, a report from Paris, France, showed that among patients admitted to ICUs for acute hypoxemic respiratory failure, those who received HFNC had lower mortality at day 60 than those who did not (21% vs 31%, P = .052).25 Our recent analysis showed that patients treated with HFNC prior to mechanical ventilation had lower mortality than those treated with only conventional oxygen (30% vs 52%, P = .05).26 In this subgroup analysis, we could not determine if HFNC treatment was administered before or after ventilation because HFNC was entered as dichotomous data (“Yes” or “No”) in the registry database. We merely showed the beneficial effect of HFNC on reducing mortality for ventilated COVID-19 patients, but did not mean to focus on how and when to apply HFNC.
We observed that the patients admitted during the second surge were less likely to be ventilated than the patients admitted during the first surge (5.6% vs 9.7%, P < .0001). During the first surge in New York, among 5700 patients admitted with COVID-19, 12.2% received invasive mechanical ventilation.7 In another report, also from New York during the first surge, 26.1% of 2015 hospitalized COVID-19 patients received mechanical ventilation.27 In our study, the ventilation rate of 9.7% during the first surge was lower.
Outcomes during the second surge were better than during the first surge, including ICU admission rate, hospital and ICU length of stay, ventilator days, and mortality. The mortality was 19.2% during the first surge vs 8.3% during the second surge (P < .0001). The mortality of 19.2% was lower than the 30.6% mortality reported for 2015 hospitalized COVID-19 patients in New York during the first surge.27 A retrospective study showed that early administration of remdesivir was associated with reduced ICU admission, ventilation use, and mortality.28 The RECOVERY clinical trial showed that dexamethasone improved mortality for COVID-19 patients who received respiratory support, but not for patients who did not receive any respiratory support.29 Perhaps some, if not all, of the improvement in ICU admission and mortality during the second surge was attributed to the new medications, such as antivirals and steroids.
The length of hospital stay for patients with moderate to severe COVID-19 varied from 4 to 53 days at different locations of the world, as shown in a meta-analysis by Rees and colleagues.30 Our results showing a length of stay of 6 days during the first surge and 5 days during the second surge fell into the shorter end of this range. In a retrospective analysis of 1643 adults with severe COVID-19 admitted to hospitals in New York City between March 9, 2020 and April 23, 2020, median hospital length of stay was 7 (IQR, 3-14) days.31 For the ventilated patients in our study, the length of stay of 14 days (did not receive HFNC) and 29 days (received HFNC) was much longer. This longer length of stay might be attributed to the patients in our study being older and having more severe comorbidities.
The main purpose of this study was to compare the oxygen therapies and outcomes between 2 surges. It is difficult to associate the clinical outcomes with the oxygen therapies because new therapies and medications were available after the first surge. It was not possible to adjust the outcomes with confounders (other therapies and medications) because the registry data did not include the new therapies and medications.
A strength of this study was that we included a large, balanced number of patients in the first surge and the second surge. We did not plan the sample size in both groups as we could not predict the number of admissions. We set the end date of data collection for analysis as the time when the number of patients admitted during the second surge was similar to the number of patients admitted during the first surge. A limitation was that the registry database was created by the institution and was not designed solely for this study. The data for oxygen therapies were limited to low-flow supplemental oxygen, HFNC, and invasive mechanical ventilation; data for noninvasive ventilation were not included.
Conclusion
At our centers, during the second surge of COVID-19 pandemic, patients hospitalized with COVID-19 infection were more likely to receive HFNC but less likely to be ventilated. Compared to the first surge, the hospitalized patients with COVID-19 infection had a lower ICU admission rate, shorter length of hospital stay, fewer ventilator days, and lower mortality. For ventilated patients, those who received HFNC had lower mortality than those who did not.
Corresponding author: Timothy N. Liesching, MD, 41 Mall Road, Burlington, MA 01805; Timothy.N.Liesching@lahey.org
Disclosures: None reported.
doi:10.12788/jcom.0086
1. Xie J, Covassin N, Fan Z, et al. Association between hypoxemia and mortality in patients with COVID-19. Mayo Clin Proc. 2020;95(6):1138-1147. doi:10.1016/j.mayocp.2020.04.006
2. Asleh R, Asher E, Yagel O, et al. Predictors of hypoxemia and related adverse outcomes in patients hospitalized with COVID-19: a double-center retrospective study. J Clin Med. 2021;10(16):3581. doi:10.3390/jcm10163581
3. Choi KJ, Hong HL, Kim EJ. Association between oxygen saturation/fraction of inhaled oxygen and mortality in patients with COVID-19 associated pneumonia requiring oxygen therapy. Tuberc Respir Dis (Seoul). 2021;84(2):125-133. doi:10.4046/trd.2020.0126
4. Dixit SB. Role of noninvasive oxygen therapy strategies in COVID-19 patients: Where are we going? Indian J Crit Care Med. 2020;24(10):897-898. doi:10.5005/jp-journals-10071-23625
5. Gonzalez-Castro A, Fajardo Campoverde A, Medina A, et al. Non-invasive mechanical ventilation and high-flow oxygen therapy in the COVID-19 pandemic: the value of a draw. Med Intensiva (Engl Ed). 2021;45(5):320-321. doi:10.1016/j.medine.2021.04.001
6. Pan W, Li J, Ou Y, et al. Clinical outcome of standardized oxygen therapy nursing strategy in COVID-19. Ann Palliat Med. 2020;9(4):2171-2177. doi:10.21037/apm-20-1272
7. Richardson S, Hirsch JS, Narasimhan M, et al. Presenting characteristics, comorbidities, and outcomes among 5700 patients hospitalized with COVID-19 in the New York City area. JAMA. 2020;323(20):2052-2059. doi:10.1001/jama.2020.6775
8. He G, Han Y, Fang Q, et al. Clinical experience of high-flow nasal cannula oxygen therapy in severe COVID-19 patients. Article in Chinese. Zhejiang Da Xue Xue Bao Yi Xue Ban. 2020;49(2):232-239. doi:10.3785/j.issn.1008-9292.2020.03.13
9. Lalla U, Allwood BW, Louw EH, et al. The utility of high-flow nasal cannula oxygen therapy in the management of respiratory failure secondary to COVID-19 pneumonia. S Afr Med J. 2020;110(6):12941.
10. Zhang TT, Dai B, Wang W. Should the high-flow nasal oxygen therapy be used or avoided in COVID-19? J Transl Int Med. 2020;8(2):57-58. doi:10.2478/jtim-2020-0018
11. Agarwal A, Basmaji J, Muttalib F, et al. High-flow nasal cannula for acute hypoxemic respiratory failure in patients with COVID-19: systematic reviews of effectiveness and its risks of aerosolization, dispersion, and infection transmission. Can J Anaesth. 2020;67(9):1217-1248. doi:10.1007/s12630-020-01740-2
12. Geng S, Mei Q, Zhu C, et al. High flow nasal cannula is a good treatment option for COVID-19. Heart Lung. 2020;49(5):444-445. doi:10.1016/j.hrtlng.2020.03.018
13. Feinstein MM, Niforatos JD, Hyun I, et al. Considerations for ventilator triage during the COVID-19 pandemic. Lancet Respir Med. 2020;8(6):e53. doi:10.1016/S2213-2600(20)30192-2
14. Wu Z, McGoogan JM. Characteristics of and important lessons from the coronavirus disease 2019 (COVID-19) outbreak in China: summary of a report of 72314 cases from the Chinese Center for Disease Control and Prevention. JAMA. 2020;323(13):1239-1242. doi:10.1001/jama.2020.2648
15. Rojas-Marte G, Hashmi AT, Khalid M, et al. Outcomes in patients with COVID-19 disease and high oxygen requirements. J Clin Med Res. 2021;13(1):26-37. doi:10.14740/jocmr4405
16. Zhang R, Mylonakis E. In inpatients with COVID-19, none of remdesivir, hydroxychloroquine, lopinavir, or interferon β-1a differed from standard care for in-hospital mortality. Ann Intern Med. 2021;174(2):JC17. doi:10.7326/ACPJ202102160-017
17. Rello J, Waterer GW, Bourdiol A, Roquilly A. COVID-19, steroids and other immunomodulators: The jigsaw is not complete. Anaesth Crit Care Pain Med. 2020;39(6):699-701. doi:10.1016/j.accpm.2020.10.011
18. Dargin J, Stempek S, Lei Y, Gray Jr. A, Liesching T. The effect of a tiered provider staffing model on patient outcomes during the coronavirus disease 2019 pandemic: A single-center observational study. Int J Crit Illn Inj Sci. 2021;11(3). doi:10.4103/ijciis.ijciis_37_21
19. Ni YN, Wang T, Liang BM, Liang ZA. The independent factors associated with oxygen therapy in COVID-19 patients under 65 years old. PLoS One. 2021;16(1):e0245690. doi:10.1371/journal.pone.0245690
20. Alhazzani W, Moller MH, Arabi YM, et al. Surviving Sepsis Campaign: guidelines on the management of critically ill adults with coronavirus disease 2019 (COVID-19). Crit Care Med. 2020;48(6):e440-e469. doi:10.1097/CCM.0000000000004363
21. Wang D, Hu B, Hu C, et al. Clinical characteristics of 138 hospitalized patients with 2019 novel coronavirus-infected pneumonia in Wuhan, China. JAMA. 2020;323(11):1061-1069. doi:10.1001/jama.2020.1585
22. Zhou F, Yu T, Du R, et al. Clinical course and risk factors for mortality of adult inpatients with COVID-19 in Wuhan, China: a retrospective cohort study. Lancet. 2020;395(10229):1054-1062. doi:10.1016/S0140-6736(20)30566-3
23. Argenziano MG, Bruce SL, Slater CL, et al. Characterization and clinical course of 1000 patients with coronavirus disease 2019 in New York: retrospective case series. BMJ. 2020;369:m1996. doi:10.1136/bmj.m1996
24. Cummings MJ, Baldwin MR, Abrams D, et al. Epidemiology, clinical course, and outcomes of critically ill adults with COVID-19 in New York City: a prospective cohort study. Lancet. 2020;395(10239):1763-1770. doi:10.1016/S0140-6736(20)31189-2
25. Demoule A, Vieillard Baron A, Darmon M, et al. High-flow nasal cannula in critically ill patients with severe COVID-19. Am J Respir Crit Care Med. 2020;202(7):1039-1042. doi:10.1164/rccm.202005-2007LE
26. Hansen CK, Stempek S, Liesching T, Lei Y, Dargin J. Characteristics and outcomes of patients receiving high flow nasal cannula therapy prior to mechanical ventilation in COVID-19 respiratory failure: a prospective observational study. Int J Crit Illn Inj Sci. 2021;11(2):56-60. doi:10.4103/IJCIIS.IJCIIS_181_20
27. van Gerwen M, Alsen M, Little C, et al. Risk factors and outcomes of COVID-19 in New York City; a retrospective cohort study. J Med Virol. 2021;93(2):907-915. doi:10.1002/jmv.26337
28. Hussain Alsayed HA, Saheb Sharif-Askari F, Saheb Sharif-Askari N, Hussain AAS, Hamid Q, Halwani R. Early administration of remdesivir to COVID-19 patients associates with higher recovery rate and lower need for ICU admission: A retrospective cohort study. PLoS One. 2021;16(10):e0258643. doi:10.1371/journal.pone.0258643
29. RECOVERY Collaborative Group, Horby P, Lim WS, et al. Dexamethasone in hospitalized patients with Covid-19. N Engl J Med. 2021;384(8):693-704. doi:10.1056/NEJMoa2021436
30. Rees EM, Nightingale ES, Jafari Y, et al. COVID-19 length of hospital stay: a systematic review and data synthesis. BMC Med. 2020;18(1):270. doi:10.1186/s12916-020-01726-3
31. Anderson M, Bach P, Baldwin MR. Hospital length of stay for severe COVID-19: implications for Remdesivir’s value. medRxiv. 2020;2020.08.10.20171637. doi:10.1101/2020.08.10.20171637
Using a Real-Time Prediction Algorithm to Improve Sleep in the Hospital
Study Overview
Objective: This study evaluated whether a clinical-decision-support (CDS) tool that utilizes a real-time algorithm incorporating patient vital sign data can identify hospitalized patients who can forgo overnight vital sign checks and thus reduce delirium incidence.
Design: This was a parallel randomized clinical trial of adult inpatients admitted to the general medical service of a tertiary care academic medical center in the United States. The trial intervention consisted of a CDS notification in the electronic health record (EHR) that informed the physician if a patient had a high likelihood of nighttime vital signs within the reference ranges based on a logistic regression model of real-time patient data input. This notification provided the physician an opportunity to discontinue nighttime vital sign checks, dismiss the notification for 1 hour, or dismiss the notification until the next day.
Setting and participants: This clinical trial was conducted at the University of California, San Francisco Medical Center from March 11 to November 24, 2019. Participants included physicians who served on the primary team (eg, attending, resident) of 1699 patients on the general medical service who were outside of the intensive care unit (ICU). The hospital encounters were randomized (allocation ratio of 1:1) to sleep promotion vitals CDS (SPV CDS) intervention or usual care.
Main outcome and measures: The primary outcome was delirium as determined by bedside nurse assessment using the Nursing Delirium Screening Scale (Nu-DESC) recorded once per nursing shift. The Nu-DESC is a standardized delirium screening tool that defines delirium with a score ≥2. Secondary outcomes included sleep opportunity (ie, EHR-based sleep metrics that reflected the maximum time between iatrogenic interruptions, such as nighttime vital sign checks) and patient satisfaction (ie, patient satisfaction measured by standardized Hospital Consumer Assessment of Healthcare Providers and Systems [HCAHPS] survey). Potential balancing outcomes were assessed to ensure that reduced vital sign checks were not causing harms; these included ICU transfers, rapid response calls, and code blue alarms. All analyses were conducted on the basis of intention-to-treat.
Main results: A total of 3025 inpatient encounters were screened and 1930 encounters were randomized (966 SPV CDS intervention; 964 usual care). The randomized encounters consisted of 1699 patients; demographic factors between the 2 trial arms were similar. Specifically, the intervention arm included 566 men (59%) and mean (SD) age was 53 (15) years. The incidence of delirium was similar between the intervention and usual care arms: 108 (11%) vs 123 (13%) (P = .32). Compared to the usual care arm, the intervention arm had a higher mean (SD) number of sleep opportunity hours per night (4.95 [1.45] vs 4.57 [1.30], P < .001) and fewer nighttime vital sign checks (0.97 [0.95] vs 1.41 [0.86], P < .001). The post-discharge HCAHPS survey measuring patient satisfaction was completed by only 5% of patients (53 intervention, 49 usual care), and survey results were similar between the 2 arms (P = .86). In addition, safety outcomes including ICU transfers (49 [5%] vs 47 [5%], P = .92), rapid response calls (68 [7%] vs 55 [6%], P = .27), and code blue alarms (2 [0.2%] vs 9 [0.9%], P = .07) were similar between the study arms.
Conclusion: In this randomized clinical trial, a CDS tool utilizing a real-time prediction algorithm embedded in EHR did not reduce the incidence of delirium in hospitalized patients. However, this SPV CDS intervention helped physicians identify clinically stable patients who can forgo routine nighttime vital sign checks and facilitated greater opportunity for patients to sleep. These findings suggest that augmenting physician judgment using a real-time prediction algorithm can help to improve sleep opportunity without an accompanying increased risk of clinical decompensation during acute care.
Commentary
High-quality sleep is fundamental to health and well-being. Sleep deprivation and disorders are associated with many adverse health outcomes, including increased risks for obesity, diabetes, hypertension, myocardial infarction, and depression.1 In hospitalized patients who are acutely ill, restorative sleep is critical to facilitating recovery. However, poor sleep is exceedingly common in hospitalized patients and is associated with deleterious outcomes, such as high blood pressure, hyperglycemia, and delirium.2,3 Moreover, some of these adverse sleep-induced cardiometabolic outcomes, as well as sleep disruption itself, may persist after hospital discharge.4 Factors that precipitate interrupted sleep during hospitalization include iatrogenic causes such as frequent vital sign checks, nighttime procedures or early morning blood draws, and environmental factors such as loud ambient noise.3 Thus, a potential intervention to improve sleep quality in the hospital is to reduce nighttime interruptions such as frequent vital sign checks.
In the current study, Najafi and colleagues conducted a randomized trial to evaluate whether a CDS tool embedded in EHR, powered by a real-time prediction algorithm of patient data, can be utilized to identify patients in whom vital sign checks can be safely discontinued at nighttime. The authors found a modest but statistically significant reduction in the number of nighttime vital sign checks in patients who underwent the SPV CDS intervention, and a corresponding higher sleep opportunity per night in those who received the intervention. Importantly, this reduction in nighttime vital sign checks did not cause a higher risk of clinical decompensation as measured by ICU transfers, rapid response calls, or code blue alarms. Thus, the results demonstrated the feasibility of using a real-time, patient data-driven CDS tool to augment physician judgment in managing sleep disruption, an important hospital-associated stressor and a common hazard of hospitalization in older patients.
Delirium is a common clinical problem in hospitalized older patients that is associated with prolonged hospitalization, functional and cognitive decline, institutionalization, death, and increased health care costs.5 Despite a potential benefit of SPV CDS intervention in reducing vital sign checks and increasing sleep opportunity, this intervention did not reduce the incidence of delirium in hospitalized patients. This finding is not surprising given that delirium has a multifactorial etiology (eg, metabolic derangements, infections, medication side effects and drug toxicity, hospital environment). A small modification in nighttime vital sign checks and sleep opportunity may have limited impact on optimizing sleep quality and does not address other risk factors for delirium. As such, a multicomponent nonpharmacologic approach that includes sleep enhancement, early mobilization, feeding assistance, fluid repletion, infection prevention, and other interventions should guide delirium prevention in the hospital setting. The SPV CDS intervention may play a role in the delivery of a multifaceted, nonpharmacologic delirium prevention intervention in high-risk individuals.
Sleep disruption is one of the multiple hazards of hospitalization frequently experience by hospitalized older patients. Other hazards, or hospital-associated stressors, include mobility restriction (eg, physical restraints such as urinary catheters and intravenous lines, bed elevation and rails), malnourishment and dehydration (eg, frequent use of no-food-by-mouth order, lack of easy access to hydration), and pain (eg, poor pain control). Extended exposures to these stressors may lead to a maladaptive state called allostatic overload that transiently increases vulnerability to post-hospitalization adverse events, including emergency department use, hospital readmission, or death (ie, post-hospital syndrome).6 Thus, the optimization of sleep during hospitalization in vulnerable patients may have benefits that extend beyond delirium prevention. It is perceivable that a CDS tool embedded in EHR, powered by a real-time prediction algorithm of patient data, may be applied to reduce some of these hazards of hospitalization in addition to improving sleep opportunity.
Applications for Clinical Practice
Findings from the current study indicate that a CDS tool embedded in EHR that utilizes a real-time prediction algorithm of patient data may help to safely improve sleep opportunity in hospitalized patients. The participants in the current study were relatively young (53 [15] years). Given that age is a risk factor for delirium, the effects of this intervention on delirium prevention in the most susceptible population (ie, those over the age of 65) remain unknown and further investigation is warranted. Additional studies are needed to determine whether this approach yields similar results in geriatric patients and improves clinical outcomes.
—Fred Ko, MD
1. Institute of Medicine (US) Committee on Sleep Medicine and Research. Sleep Disorders and Sleep Deprivation: An Unmet Public Health Problem. Colten HR, Altevogt BM, editors. National Academies Press (US); 2006.
2. Pilkington S. Causes and consequences of sleep deprivation in hospitalised patients. Nurs Stand. 2013;27(49):350-342. doi:10.7748/ns2013.08.27.49.35.e7649
3. Stewart NH, Arora VM. Sleep in hospitalized older adults. Sleep Med Clin. 2018;13(1):127-135. doi:10.1016/j.jsmc.2017.09.012
4. Altman MT, Knauert MP, Pisani MA. Sleep disturbance after hospitalization and critical illness: a systematic review. Ann Am Thorac Soc. 2017;14(9):1457-1468. doi:10.1513/AnnalsATS.201702-148SR
5. Oh ES, Fong TG, Hshieh TT, Inouye SK. Delirium in older persons: advances in diagnosis and treatment. JAMA. 2017;318(12):1161-1174. doi:10.1001/jama.2017.12067
6. Goldwater DS, Dharmarajan K, McEwan BS, Krumholz HM. Is posthospital syndrome a result of hospitalization-induced allostatic overload? J Hosp Med. 2018;13(5). doi:10.12788/jhm.2986
Study Overview
Objective: This study evaluated whether a clinical-decision-support (CDS) tool that utilizes a real-time algorithm incorporating patient vital sign data can identify hospitalized patients who can forgo overnight vital sign checks and thus reduce delirium incidence.
Design: This was a parallel randomized clinical trial of adult inpatients admitted to the general medical service of a tertiary care academic medical center in the United States. The trial intervention consisted of a CDS notification in the electronic health record (EHR) that informed the physician if a patient had a high likelihood of nighttime vital signs within the reference ranges based on a logistic regression model of real-time patient data input. This notification provided the physician an opportunity to discontinue nighttime vital sign checks, dismiss the notification for 1 hour, or dismiss the notification until the next day.
Setting and participants: This clinical trial was conducted at the University of California, San Francisco Medical Center from March 11 to November 24, 2019. Participants included physicians who served on the primary team (eg, attending, resident) of 1699 patients on the general medical service who were outside of the intensive care unit (ICU). The hospital encounters were randomized (allocation ratio of 1:1) to sleep promotion vitals CDS (SPV CDS) intervention or usual care.
Main outcome and measures: The primary outcome was delirium as determined by bedside nurse assessment using the Nursing Delirium Screening Scale (Nu-DESC) recorded once per nursing shift. The Nu-DESC is a standardized delirium screening tool that defines delirium with a score ≥2. Secondary outcomes included sleep opportunity (ie, EHR-based sleep metrics that reflected the maximum time between iatrogenic interruptions, such as nighttime vital sign checks) and patient satisfaction (ie, patient satisfaction measured by standardized Hospital Consumer Assessment of Healthcare Providers and Systems [HCAHPS] survey). Potential balancing outcomes were assessed to ensure that reduced vital sign checks were not causing harms; these included ICU transfers, rapid response calls, and code blue alarms. All analyses were conducted on the basis of intention-to-treat.
Main results: A total of 3025 inpatient encounters were screened and 1930 encounters were randomized (966 SPV CDS intervention; 964 usual care). The randomized encounters consisted of 1699 patients; demographic factors between the 2 trial arms were similar. Specifically, the intervention arm included 566 men (59%) and mean (SD) age was 53 (15) years. The incidence of delirium was similar between the intervention and usual care arms: 108 (11%) vs 123 (13%) (P = .32). Compared to the usual care arm, the intervention arm had a higher mean (SD) number of sleep opportunity hours per night (4.95 [1.45] vs 4.57 [1.30], P < .001) and fewer nighttime vital sign checks (0.97 [0.95] vs 1.41 [0.86], P < .001). The post-discharge HCAHPS survey measuring patient satisfaction was completed by only 5% of patients (53 intervention, 49 usual care), and survey results were similar between the 2 arms (P = .86). In addition, safety outcomes including ICU transfers (49 [5%] vs 47 [5%], P = .92), rapid response calls (68 [7%] vs 55 [6%], P = .27), and code blue alarms (2 [0.2%] vs 9 [0.9%], P = .07) were similar between the study arms.
Conclusion: In this randomized clinical trial, a CDS tool utilizing a real-time prediction algorithm embedded in EHR did not reduce the incidence of delirium in hospitalized patients. However, this SPV CDS intervention helped physicians identify clinically stable patients who can forgo routine nighttime vital sign checks and facilitated greater opportunity for patients to sleep. These findings suggest that augmenting physician judgment using a real-time prediction algorithm can help to improve sleep opportunity without an accompanying increased risk of clinical decompensation during acute care.
Commentary
High-quality sleep is fundamental to health and well-being. Sleep deprivation and disorders are associated with many adverse health outcomes, including increased risks for obesity, diabetes, hypertension, myocardial infarction, and depression.1 In hospitalized patients who are acutely ill, restorative sleep is critical to facilitating recovery. However, poor sleep is exceedingly common in hospitalized patients and is associated with deleterious outcomes, such as high blood pressure, hyperglycemia, and delirium.2,3 Moreover, some of these adverse sleep-induced cardiometabolic outcomes, as well as sleep disruption itself, may persist after hospital discharge.4 Factors that precipitate interrupted sleep during hospitalization include iatrogenic causes such as frequent vital sign checks, nighttime procedures or early morning blood draws, and environmental factors such as loud ambient noise.3 Thus, a potential intervention to improve sleep quality in the hospital is to reduce nighttime interruptions such as frequent vital sign checks.
In the current study, Najafi and colleagues conducted a randomized trial to evaluate whether a CDS tool embedded in EHR, powered by a real-time prediction algorithm of patient data, can be utilized to identify patients in whom vital sign checks can be safely discontinued at nighttime. The authors found a modest but statistically significant reduction in the number of nighttime vital sign checks in patients who underwent the SPV CDS intervention, and a corresponding higher sleep opportunity per night in those who received the intervention. Importantly, this reduction in nighttime vital sign checks did not cause a higher risk of clinical decompensation as measured by ICU transfers, rapid response calls, or code blue alarms. Thus, the results demonstrated the feasibility of using a real-time, patient data-driven CDS tool to augment physician judgment in managing sleep disruption, an important hospital-associated stressor and a common hazard of hospitalization in older patients.
Delirium is a common clinical problem in hospitalized older patients that is associated with prolonged hospitalization, functional and cognitive decline, institutionalization, death, and increased health care costs.5 Despite a potential benefit of SPV CDS intervention in reducing vital sign checks and increasing sleep opportunity, this intervention did not reduce the incidence of delirium in hospitalized patients. This finding is not surprising given that delirium has a multifactorial etiology (eg, metabolic derangements, infections, medication side effects and drug toxicity, hospital environment). A small modification in nighttime vital sign checks and sleep opportunity may have limited impact on optimizing sleep quality and does not address other risk factors for delirium. As such, a multicomponent nonpharmacologic approach that includes sleep enhancement, early mobilization, feeding assistance, fluid repletion, infection prevention, and other interventions should guide delirium prevention in the hospital setting. The SPV CDS intervention may play a role in the delivery of a multifaceted, nonpharmacologic delirium prevention intervention in high-risk individuals.
Sleep disruption is one of the multiple hazards of hospitalization frequently experience by hospitalized older patients. Other hazards, or hospital-associated stressors, include mobility restriction (eg, physical restraints such as urinary catheters and intravenous lines, bed elevation and rails), malnourishment and dehydration (eg, frequent use of no-food-by-mouth order, lack of easy access to hydration), and pain (eg, poor pain control). Extended exposures to these stressors may lead to a maladaptive state called allostatic overload that transiently increases vulnerability to post-hospitalization adverse events, including emergency department use, hospital readmission, or death (ie, post-hospital syndrome).6 Thus, the optimization of sleep during hospitalization in vulnerable patients may have benefits that extend beyond delirium prevention. It is perceivable that a CDS tool embedded in EHR, powered by a real-time prediction algorithm of patient data, may be applied to reduce some of these hazards of hospitalization in addition to improving sleep opportunity.
Applications for Clinical Practice
Findings from the current study indicate that a CDS tool embedded in EHR that utilizes a real-time prediction algorithm of patient data may help to safely improve sleep opportunity in hospitalized patients. The participants in the current study were relatively young (53 [15] years). Given that age is a risk factor for delirium, the effects of this intervention on delirium prevention in the most susceptible population (ie, those over the age of 65) remain unknown and further investigation is warranted. Additional studies are needed to determine whether this approach yields similar results in geriatric patients and improves clinical outcomes.
—Fred Ko, MD
1. Institute of Medicine (US) Committee on Sleep Medicine and Research. Sleep Disorders and Sleep Deprivation: An Unmet Public Health Problem. Colten HR, Altevogt BM, editors. National Academies Press (US); 2006.
2. Pilkington S. Causes and consequences of sleep deprivation in hospitalised patients. Nurs Stand. 2013;27(49):350-342. doi:10.7748/ns2013.08.27.49.35.e7649
3. Stewart NH, Arora VM. Sleep in hospitalized older adults. Sleep Med Clin. 2018;13(1):127-135. doi:10.1016/j.jsmc.2017.09.012
4. Altman MT, Knauert MP, Pisani MA. Sleep disturbance after hospitalization and critical illness: a systematic review. Ann Am Thorac Soc. 2017;14(9):1457-1468. doi:10.1513/AnnalsATS.201702-148SR
5. Oh ES, Fong TG, Hshieh TT, Inouye SK. Delirium in older persons: advances in diagnosis and treatment. JAMA. 2017;318(12):1161-1174. doi:10.1001/jama.2017.12067
6. Goldwater DS, Dharmarajan K, McEwan BS, Krumholz HM. Is posthospital syndrome a result of hospitalization-induced allostatic overload? J Hosp Med. 2018;13(5). doi:10.12788/jhm.2986
Early Hospital Discharge Following PCI for Patients With STEMI
Study Overview
Objective: To assess the safety and efficacy of early hospital discharge (EHD) for selected low-risk patients with ST-segment elevation myocardial infarction (STEMI) after primary percutaneous coronary intervention (PCI).
Design: Single-center retrospective analysis of prospectively collected data.
Setting and participants: An EHD group comprised of 600 patients who were discharged at <48 hours between April 2020 and June 2021 was compared to a control group of 700 patients who met EHD criteria but were discharged at >48 hour between October 2018 and June 2021. Patients were selected into the EHD group based on the following criteria, in accordance with recommendations from the European Society of Cardiology, and all patients had close follow-up with a combination of structured telephone follow-up at 48 hours post discharge and virtual visits at 2, 6, and 8 weeks and at 3 months:
- Left ventricular ejection fraction ≥40%
- Successful primary PCI (that achieved thrombolysis in myocardial infarction flow grade 3)
- Absence of severe nonculprit disease requiring further inpatient revascularization
- Absence of ischemic symptoms post PCI
- Absence of heart failure or hemodynamic instability
- Absence of significant arrhythmia (ventricular fibrillation, ventricular tachycardia, or atrial fibrillation or atrial flutter requiring prolonged stay)
- Mobility with suitable social circumstances for discharge
Main outcome measures: The outcomes measured were length of hospitalization and a composite primary endpoint of cardiovascular mortality and major adverse cardiovascular event (MACE) rates, defined as a composite of all-cause mortality, recurrent MI, and target lesion revascularization.
Main results: The median length of stay of hospitalization in the EHD group was 24.6 hours compared to 56.1 hours in the >48-hour historical control group. On median follow-up of 271 days, the EHD group demonstrated 0% cardiovascular mortality and a MACE rate of 1.2%. This was shown to be noninferior compared to the >48-hour historical control group, which had mortality of 0.7% and a MACE rate of 1.9%.
Conclusion: Selected low-risk STEMI patients can be safely discharged early with appropriate follow-up after primary PCI.
Commentary
Patients with STEMI have a higher risk of postprocedural adverse events such as MI, arrhythmia, or acute heart failure compared to patients with stable ischemic heart disease, and thus are monitored after primary PCI. Although patients were traditionally monitored for 5 to 7 days a few decades ago,1 with improvements in PCI techniques, devices, and pharmacotherapy as well as in door-to-balloon time, the in-hospital complication rates for patients with STEMI have been decreasing, leading to earlier discharge. Currently in the United States, patients are most commonly monitored for 48 to 72 hours post PCI.2 The current guidelines support this practice, recommending early discharge within 48 to 72 hours in selected low-risk patients if adequate follow-up and rehabilitation are arranged.3
Given the COVID-19 pandemic and decreased hospital bed availability, Rathod et al took one step further on the question of whether low-risk STEMI patients with primary PCI can be discharged safely within 48 hours with adequate follow-up. They found that at a median follow-up of 271 days, EHD patients had 2 COVID-related deaths, with 0% cardiovascular mortality and a MACE rate of 1.2%, including deaths, MI, and ischemic revascularization. The median time to discharge was 25 hours. This was noninferior to the >48-hour historical control group, which had mortality of 0.7% (P = 0.349) and a MACE rate of 1.9% (P = .674). The results remained similar after propensity matching for mortality (0.34% vs 0.69%, P = .410) or MACE (1.2% vs 1.9%, P = .342).
This is the first prospective study to systematically assess the safety and feasibility of discharge of low-risk STEMI patients with primary PCI within 48 hours. This study is unique in that it involved the use of telemedicine, including a virtual platform to collect data such as heart rate, blood pressure, and blood glucose, and virtual visits to facilitate follow-up and reduce clinic travel, cost, and potential COVID-19 exposure. The investigators’ protocol included virtual follow-up by cardiology advanced practitioners at 2, 6, and 8 weeks and by an interventional cardiologist at 12 weeks. This protocol led to an increase in patient satisfaction. The study’s main limitation is that it is a single-center trial with a smaller sample size. Further studies are necessary to confirm the safety and feasibility of this approach. In addition, further refinement of the patient selection criteria for EHD should be considered.
Applications for Clinical Practice
In low-risk STEMI patients after primary PCI, discharge within 48 hours may be considered if close follow-up is arranged. However, further studies are necessary to confirm this finding.
—Thai Nguyen, MD, Albert Chan, MD, and Taishi Hirai MD
1. Grines CL, Marsalese DL, Brodie B, et al. Safety and cost-effectiveness of early discharge after primary angioplasty in low risk patients with acute myocardial infarction. PAMI-II Investigators. Primary Angioplasty in Myocardial Infarction. J Am Coll Cardiol. 1998;31:967-72. doi:10.1016/s0735-1097(98)00031-x
2. Seto AH, Shroff A, Abu-Fadel M, et al. Length of stay following percutaneous coronary intervention: An expert consensus document update from the society for cardiovascular angiography and interventions. Catheter Cardiovasc Interv. 2018;92:717-731. doi:10.1002/ccd.27637
3. Ibanez B, James S, Agewall S, et al. 2017 ESC Guidelines for the management of acute myocardial infarction in patients presenting with ST-segment elevation. Eur Heart J. 2018;39:119-177. doi:10.1093/eurheartj/ehx393
Study Overview
Objective: To assess the safety and efficacy of early hospital discharge (EHD) for selected low-risk patients with ST-segment elevation myocardial infarction (STEMI) after primary percutaneous coronary intervention (PCI).
Design: Single-center retrospective analysis of prospectively collected data.
Setting and participants: An EHD group comprised of 600 patients who were discharged at <48 hours between April 2020 and June 2021 was compared to a control group of 700 patients who met EHD criteria but were discharged at >48 hour between October 2018 and June 2021. Patients were selected into the EHD group based on the following criteria, in accordance with recommendations from the European Society of Cardiology, and all patients had close follow-up with a combination of structured telephone follow-up at 48 hours post discharge and virtual visits at 2, 6, and 8 weeks and at 3 months:
- Left ventricular ejection fraction ≥40%
- Successful primary PCI (that achieved thrombolysis in myocardial infarction flow grade 3)
- Absence of severe nonculprit disease requiring further inpatient revascularization
- Absence of ischemic symptoms post PCI
- Absence of heart failure or hemodynamic instability
- Absence of significant arrhythmia (ventricular fibrillation, ventricular tachycardia, or atrial fibrillation or atrial flutter requiring prolonged stay)
- Mobility with suitable social circumstances for discharge
Main outcome measures: The outcomes measured were length of hospitalization and a composite primary endpoint of cardiovascular mortality and major adverse cardiovascular event (MACE) rates, defined as a composite of all-cause mortality, recurrent MI, and target lesion revascularization.
Main results: The median length of stay of hospitalization in the EHD group was 24.6 hours compared to 56.1 hours in the >48-hour historical control group. On median follow-up of 271 days, the EHD group demonstrated 0% cardiovascular mortality and a MACE rate of 1.2%. This was shown to be noninferior compared to the >48-hour historical control group, which had mortality of 0.7% and a MACE rate of 1.9%.
Conclusion: Selected low-risk STEMI patients can be safely discharged early with appropriate follow-up after primary PCI.
Commentary
Patients with STEMI have a higher risk of postprocedural adverse events such as MI, arrhythmia, or acute heart failure compared to patients with stable ischemic heart disease, and thus are monitored after primary PCI. Although patients were traditionally monitored for 5 to 7 days a few decades ago,1 with improvements in PCI techniques, devices, and pharmacotherapy as well as in door-to-balloon time, the in-hospital complication rates for patients with STEMI have been decreasing, leading to earlier discharge. Currently in the United States, patients are most commonly monitored for 48 to 72 hours post PCI.2 The current guidelines support this practice, recommending early discharge within 48 to 72 hours in selected low-risk patients if adequate follow-up and rehabilitation are arranged.3
Given the COVID-19 pandemic and decreased hospital bed availability, Rathod et al took one step further on the question of whether low-risk STEMI patients with primary PCI can be discharged safely within 48 hours with adequate follow-up. They found that at a median follow-up of 271 days, EHD patients had 2 COVID-related deaths, with 0% cardiovascular mortality and a MACE rate of 1.2%, including deaths, MI, and ischemic revascularization. The median time to discharge was 25 hours. This was noninferior to the >48-hour historical control group, which had mortality of 0.7% (P = 0.349) and a MACE rate of 1.9% (P = .674). The results remained similar after propensity matching for mortality (0.34% vs 0.69%, P = .410) or MACE (1.2% vs 1.9%, P = .342).
This is the first prospective study to systematically assess the safety and feasibility of discharge of low-risk STEMI patients with primary PCI within 48 hours. This study is unique in that it involved the use of telemedicine, including a virtual platform to collect data such as heart rate, blood pressure, and blood glucose, and virtual visits to facilitate follow-up and reduce clinic travel, cost, and potential COVID-19 exposure. The investigators’ protocol included virtual follow-up by cardiology advanced practitioners at 2, 6, and 8 weeks and by an interventional cardiologist at 12 weeks. This protocol led to an increase in patient satisfaction. The study’s main limitation is that it is a single-center trial with a smaller sample size. Further studies are necessary to confirm the safety and feasibility of this approach. In addition, further refinement of the patient selection criteria for EHD should be considered.
Applications for Clinical Practice
In low-risk STEMI patients after primary PCI, discharge within 48 hours may be considered if close follow-up is arranged. However, further studies are necessary to confirm this finding.
—Thai Nguyen, MD, Albert Chan, MD, and Taishi Hirai MD
1. Grines CL, Marsalese DL, Brodie B, et al. Safety and cost-effectiveness of early discharge after primary angioplasty in low risk patients with acute myocardial infarction. PAMI-II Investigators. Primary Angioplasty in Myocardial Infarction. J Am Coll Cardiol. 1998;31:967-72. doi:10.1016/s0735-1097(98)00031-x
2. Seto AH, Shroff A, Abu-Fadel M, et al. Length of stay following percutaneous coronary intervention: An expert consensus document update from the society for cardiovascular angiography and interventions. Catheter Cardiovasc Interv. 2018;92:717-731. doi:10.1002/ccd.27637
3. Ibanez B, James S, Agewall S, et al. 2017 ESC Guidelines for the management of acute myocardial infarction in patients presenting with ST-segment elevation. Eur Heart J. 2018;39:119-177. doi:10.1093/eurheartj/ehx393
Characterizing Opioid Response in Older Veterans in the Post-Acute Setting
Older adults admitted to post-acute settings frequently have complex rehabilitation needs and multimorbidity, which predisposes them to pain management challenges.1,2 The prevalence of pain in post-acute and long-term care is as high as 65%, and opioid use is common among this population with 1 in 7 residents receiving long-term opioids.3,4
Opioids that do not adequately control pain represent a missed opportunity for deprescribing. There is limited evidence regarding efficacy of long-term opioid use (> 90 days) for improving pain and physical functioning.5 In addition, long-term opioid use carries significant risks, including overdose-related death, dependence, and increased emergency department visits.5 These risks are likely to be pronounced among veterans receiving post-acute care (PAC) who are older, have comorbid psychiatric disorders, are prescribed several centrally acting medications, and experience substance use disorder (SUD).6
Older adults are at increased risk for opioid toxicity because of reduced drug clearance and smaller therapeutic window.5 Centers for Disease Control and Prevention (CDC) guidelines recommend frequently assessing patients for benefit in terms of sustained improvement in pain as well as physical function.5 If pain and functional improvements are minimal, opioid use and nonopioid pain management strategies should be considered. Some patients will struggle with this approach. Directly asking patients about the effectiveness of opioids is challenging. Opioid users with chronic pain frequently report problems with opioids even as they describe them as indispensable for pain management.7,8
Earlier studies have assessed patient perspectives regarding opioid difficulties as well as their helpfulness, which could introduce recall bias. Patient-level factors that contribute to a global sense of distress, in addition to the presence of painful physical conditions, also could contribute to patients requesting opioids without experiencing adequate pain relief. One study in veterans residing in PAC facilities found that individuals with depression, posttraumatic stress disorder (PTSD), and SUD were more likely to report pain and receive scheduled analgesics; this effect persisted in individuals with PTSD even after adjusting for demographic and functional status variables.9 The study looked only at analgesics as a class and did not examine opioids specifically. It is possible that distressed individuals, such as those with uncontrolled depression, PTSD, and SUD, might be more likely to report high pain levels and receive opioids with inadequate benefit and increased risk. Identifying the primary condition causing distress and targeting treatment to that condition (ie, depression) is preferable to escalating opioids in an attempt to treat pain in the context of nonresponse. Assessing an individual’s aggregate response to opioids rather than relying on a single self-report is a useful addition to current pain management strategies.
The goal of this study was to pilot a method of identifying opioid-nonresponsive pain using administrative data, measure its prevalence in a PAC population of veterans, and explore clinical and demographic correlates with particular attention to variates that could indicate high levels of psychological and physical distress. Identifying pain that is poorly responsive to opioids would give clinicians the opportunity to avoid or minimize opioid use and prioritize treatments that are likely to improve the resident’s pain, quality of life, and physical function while minimizing recall bias. We hypothesized that pain that responds poorly to opioids would be prevalent among veterans residing in a PAC unit. We considered that veterans with pain poorly responsive to opioids would be more likely to have factors that would place them at increased risk of adverse effects, such as comorbid psychiatric conditions, history of SUD, and multimorbidity, providing further rationale for clinical equipoise in that population.6
Methods
This was a small, retrospective cross-sectional study using administrative data and chart review. The study included veterans who were administered opioids while residing in a single US Department of Veterans Affairs (VA) community living center PAC (CLC-PAC) unit during at least 1 of 4 nonconsecutive, random days in 2016 and 2017. The study was approved by the institutional review board of the Ann Arbor VA Health System (#2017-1034) as part of a larger project involving models of care in vulnerable older veterans.
Inclusion criteria were the presence of at least moderate pain (≥ 4 on a 0 to 10 scale); receiving ≥ 2 opioids ordered as needed over the prespecified 24-hour observation period; and having ≥ 2 pre-and postopioid administration pain scores during the observation period. Veterans who did not meet these criteria were excluded. At the time of initial sample selection, we did not capture information related to coprescribed analgesics, including a standing order of opioids. To obtain the sample, we initially characterized all veterans on the 4 days residing in the CLC-PAC unit as those reporting at least moderate pain (≥ 4) and those who reported no or mild pain (< 4). The cut point of 4 of 10 is consistent with moderate pain based on earlier work showing higher likelihood of pain that interferes with physical function.10 We then restricted the sample to veterans who received ≥ 2 opioids ordered as needed for pain and had ≥ 2 pre- and postopioid administration numeric pain rating scores during the 24-hour observation period. This methodology was chosen to enrich our sample for those who received opioids regularly for ongoing pain. Opioids were defined as full µ-opioid receptor agonists and included hydrocodone, oxycodone, morphine, hydromorphone, fentanyl, tramadol, and methadone.
Medication administration data were obtained from the VA corporate data warehouse, which houses all barcode medication administration data collected at the point of care. The dataset includes pain scores gathered by nursing staff before and after administering an as-needed analgesic. The corporate data warehouse records data/time of pain scores and the analgesic name, dosage, formulation, and date/time of administration. Using a standardized assessment form developed iteratively, we calculated opioid dosage in oral morphine equivalents (OME) for comparison.11,12 All abstracted data were reexamined for accuracy. Data initially were collected in an anonymized, blinded fashion. Participants were then unblinded for chart review. Initial data was captured in resident-days instead of unique residents because an individual resident might have been admitted on several observation days. We were primarily interested in how pain responded to opioids administered in response to resident request; therefore, we did not examine response to opioids that were continuously ordered (ie, scheduled). We did consider scheduled opioids when calculating total daily opioid dosage during the chart review.
Outcome of Interest
The primary outcome of interest was an individual’s response to as-needed opioids, which we defined as change in the pain score after opioid administration. The pre-opioid pain score was the score that immediately preceded administration of an as-needed opioid. The postopioid administration pain score was the first score after opioid administration if obtained within 3 hours of administration. Scores collected > 3 hours after opioid administration were excluded because they no longer accurately reflected the impact of the opioid due to the short half-lives. Observations were excluded if an opioid was administered without a recorded pain score; this occurred once for 6 individuals. Observations also were excluded if an opioid was administered but the data were captured on the following day (outside of the 24-hour window); this occurred once for 3 individuals.
We calculated a ∆ score by subtracting the postopioid pain rating score from the pre-opioid score. Individual ∆ scores were then averaged over the 24-hour period (range, 2-5 opioid doses). For example, if an individual reported a pre-opioid pain score of 10, and a postopioid pain score of 2, the ∆ was recorded as 8. If the individual’s next pre-opioid score was 10, and post-opioid score was 6, the ∆ was recorded as 4. ∆ scores over the 24-hour period were averaged together to determine that individual’s response to as-needed opioids. In the previous example, the mean ∆ score is 6. Lower mean ∆ scores reflect decreased responsiveness to opioids’ analgesic effect.
Demographic and clinical data were obtained from electronic health record review using a standardized assessment form. These data included information about medical and psychiatric comorbidities, specialist consultations, and CLC-PAC unit admission indications and diagnoses. Medications of interest were categorized as antidepressants, antipsychotics, benzodiazepines, muscle relaxants, hypnotics, stimulants, antiepileptic drugs/mood stabilizers (including gabapentin and pregabalin), and all adjuvant analgesics. Adjuvant analgesics were defined as medications administered for pain as documented by chart notes or those ordered as needed for pain, and analyzed as a composite variable. Antidepressants with analgesic properties (serotonin-norepinephrine reuptake inhibitors and tricyclic antidepressants) were considered adjuvant analgesics. Psychiatric information collected included presence of mood, anxiety, and psychotic disorders, and PTSD. SUD information was collected separately from other psychiatric disorders.
Analyses
The study population was described using tabulations for categorical data and means and standard deviations for continuous data. Responsiveness to opioids was analyzed as a continuous variable. Those with higher mean ∆ scores were considered to have pain relatively more responsive to opioids, while lower mean ∆ scores indicated pain less responsive to opioids. We constructed linear regression models controlling for average pre-opioid pain rating scores to explore associations between opioid responsiveness and variables of interest. All analyses were completed using Stata version 15. This study was not adequately powered to detect differences across the spectrum of opioid responsiveness, although the authors have reported differences in this article.
Results
Over the 4-day observational period there were 146 resident-days. Of these, 88 (60.3%) reported at least 1 pain score of ≥ 4. Of those, 61 (41.8%) received ≥ 1 as-needed opioid for pain. We identified 46 resident-days meeting study criteria of ≥ 2 pre- and postanalgesic scores. We identified 41 unique individuals (Figure 1). Two individuals were admitted to the CLC-PAC unit on 2 of the 4 observation days, and 1 individual was admitted to the CLC-PAC unit on 3 of the 4 observation days. For individuals admitted several days, we included data only from the initial observation day.
Response to opioids varied greatly in this sample. The mean (SD) ∆ pain score was 3.4 (1.6) and ranged from 0.5 to 6.3. Using linear regression, we found no relationship between admission indication, medical comorbidities (including active cancer), and opioid responsiveness (Table).
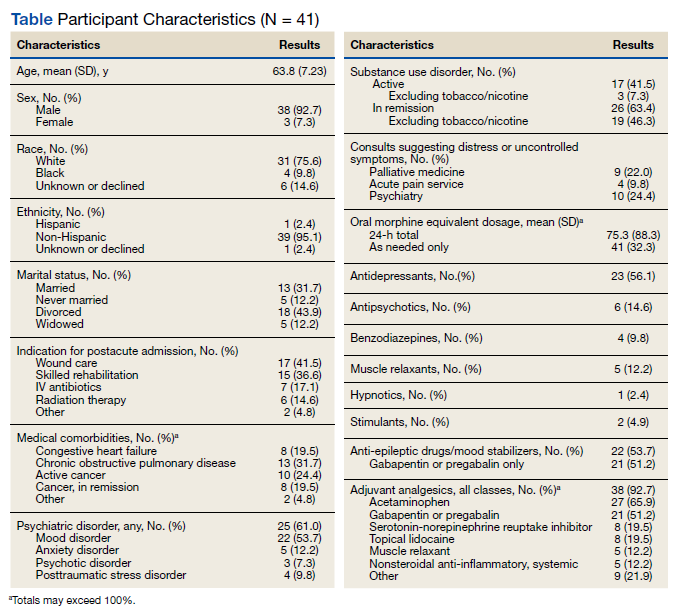
Psychiatric disorders were highly prevalent, with 25 individuals (61.0%) having ≥ 1 any psychiatric diagnosis identified on chart review. The presence of any psychiatric diagnosis was significantly associated with reduced responsiveness to opioids (β = −1.08; 95% CI, −2.04 to −0.13; P = .03). SUDs also were common, with 17 individuals (41.5%) having an active SUD; most were tobacco/nicotine. Twenty-six veterans (63.4%) had documentation of SUD in remission with 19 (46.3%) for substances other than tobacco/nicotine. There was no indication that any veteran in the sample was prescribed medication for opioid use disorder (OUD) at the time of observation. There was no relationship between opioid responsiveness and SUDs, neither active or in remission. Consults to other services that suggested distress or difficult-to-control symptoms also were frequent. Consults to the pain service were significantly associated with reduced responsiveness to opioids (β = −1.75; 95% CI, −3.33 to −0.17; P = .03). Association between psychiatry consultation and reduced opioid responsiveness trended toward significance (β = −0.95; 95% CI, −2.06 to 0.17; P = .09) (Figures 2 and 3). There was no significant association with palliative medicine consultation and opioid responsiveness.
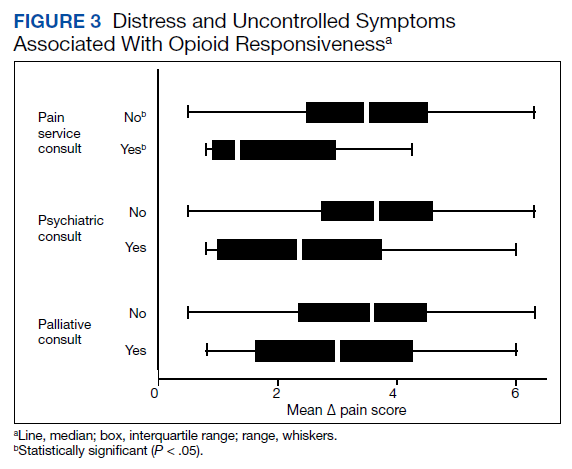
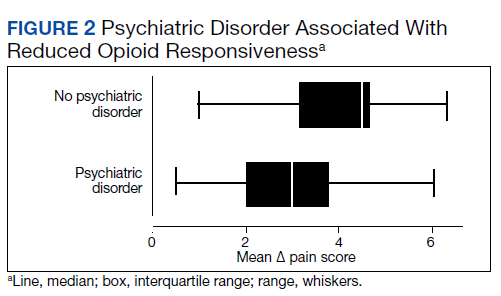
A poorer response to opioids was associated with a significantly higher as-needed opioid dosage (β = −0.02; 95% CI, −0.04 to −0.01; P = .002) as well as a trend toward higher total opioid dosage (β = −0.005; 95% CI, −0.01 to 0.0003; P = .06) (Figure 4). Thirty-eight (92.7%) participants received nonopioid adjuvant analgesics for pain. More than half (56.1%) received antidepressants or gabapentinoids (51.2%), although we did not assess whether they were prescribed for pain or another indication. We did not identify a relationship between any specific psychoactive drug class and opioid responsiveness in this sample.
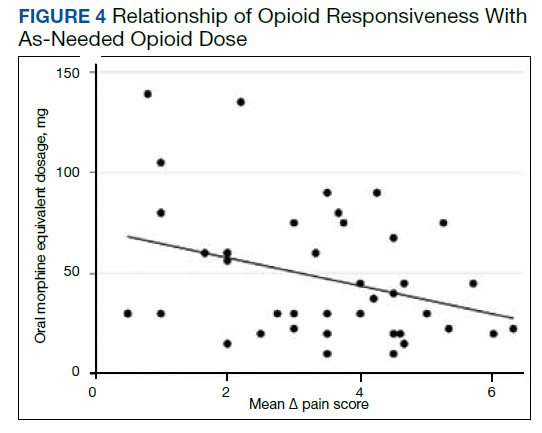
Discussion
This exploratory study used readily available administrative data in a CLC-PAC unit to assess responsiveness to opioids via a numeric mean ∆ score, with higher values indicating more pain relief in response to opioids. We then constructed linear regression models to characterize the relationship between the mean ∆ score and factors known to be associated with difficult-to-control pain and psychosocial distress. As expected, opioid responsiveness was highly variable among residents; some residents experienced essentially no reduction in pain, on average, despite receiving opioids. Psychiatric comorbidity, higher dosage in OMEs, and the presence of a pain service consult significantly correlated with poorer response to opioids. To our knowledge, this is the first study to quantify opioid responsiveness and describe the relationship with clinical correlates in the understudied PAC population.
Earlier research has demonstrated a relationship between the presence of psychiatric disorders and increased likelihood of receiving any analgesics among veterans residing in PAC.9 Our study adds to the literature by quantifying opioid response using readily available administrative data and examining associations with psychiatric diagnoses. These findings highlight the possibility that attempting to treat high levels of pain by escalating the opioid dosage in patients with a comorbid psychiatric diagnosis should be re-addressed, particularly if there is no meaningful pain reduction at lower opioid dosages. Our sample had a variety of admission diagnoses and medical comorbidities, however, we did not identify a relationship with opioid responsiveness, including an active cancer diagnosis. Although SUDs were highly prevalent in our sample, there was no relationship with opioid responsiveness. This suggests that lack of response to opioids is not merely a matter of drug tolerance or an indication of drug-seeking behavior.
Factors Impacting Response
Many factors could affect whether an individual obtains an adequate analgesic response to opioids or other pain medications, including variations in genes encoding opioid receptors and hepatic enzymes involved in drug metabolism and an individual’s opioid exposure history.13 The phenomenon of requiring more drug to produce the same relief after repeated exposures (ie, tolerance) is well known.14 Opioid-induced hyperalgesia is a phenomenon whereby a patient’s overall pain increases while receiving opioids, but each opioid dose might be perceived as beneficial.15 Increasingly, psychosocial distress is an important factor in opioid response. Adverse selection is the process culminating in those with psychosocial distress and/or SUDs being prescribed more opioids for longer durations.16 Our data suggests that this process could play a role in PAC settings. In addition, exaggerating pain to obtain additional opioids for nonmedical purposes, such as euphoria or relaxation, also is possible.17
When clinically assessing an individual whose pain is not well controlled despite escalating opioid dosages, prescribers must consider which of these factors likely is predominant. However, the first step of determining who has a poor opioid response is not straightforward. Directly asking patients is challenging; many individuals perceive opioids to be helpful while simultaneously reporting inadequately controlled pain.7,8 The primary value of this study is the possibility of providing prescribers a quick, simple method of assessing a patient’s response to opioids. Using this method, individuals who are responding poorly to opioids, including those who might exaggerate pain for secondary gain, could be identified. Health care professionals could consider revisiting pain management strategies, assess for the presence of OUD, or evaluate other contributors to inadequately controlled pain. Although we only collected data regarding response to opioids in this study, any pain medication administered as needed (ie, nonsteroidal anti-inflammatory drugs, acetaminophen) could be analyzed using this methodology, allowing identification of other helpful pain management strategies. We began the validation process with extensive chart review, but further validation is required before this method can be applied to routine clinical practice.
Patients who report uncontrolled pain despite receiving opioids are a clinically challenging population. The traditional strategy has been to escalate opioids, which is recommended by the World Health Organization stepladder approach for patients with cancer pain and limited life expectancy.18 Applying this approach to a general population of patients with chronic pain is ineffective and dangerous.19 The CDC and the VA/US Department of Defense (VA/DoD) guidelines both recommend carefully reassessing risks and benefits at total daily dosages > 50 OME and avoid increasing dosages to > 90 OME daily in most circumstances.5,20 Our finding that participants taking higher dosages of opioids were not more likely to have better control over their pain supports this recommendation.
Limitations
This study has several limitations, the most significant is its small sample size because of the exploratory nature of the project. Results are based on a small pilot sample enriched to include individuals with at least moderate pain who receive opioids frequently at 1 VA CLC-PAC unit; therefore, the results might not be representative of all veterans or a more general population. Our small sample size limits power to detect small differences. Data collected should be used to inform formal power calculations before subsequent larger studies to select adequate sample size. Validation studies, including samples from the same population using different dates, which reproduce findings are an important step. Moreover, we only had data on a single dimension of pain (intensity/severity), as measured by the pain scale, which nursing staff used to make a real-time clinical decision of whether to administer an as-needed opioid. Future studies should consider using pain measures that provide multidimensional assessment (ie, severity, functional interference) and/or were developed specifically for veterans, such as the Defense and Veterans Pain Rating Scale.21
Our study was cross-sectional in nature and addressed a single 24-hour period of data per participant. The years of data collection (2016 and 2017) followed a decline in overall opioid prescribing that has continued, likely influenced by CDC and VA/DoD guidelines.22 It is unclear whether our observations are an accurate reflection of individuals’ response over time or whether prescribing practices in PAC have shifted.
We did not consider the type of pain being treated or explore clinicians’ reasons for prescribing opioids, therefore limiting our ability to know whether opioids were indicated. Information regarding OUD and other SUDs was limited to what was documented in the chart during the CLC-PAC unit admission. We did not have information on length of exposure to opioids. It is possible that opioid tolerance could play a role in reducing opioid responsiveness. However, simple tolerance would not be expected to explain robust correlations with psychiatric comorbidities. Also, simple tolerance would be expected to be overcome with higher opioid dosages, whereas our study demonstrates less responsiveness. These data suggests that some individuals’ pain might be poorly opioid responsive, and psychiatric factors could increase this risk. We used a novel data source in combination with chart review; to our knowledge, barcode medication administration data have not been used in this manner previously. Future work needs to validate this method, using larger sample sizes and several clinical sites. Finally, we used regression models that controlled for average pre-opioid pain rating scores, which is only 1 covariate important for examining effects. Larger studies with adequate power should control for multiple covariates known to be associated with pain and opioid response.
Conclusions
Opioid responsiveness is important clinically yet challenging to assess. This pilot study identifies a way of classifying pain as relatively opioid nonresponsive using administrative data but requires further validation before considering scaling for more general use. The possibility that a substantial percentage of residents in a CLC-PAC unit could be receiving increasing dosages of opioids without adequate benefit justifies the need for more research and underscores the need for prescribers to assess individuals frequently for ongoing benefit of opioids regardless of diagnosis or mechanism of pain.
Acknowledgments
The authors thank Andrzej Galecki, Corey Powell, and the University of Michigan Consulting for Statistics, Computing and Analytics Research Center for assistance with statistical analysis.
1. Marshall TL, Reinhardt JP. Pain management in the last 6 months of life: predictors of opioid and non-opioid use. J Am Med Dir Assoc. 2019;20(6):789-790. doi:10.1016/j.jamda.2019.02.026
2. Tait RC, Chibnall JT. Pain in older subacute care patients: associations with clinical status and treatment. Pain Med. 2002;3(3):231-239. doi:10.1046/j.1526-4637.2002.02031.x
3. Pimentel CB, Briesacher BA, Gurwitz JH, Rosen AB, Pimentel MT, Lapane KL. Pain management in nursing home residents with cancer. J Am Geriatr Soc. 2015;63(4):633-641. doi:10.1111/jgs.13345
4. Hunnicutt JN, Tjia J, Lapane KL. Hospice use and pain management in elderly nursing home residents with cancer. J Pain Symptom Manage. 2017;53(3):561-570. doi:10.1016/j.jpainsymman.2016.10.369
5. Dowell D, Haegerich TM, Chou R. CDC guideline for prescribing opioids for chronic pain — United States, 2016. MMWR Recomm Rep. 2016;65(No. RR-1):1-49. doi:10.15585/mmwr.rr6501e1
6. Oliva EM, Bowe T, Tavakoli S, et al. Development and applications of the Veterans Health Administration’s Stratification Tool for Opioid Risk Mitigation (STORM) to improve opioid safety and prevent overdose and suicide. Psychol Serv. 2017;14(1):34-49. doi:10.1037/ser0000099
7. Goesling J, Moser SE, Lin LA, Hassett AL, Wasserman RA, Brummett CM. Discrepancies between perceived benefit of opioids and self-reported patient outcomes. Pain Med. 2018;19(2):297-306. doi:10.1093/pm/pnw263
8. Sullivan M, Von Korff M, Banta-Green C. Problems and concerns of patients receiving chronic opioid therapy for chronic non-cancer pain. Pain. 2010;149(2):345-353. doi:10.1016/j.pain.2010.02.037
9. Brennan PL, Greenbaum MA, Lemke S, Schutte KK. Mental health disorder, pain, and pain treatment among long-term care residents: evidence from the Minimum Data Set 3.0. Aging Ment Health. 2019;23(9):1146-1155. doi:10.1080/13607863.2018.1481922
10. Woo A, Lechner B, Fu T, et al. Cut points for mild, moderate, and severe pain among cancer and non-cancer patients: a literature review. Ann Palliat Med. 2015;4(4):176-183. doi:10.3978/j.issn.2224-5820.2015.09.04
11. Centers for Disease Control and Prevention. Calculating total daily dose of opioids for safer dosage. 2017. Accessed December 15, 2021. https://www.cdc.gov/drugoverdose/pdf/calculating_total_daily_dose-a.pdf
12. Nielsen S, Degenhardt L, Hoban B, Gisev N. Comparing opioids: a guide to estimating oral morphine equivalents (OME) in research. NDARC Technical Report No. 329. National Drug and Alcohol Research Centre; 2014. Accessed December 15, 2021. http://www.drugsandalcohol.ie/22703/1/NDARC Comparing opioids.pdf
13. Smith HS. Variations in opioid responsiveness. Pain Physician. 2008;11(2):237-248.
14. Collin E, Cesselin F. Neurobiological mechanisms of opioid tolerance and dependence. Clin Neuropharmacol. 1991;14(6):465-488. doi:10.1097/00002826-199112000-00001
15. Higgins C, Smith BH, Matthews K. Evidence of opioid-induced hyperalgesia in clinical populations after chronic opioid exposure: a systematic review and meta-analysis. Br J Anaesth. 2019;122(6):e114-e126. doi:10.1016/j.bja.2018.09.019
16. Howe CQ, Sullivan MD. The missing ‘P’ in pain management: how the current opioid epidemic highlights the need for psychiatric services in chronic pain care. Gen Hosp Psychiatry. 2014;36(1):99-104. doi:10.1016/j.genhosppsych.2013.10.003
17. Substance Abuse and Mental Health Services Administration. Key substance use and mental health indicators in the United States: results from the 2018 National Survey on Drug Use and Health. HHS Publ No PEP19-5068, NSDUH Ser H-54. 2019;170:51-58. Accessed December 15, 2021. https://www.samhsa.gov/data/sites/default/files/cbhsq-reports/NSDUHNationalFindingsReport2018/NSDUHNationalFindingsReport2018.pdf
18. World Health Organization. WHO’s cancer pain ladder for adults. Accessed September 21, 2018. www.who.int/ncds/management/palliative-care/Infographic-cancer-pain-lowres.pdf
19. Ballantyne JC, Kalso E, Stannard C. WHO analgesic ladder: a good concept gone astray. BMJ. 2016;352:i20. doi:10.1136/bmj.i20
20. The Opioid Therapy for Chronic Pain Work Group. VA/DoD clinical practice guideline for opioid therapy for chronic pain. US Dept of Veterans Affairs and Dept of Defense; 2017. Accessed December 15, 2021. https://www.healthquality.va.gov/guidelines/Pain/cot/VADoDOTCPG022717.pdf
21. Defense & Veterans Pain Rating Scale (DVPRS). Defense & Veterans Center for Integrative Pain Management. Accessed July 21, 2021. https://www.dvcipm.org/clinical-resources/defense-veterans-pain-rating-scale-dvprs/
22. Guy GP Jr, Zhang K, Bohm MK, et al. Vital signs: changes in opioid prescribing in the United States, 2006–2015. MMWR Morb Mortal Wkly Rep. 2017;66(26):697-704. doi:10.15585/mmwr.mm6626a4
Older adults admitted to post-acute settings frequently have complex rehabilitation needs and multimorbidity, which predisposes them to pain management challenges.1,2 The prevalence of pain in post-acute and long-term care is as high as 65%, and opioid use is common among this population with 1 in 7 residents receiving long-term opioids.3,4
Opioids that do not adequately control pain represent a missed opportunity for deprescribing. There is limited evidence regarding efficacy of long-term opioid use (> 90 days) for improving pain and physical functioning.5 In addition, long-term opioid use carries significant risks, including overdose-related death, dependence, and increased emergency department visits.5 These risks are likely to be pronounced among veterans receiving post-acute care (PAC) who are older, have comorbid psychiatric disorders, are prescribed several centrally acting medications, and experience substance use disorder (SUD).6
Older adults are at increased risk for opioid toxicity because of reduced drug clearance and smaller therapeutic window.5 Centers for Disease Control and Prevention (CDC) guidelines recommend frequently assessing patients for benefit in terms of sustained improvement in pain as well as physical function.5 If pain and functional improvements are minimal, opioid use and nonopioid pain management strategies should be considered. Some patients will struggle with this approach. Directly asking patients about the effectiveness of opioids is challenging. Opioid users with chronic pain frequently report problems with opioids even as they describe them as indispensable for pain management.7,8
Earlier studies have assessed patient perspectives regarding opioid difficulties as well as their helpfulness, which could introduce recall bias. Patient-level factors that contribute to a global sense of distress, in addition to the presence of painful physical conditions, also could contribute to patients requesting opioids without experiencing adequate pain relief. One study in veterans residing in PAC facilities found that individuals with depression, posttraumatic stress disorder (PTSD), and SUD were more likely to report pain and receive scheduled analgesics; this effect persisted in individuals with PTSD even after adjusting for demographic and functional status variables.9 The study looked only at analgesics as a class and did not examine opioids specifically. It is possible that distressed individuals, such as those with uncontrolled depression, PTSD, and SUD, might be more likely to report high pain levels and receive opioids with inadequate benefit and increased risk. Identifying the primary condition causing distress and targeting treatment to that condition (ie, depression) is preferable to escalating opioids in an attempt to treat pain in the context of nonresponse. Assessing an individual’s aggregate response to opioids rather than relying on a single self-report is a useful addition to current pain management strategies.
The goal of this study was to pilot a method of identifying opioid-nonresponsive pain using administrative data, measure its prevalence in a PAC population of veterans, and explore clinical and demographic correlates with particular attention to variates that could indicate high levels of psychological and physical distress. Identifying pain that is poorly responsive to opioids would give clinicians the opportunity to avoid or minimize opioid use and prioritize treatments that are likely to improve the resident’s pain, quality of life, and physical function while minimizing recall bias. We hypothesized that pain that responds poorly to opioids would be prevalent among veterans residing in a PAC unit. We considered that veterans with pain poorly responsive to opioids would be more likely to have factors that would place them at increased risk of adverse effects, such as comorbid psychiatric conditions, history of SUD, and multimorbidity, providing further rationale for clinical equipoise in that population.6
Methods
This was a small, retrospective cross-sectional study using administrative data and chart review. The study included veterans who were administered opioids while residing in a single US Department of Veterans Affairs (VA) community living center PAC (CLC-PAC) unit during at least 1 of 4 nonconsecutive, random days in 2016 and 2017. The study was approved by the institutional review board of the Ann Arbor VA Health System (#2017-1034) as part of a larger project involving models of care in vulnerable older veterans.
Inclusion criteria were the presence of at least moderate pain (≥ 4 on a 0 to 10 scale); receiving ≥ 2 opioids ordered as needed over the prespecified 24-hour observation period; and having ≥ 2 pre-and postopioid administration pain scores during the observation period. Veterans who did not meet these criteria were excluded. At the time of initial sample selection, we did not capture information related to coprescribed analgesics, including a standing order of opioids. To obtain the sample, we initially characterized all veterans on the 4 days residing in the CLC-PAC unit as those reporting at least moderate pain (≥ 4) and those who reported no or mild pain (< 4). The cut point of 4 of 10 is consistent with moderate pain based on earlier work showing higher likelihood of pain that interferes with physical function.10 We then restricted the sample to veterans who received ≥ 2 opioids ordered as needed for pain and had ≥ 2 pre- and postopioid administration numeric pain rating scores during the 24-hour observation period. This methodology was chosen to enrich our sample for those who received opioids regularly for ongoing pain. Opioids were defined as full µ-opioid receptor agonists and included hydrocodone, oxycodone, morphine, hydromorphone, fentanyl, tramadol, and methadone.
Medication administration data were obtained from the VA corporate data warehouse, which houses all barcode medication administration data collected at the point of care. The dataset includes pain scores gathered by nursing staff before and after administering an as-needed analgesic. The corporate data warehouse records data/time of pain scores and the analgesic name, dosage, formulation, and date/time of administration. Using a standardized assessment form developed iteratively, we calculated opioid dosage in oral morphine equivalents (OME) for comparison.11,12 All abstracted data were reexamined for accuracy. Data initially were collected in an anonymized, blinded fashion. Participants were then unblinded for chart review. Initial data was captured in resident-days instead of unique residents because an individual resident might have been admitted on several observation days. We were primarily interested in how pain responded to opioids administered in response to resident request; therefore, we did not examine response to opioids that were continuously ordered (ie, scheduled). We did consider scheduled opioids when calculating total daily opioid dosage during the chart review.
Outcome of Interest
The primary outcome of interest was an individual’s response to as-needed opioids, which we defined as change in the pain score after opioid administration. The pre-opioid pain score was the score that immediately preceded administration of an as-needed opioid. The postopioid administration pain score was the first score after opioid administration if obtained within 3 hours of administration. Scores collected > 3 hours after opioid administration were excluded because they no longer accurately reflected the impact of the opioid due to the short half-lives. Observations were excluded if an opioid was administered without a recorded pain score; this occurred once for 6 individuals. Observations also were excluded if an opioid was administered but the data were captured on the following day (outside of the 24-hour window); this occurred once for 3 individuals.
We calculated a ∆ score by subtracting the postopioid pain rating score from the pre-opioid score. Individual ∆ scores were then averaged over the 24-hour period (range, 2-5 opioid doses). For example, if an individual reported a pre-opioid pain score of 10, and a postopioid pain score of 2, the ∆ was recorded as 8. If the individual’s next pre-opioid score was 10, and post-opioid score was 6, the ∆ was recorded as 4. ∆ scores over the 24-hour period were averaged together to determine that individual’s response to as-needed opioids. In the previous example, the mean ∆ score is 6. Lower mean ∆ scores reflect decreased responsiveness to opioids’ analgesic effect.
Demographic and clinical data were obtained from electronic health record review using a standardized assessment form. These data included information about medical and psychiatric comorbidities, specialist consultations, and CLC-PAC unit admission indications and diagnoses. Medications of interest were categorized as antidepressants, antipsychotics, benzodiazepines, muscle relaxants, hypnotics, stimulants, antiepileptic drugs/mood stabilizers (including gabapentin and pregabalin), and all adjuvant analgesics. Adjuvant analgesics were defined as medications administered for pain as documented by chart notes or those ordered as needed for pain, and analyzed as a composite variable. Antidepressants with analgesic properties (serotonin-norepinephrine reuptake inhibitors and tricyclic antidepressants) were considered adjuvant analgesics. Psychiatric information collected included presence of mood, anxiety, and psychotic disorders, and PTSD. SUD information was collected separately from other psychiatric disorders.
Analyses
The study population was described using tabulations for categorical data and means and standard deviations for continuous data. Responsiveness to opioids was analyzed as a continuous variable. Those with higher mean ∆ scores were considered to have pain relatively more responsive to opioids, while lower mean ∆ scores indicated pain less responsive to opioids. We constructed linear regression models controlling for average pre-opioid pain rating scores to explore associations between opioid responsiveness and variables of interest. All analyses were completed using Stata version 15. This study was not adequately powered to detect differences across the spectrum of opioid responsiveness, although the authors have reported differences in this article.
Results
Over the 4-day observational period there were 146 resident-days. Of these, 88 (60.3%) reported at least 1 pain score of ≥ 4. Of those, 61 (41.8%) received ≥ 1 as-needed opioid for pain. We identified 46 resident-days meeting study criteria of ≥ 2 pre- and postanalgesic scores. We identified 41 unique individuals (Figure 1). Two individuals were admitted to the CLC-PAC unit on 2 of the 4 observation days, and 1 individual was admitted to the CLC-PAC unit on 3 of the 4 observation days. For individuals admitted several days, we included data only from the initial observation day.
Response to opioids varied greatly in this sample. The mean (SD) ∆ pain score was 3.4 (1.6) and ranged from 0.5 to 6.3. Using linear regression, we found no relationship between admission indication, medical comorbidities (including active cancer), and opioid responsiveness (Table).
Psychiatric disorders were highly prevalent, with 25 individuals (61.0%) having ≥ 1 any psychiatric diagnosis identified on chart review. The presence of any psychiatric diagnosis was significantly associated with reduced responsiveness to opioids (β = −1.08; 95% CI, −2.04 to −0.13; P = .03). SUDs also were common, with 17 individuals (41.5%) having an active SUD; most were tobacco/nicotine. Twenty-six veterans (63.4%) had documentation of SUD in remission with 19 (46.3%) for substances other than tobacco/nicotine. There was no indication that any veteran in the sample was prescribed medication for opioid use disorder (OUD) at the time of observation. There was no relationship between opioid responsiveness and SUDs, neither active or in remission. Consults to other services that suggested distress or difficult-to-control symptoms also were frequent. Consults to the pain service were significantly associated with reduced responsiveness to opioids (β = −1.75; 95% CI, −3.33 to −0.17; P = .03). Association between psychiatry consultation and reduced opioid responsiveness trended toward significance (β = −0.95; 95% CI, −2.06 to 0.17; P = .09) (Figures 2 and 3). There was no significant association with palliative medicine consultation and opioid responsiveness.
A poorer response to opioids was associated with a significantly higher as-needed opioid dosage (β = −0.02; 95% CI, −0.04 to −0.01; P = .002) as well as a trend toward higher total opioid dosage (β = −0.005; 95% CI, −0.01 to 0.0003; P = .06) (Figure 4). Thirty-eight (92.7%) participants received nonopioid adjuvant analgesics for pain. More than half (56.1%) received antidepressants or gabapentinoids (51.2%), although we did not assess whether they were prescribed for pain or another indication. We did not identify a relationship between any specific psychoactive drug class and opioid responsiveness in this sample.
Discussion
This exploratory study used readily available administrative data in a CLC-PAC unit to assess responsiveness to opioids via a numeric mean ∆ score, with higher values indicating more pain relief in response to opioids. We then constructed linear regression models to characterize the relationship between the mean ∆ score and factors known to be associated with difficult-to-control pain and psychosocial distress. As expected, opioid responsiveness was highly variable among residents; some residents experienced essentially no reduction in pain, on average, despite receiving opioids. Psychiatric comorbidity, higher dosage in OMEs, and the presence of a pain service consult significantly correlated with poorer response to opioids. To our knowledge, this is the first study to quantify opioid responsiveness and describe the relationship with clinical correlates in the understudied PAC population.
Earlier research has demonstrated a relationship between the presence of psychiatric disorders and increased likelihood of receiving any analgesics among veterans residing in PAC.9 Our study adds to the literature by quantifying opioid response using readily available administrative data and examining associations with psychiatric diagnoses. These findings highlight the possibility that attempting to treat high levels of pain by escalating the opioid dosage in patients with a comorbid psychiatric diagnosis should be re-addressed, particularly if there is no meaningful pain reduction at lower opioid dosages. Our sample had a variety of admission diagnoses and medical comorbidities, however, we did not identify a relationship with opioid responsiveness, including an active cancer diagnosis. Although SUDs were highly prevalent in our sample, there was no relationship with opioid responsiveness. This suggests that lack of response to opioids is not merely a matter of drug tolerance or an indication of drug-seeking behavior.
Factors Impacting Response
Many factors could affect whether an individual obtains an adequate analgesic response to opioids or other pain medications, including variations in genes encoding opioid receptors and hepatic enzymes involved in drug metabolism and an individual’s opioid exposure history.13 The phenomenon of requiring more drug to produce the same relief after repeated exposures (ie, tolerance) is well known.14 Opioid-induced hyperalgesia is a phenomenon whereby a patient’s overall pain increases while receiving opioids, but each opioid dose might be perceived as beneficial.15 Increasingly, psychosocial distress is an important factor in opioid response. Adverse selection is the process culminating in those with psychosocial distress and/or SUDs being prescribed more opioids for longer durations.16 Our data suggests that this process could play a role in PAC settings. In addition, exaggerating pain to obtain additional opioids for nonmedical purposes, such as euphoria or relaxation, also is possible.17
When clinically assessing an individual whose pain is not well controlled despite escalating opioid dosages, prescribers must consider which of these factors likely is predominant. However, the first step of determining who has a poor opioid response is not straightforward. Directly asking patients is challenging; many individuals perceive opioids to be helpful while simultaneously reporting inadequately controlled pain.7,8 The primary value of this study is the possibility of providing prescribers a quick, simple method of assessing a patient’s response to opioids. Using this method, individuals who are responding poorly to opioids, including those who might exaggerate pain for secondary gain, could be identified. Health care professionals could consider revisiting pain management strategies, assess for the presence of OUD, or evaluate other contributors to inadequately controlled pain. Although we only collected data regarding response to opioids in this study, any pain medication administered as needed (ie, nonsteroidal anti-inflammatory drugs, acetaminophen) could be analyzed using this methodology, allowing identification of other helpful pain management strategies. We began the validation process with extensive chart review, but further validation is required before this method can be applied to routine clinical practice.
Patients who report uncontrolled pain despite receiving opioids are a clinically challenging population. The traditional strategy has been to escalate opioids, which is recommended by the World Health Organization stepladder approach for patients with cancer pain and limited life expectancy.18 Applying this approach to a general population of patients with chronic pain is ineffective and dangerous.19 The CDC and the VA/US Department of Defense (VA/DoD) guidelines both recommend carefully reassessing risks and benefits at total daily dosages > 50 OME and avoid increasing dosages to > 90 OME daily in most circumstances.5,20 Our finding that participants taking higher dosages of opioids were not more likely to have better control over their pain supports this recommendation.
Limitations
This study has several limitations, the most significant is its small sample size because of the exploratory nature of the project. Results are based on a small pilot sample enriched to include individuals with at least moderate pain who receive opioids frequently at 1 VA CLC-PAC unit; therefore, the results might not be representative of all veterans or a more general population. Our small sample size limits power to detect small differences. Data collected should be used to inform formal power calculations before subsequent larger studies to select adequate sample size. Validation studies, including samples from the same population using different dates, which reproduce findings are an important step. Moreover, we only had data on a single dimension of pain (intensity/severity), as measured by the pain scale, which nursing staff used to make a real-time clinical decision of whether to administer an as-needed opioid. Future studies should consider using pain measures that provide multidimensional assessment (ie, severity, functional interference) and/or were developed specifically for veterans, such as the Defense and Veterans Pain Rating Scale.21
Our study was cross-sectional in nature and addressed a single 24-hour period of data per participant. The years of data collection (2016 and 2017) followed a decline in overall opioid prescribing that has continued, likely influenced by CDC and VA/DoD guidelines.22 It is unclear whether our observations are an accurate reflection of individuals’ response over time or whether prescribing practices in PAC have shifted.
We did not consider the type of pain being treated or explore clinicians’ reasons for prescribing opioids, therefore limiting our ability to know whether opioids were indicated. Information regarding OUD and other SUDs was limited to what was documented in the chart during the CLC-PAC unit admission. We did not have information on length of exposure to opioids. It is possible that opioid tolerance could play a role in reducing opioid responsiveness. However, simple tolerance would not be expected to explain robust correlations with psychiatric comorbidities. Also, simple tolerance would be expected to be overcome with higher opioid dosages, whereas our study demonstrates less responsiveness. These data suggests that some individuals’ pain might be poorly opioid responsive, and psychiatric factors could increase this risk. We used a novel data source in combination with chart review; to our knowledge, barcode medication administration data have not been used in this manner previously. Future work needs to validate this method, using larger sample sizes and several clinical sites. Finally, we used regression models that controlled for average pre-opioid pain rating scores, which is only 1 covariate important for examining effects. Larger studies with adequate power should control for multiple covariates known to be associated with pain and opioid response.
Conclusions
Opioid responsiveness is important clinically yet challenging to assess. This pilot study identifies a way of classifying pain as relatively opioid nonresponsive using administrative data but requires further validation before considering scaling for more general use. The possibility that a substantial percentage of residents in a CLC-PAC unit could be receiving increasing dosages of opioids without adequate benefit justifies the need for more research and underscores the need for prescribers to assess individuals frequently for ongoing benefit of opioids regardless of diagnosis or mechanism of pain.
Acknowledgments
The authors thank Andrzej Galecki, Corey Powell, and the University of Michigan Consulting for Statistics, Computing and Analytics Research Center for assistance with statistical analysis.
1. Marshall TL, Reinhardt JP. Pain management in the last 6 months of life: predictors of opioid and non-opioid use. J Am Med Dir Assoc. 2019;20(6):789-790. doi:10.1016/j.jamda.2019.02.026
2. Tait RC, Chibnall JT. Pain in older subacute care patients: associations with clinical status and treatment. Pain Med. 2002;3(3):231-239. doi:10.1046/j.1526-4637.2002.02031.x
3. Pimentel CB, Briesacher BA, Gurwitz JH, Rosen AB, Pimentel MT, Lapane KL. Pain management in nursing home residents with cancer. J Am Geriatr Soc. 2015;63(4):633-641. doi:10.1111/jgs.13345
4. Hunnicutt JN, Tjia J, Lapane KL. Hospice use and pain management in elderly nursing home residents with cancer. J Pain Symptom Manage. 2017;53(3):561-570. doi:10.1016/j.jpainsymman.2016.10.369
5. Dowell D, Haegerich TM, Chou R. CDC guideline for prescribing opioids for chronic pain — United States, 2016. MMWR Recomm Rep. 2016;65(No. RR-1):1-49. doi:10.15585/mmwr.rr6501e1
6. Oliva EM, Bowe T, Tavakoli S, et al. Development and applications of the Veterans Health Administration’s Stratification Tool for Opioid Risk Mitigation (STORM) to improve opioid safety and prevent overdose and suicide. Psychol Serv. 2017;14(1):34-49. doi:10.1037/ser0000099
7. Goesling J, Moser SE, Lin LA, Hassett AL, Wasserman RA, Brummett CM. Discrepancies between perceived benefit of opioids and self-reported patient outcomes. Pain Med. 2018;19(2):297-306. doi:10.1093/pm/pnw263
8. Sullivan M, Von Korff M, Banta-Green C. Problems and concerns of patients receiving chronic opioid therapy for chronic non-cancer pain. Pain. 2010;149(2):345-353. doi:10.1016/j.pain.2010.02.037
9. Brennan PL, Greenbaum MA, Lemke S, Schutte KK. Mental health disorder, pain, and pain treatment among long-term care residents: evidence from the Minimum Data Set 3.0. Aging Ment Health. 2019;23(9):1146-1155. doi:10.1080/13607863.2018.1481922
10. Woo A, Lechner B, Fu T, et al. Cut points for mild, moderate, and severe pain among cancer and non-cancer patients: a literature review. Ann Palliat Med. 2015;4(4):176-183. doi:10.3978/j.issn.2224-5820.2015.09.04
11. Centers for Disease Control and Prevention. Calculating total daily dose of opioids for safer dosage. 2017. Accessed December 15, 2021. https://www.cdc.gov/drugoverdose/pdf/calculating_total_daily_dose-a.pdf
12. Nielsen S, Degenhardt L, Hoban B, Gisev N. Comparing opioids: a guide to estimating oral morphine equivalents (OME) in research. NDARC Technical Report No. 329. National Drug and Alcohol Research Centre; 2014. Accessed December 15, 2021. http://www.drugsandalcohol.ie/22703/1/NDARC Comparing opioids.pdf
13. Smith HS. Variations in opioid responsiveness. Pain Physician. 2008;11(2):237-248.
14. Collin E, Cesselin F. Neurobiological mechanisms of opioid tolerance and dependence. Clin Neuropharmacol. 1991;14(6):465-488. doi:10.1097/00002826-199112000-00001
15. Higgins C, Smith BH, Matthews K. Evidence of opioid-induced hyperalgesia in clinical populations after chronic opioid exposure: a systematic review and meta-analysis. Br J Anaesth. 2019;122(6):e114-e126. doi:10.1016/j.bja.2018.09.019
16. Howe CQ, Sullivan MD. The missing ‘P’ in pain management: how the current opioid epidemic highlights the need for psychiatric services in chronic pain care. Gen Hosp Psychiatry. 2014;36(1):99-104. doi:10.1016/j.genhosppsych.2013.10.003
17. Substance Abuse and Mental Health Services Administration. Key substance use and mental health indicators in the United States: results from the 2018 National Survey on Drug Use and Health. HHS Publ No PEP19-5068, NSDUH Ser H-54. 2019;170:51-58. Accessed December 15, 2021. https://www.samhsa.gov/data/sites/default/files/cbhsq-reports/NSDUHNationalFindingsReport2018/NSDUHNationalFindingsReport2018.pdf
18. World Health Organization. WHO’s cancer pain ladder for adults. Accessed September 21, 2018. www.who.int/ncds/management/palliative-care/Infographic-cancer-pain-lowres.pdf
19. Ballantyne JC, Kalso E, Stannard C. WHO analgesic ladder: a good concept gone astray. BMJ. 2016;352:i20. doi:10.1136/bmj.i20
20. The Opioid Therapy for Chronic Pain Work Group. VA/DoD clinical practice guideline for opioid therapy for chronic pain. US Dept of Veterans Affairs and Dept of Defense; 2017. Accessed December 15, 2021. https://www.healthquality.va.gov/guidelines/Pain/cot/VADoDOTCPG022717.pdf
21. Defense & Veterans Pain Rating Scale (DVPRS). Defense & Veterans Center for Integrative Pain Management. Accessed July 21, 2021. https://www.dvcipm.org/clinical-resources/defense-veterans-pain-rating-scale-dvprs/
22. Guy GP Jr, Zhang K, Bohm MK, et al. Vital signs: changes in opioid prescribing in the United States, 2006–2015. MMWR Morb Mortal Wkly Rep. 2017;66(26):697-704. doi:10.15585/mmwr.mm6626a4
Veterans Potentially Exposed to HIV, HCV at Georgia Hospital
Testing is ongoing after more than 4,600 veterans who had received care at the Carl Vinson Veterans Affairs Medical Center in Dublin, Georgia, were alerted that they may have been exposed to HIV, hepatitis B, and hepatitis C. The exposure was due to improperly sterilized equipment. At least some of the patients have tested positive, but the facility has not indicated the number, the diseases, or whether the infections were the result of the exposure.
A mid-January internal review at the hospital found that not all steps were being followed in the procedures for sterilizing equipment between patients. Patients who had dentistry, endoscopy, urology, podiatry, optometry, or surgical procedures in 2021 may have been exposed to blood-borne pathogens.
In response, the VA sent teams from other hospitals to help, including a team from the Augusta Veterans Affairs Medical Center to reprocess all equipment and staff from VA facilities in Atlanta, South Carolina, and Alabama to provide personnel training. All staff at Carl Vinson Veterans Affairs Medical Center have since been retrained on all current guidelines.
The hospital says it’s still testing exposed veterans. Hospital spokesperson James Huckfeldt told a Macon-based newspaper, The Telegraph, that veterans with positive test results will undergo additional testing to determine whether the transmission is new or preexisting. “The findings from the additional testing will be used to accurately diagnose any impacted veterans and ensure that they receive appropriate medical treatment,” he said.
Manuel M. Davila, director of the hospital, sent letters to the patients at risk, alerting them to the exposure. “We sincerely apologize and accept responsibility for this mistake and are taking steps to prevent it from happening in the future,” Davilla wrote. “This event is unacceptable to us as well, and we want to work with you to correct the situation and ensure your safety and well-being. Because your safety is important to us and because we want to honor your trust in us, we want you to know that when concerns are raised over our processes or procedures, we take immediate steps to stop everything and make sure things are.”
Davilla reassured the veterans that “we are confident that the risk of infectious disease is very low.”
The Carl Vinson Medical Center has set up a communication center to answer questions for veterans: (478) 274-5400.
An Academic Hospitalist–Run Outpatient Paracentesis Clinic
Cirrhosis is the most common cause of ascites in the United States. In patients with compensated cirrhosis, the 10-year probability of developing ascites is 47%. Developing ascites portends a poor prognosis. Fifteen percent of patients who receive this diagnosis die within 1 year, and 44% within 5 years.1 First-line treatment of cirrhotic ascites consists of dietary sodium restriction and diuretic therapy. Refractory ascites is defined as ascites that cannot be easily mobilized despite adhering to a dietary sodium intake of ≤ 2 g daily and daily doses of spironolactone 400 mg and furosemide 160 mg.
Patients who cannot tolerate diuretics because of complications are defined as having diuretic intractable ascites. Diuretic-induced complications include hepatic encephalopathy, renal impairment, hyponatremia, and hypo- or hyperkalemia. Because these patients are either unresponsive to or intolerant of diuretics, second-line treatments, such as regular large-volume paracentesis (LVP) or the insertion of a transjugular intrahepatic portosystemic shunt (TIPS) are needed to manage their ascites. These patients also should be considered for liver transplantation unless there is a contraindication.2
Serial LVP has been shown to be safe and effective in controlling refractory ascites.3 TIPS will decrease the need for repeated LVP in patients with refractory LVP. However, given the uncertainty as to the effect of TIPS creation on survival and the increased risk of encephalopathy, the American Association for the Study of Liver Diseases (AASLD) recommends that TIPS should be used only in those patients who cannot tolerate repeated LVP.4 Repeated LVP also has been shown to be safe and effective in controlling malignant ascites.5,6
LVP can be done in different health care settings. These include the emergency department (ED), interventional radiology suite, inpatient bed, or an outpatient paracentesis clinic. There have been various descriptions of outpatient paracentesis clinics. Reports from the United Kingdom have revealed that paracenteses in these outpatient clinics can be performed safely by nurse practitioners or a liver specialist nurse, that these clinics are highly rated by the patients, and are cost effective.7-10 Gashau and colleagues describe a clinic in Great Britain run by gastroenterology (GI) fellows using an endoscopy suite.11 A nurse practitioner outpatient paracentesis clinic in the US has been described as well.12 Grabau and colleagues present a clinic run by GI endoscopy assistants (licensed practical nurses) using a dedicated paracentesis room in the endoscopy suite.13 Cheng and colleagues describe an outpatient paracentesis clinic in a radiology department run by a single advanced practitioner with assistance from an ultrasound technologist.14 Wang and colleagues present outpatient paracenteses in an outpatient transitional care program by a physician or an advanced practitioner supervised by a physician.15 Sehgal and colleagues describe (in abstract) the creation of a hospitalist-run paracentesis clinic.16
Traditionally, at Veterans Affairs Pittsburgh Healthcare System (VAPHS) in Pennsylvania, if a patient needed LVP, they were admitted to a medicine bed. LVP is not done in the ED, and interventional radiology cannot accommodate the number of patients requiring LVP because of their caseload. The procedure was done by an attending hospitalist or medical residents under the supervision of an attending hospitalist. To improve patient flow and decrease the number of patients using inpatients beds, we created an outpatient paracentesis clinic in 2014. Here, we present the logistics of the clinic, patient demographics, the amount of ascites removed, and the time required to remove the ascites. As part of ongoing quality assurance, we keep track of any complications and report these as well.
Methods
The setting of the outpatient paracentesis clinic is a room in the VAPHS endoscopy suite. The clinic operates 1 half-day per week with up to 3 patients receiving a paracentesis. We use the existing logistics in the endoscopy suite. There are 1 or 2 registered nurses (RNs) who assist the physician performing the paracentesis. The proceduralist is an academic hospitalist who at the time is not on service with residents. The patients are referred to the clinic by the ED, hepatology clinic, palliative care, primary care physicians, or at hospital discharge. In the clinic consult, patients are required to have at least an estimated 3 L of ascites and systolic blood pressure (SBP) ≥ 90. The patients can eat and take medications the morning of the procedure except diuretics. Patients are checked in to the endoscopy suite and a peripheral IV is placed. Blood tests, such as a complete blood count and coagulation studies, are not checked routinely since the AASLD guidelines state that routine prophylactic use of fresh frozen plasma or platelets before paracentesis is not recommended because bleeding is uncommon.3 The proceduralist can order blood work at their discretion.
After the procedure, patients are brought to the recovery area of the endoscopy suite and discharged. The patients are discharged usually within 15 to 30 minutes from arriving in the recovery area after it is assured that the SBP is within 10% of their baseline. Patient follow-up in the outpatient paracentesis clinic is determined by the proceduralist. Most patients need regularly scheduled paracenteses depending on how quickly they reaccumulate ascites. If a patient does not need a regularly scheduled paracentesis, the proceduralist ensures that the appropriate outpatient clinic visit has been scheduled or requested.
Procedure
Informed consent is obtained, and a time-out is performed before each paracentesis. The patient is attached to a cardiac monitor and pulse oximetry as per the endoscopy suite protocol. The proceduralist does a point-of-care ultrasound to find the optimal site and marks the site of puncture. The skin around the marked site is prepared with 3 chlorhexidine gluconate 2%/isopropyl alcohol 70% applicators. A fenestrated drape is used to form a sterile field. The Avanos Paracentesis Kit is routinely used for LVP at VAPHS. Local anesthesia with 1% lidocaine is used with a 25-gauge × 1-inch needle. Deeper anesthesia is obtained with 1% lidocaine, using a 22-gauge × 1.5-inch needle, injecting and aspirating while advancing the needle until ascites is aspirated.
A 15-gauge 3.3-inch Caldwell cannula with an inner needle is inserted into the peritoneal cavity and ascites is aspirated into a syringe. The inner needle is then removed, and the Caldwell cannula is left in the peritoneal cavity and tubing with a roller clamp is attached to the cannula. The tubing is then attached to a 1-L vacuum suction bottle by the RN. We use the CareFusion PleurX drainage bottle. The proceduralist maintains sterility and assures the cannula remains in place. The RN changes the drainage bottles after being filled with 1 L of ascites.
We drain as much ascites as possible until drainage stops on its own. The cannula is then removed, and pressure is held with a gauze pad. An adhesive bandage is then placed over the site. Consistent with AASLD guideline, 25 g of IV albumin 25% is infused for every 3 L of albumin removed provided > 5 L of ascites is removed.3 The albumin is infused during the procedure and not after to limit the time of the procedure. A sample of ascites is sent for cell count with differential and culture.
Results
Between March 2014 and May 2020, 506 paracenteses were performed on 82 patients. The mean age was 66.4 years, and 80 of 82 patients were male. The etiology of the ascites is presented in the Table. Twelve percent of the patients had concomitant hepatocellular carcinoma. Data on the amount of ascites removed were available for all patients, but data on the amount of time it took to do the LVP were available for 392 of 506 paracenteses. The mean volume removed was 7.9 L (range, 0.2-22.9 L), and the mean time of the procedure was 33.3 minutes. The time of the procedure was the time difference between entering and leaving the procedure room. This does not include IV placement or the recovery area time.
There were 5 episodes of postprocedure hypotension that required IV fluid or admission. In all these events, the patients had received the appropriate amount of IV albumin. Three patients required admission, and 1 patient required IV fluid postparacentesis on 2 occasions and then was discharged home. One abdominal wall hematoma occurred. Two patients with umbilical hernias developed incarceration after the paracentesis; both required surgical repair. There were 3 episodes of leakage at the paracentesis site; a skin adhesive was used in 2 cases, and sutures were applied in the other. There were no deaths.
Possible Infections
Ascitic fluid infection is a risk for patients needing paracentesis. Spontaneous bacterial peritonitis (SBP) is a bacterial infection of ascites in the absence of a focal contiguous source. The polymorphonuclear leukocyte (PMN) count in the ascites is ≥ 250 cells/mm3 in the presence of a single organism on culture. Culture-negative neutrocytic ascites (CNNA) is an ascitic fluid PMN count ≥ 250 cells/mm3 in the absence of culture growth obtained before the administration of antibiotics. Monomicrobial nonneutrocytic bacterascites (MNB) is an ascitic fluid PMN count < 250 cells/mm3 with growth of a single organism on culture.17 There was one occasion where a patient developed symptomatic CNNA 3 days after having a therapeutic paracentesis in the clinic at which time his ascites had a normal neutrophil count and a negative culture. He presented with abdominal pain and fever 3 days later, and a diagnostic paracentesis was done in the ED. He was treated as though he had SBP and did well.
Ascites cell count and culture are routinely sent in the clinic, and 1 case of asymptomatic SBP and 3 cases of asymptomatic ascitic fluid infection variants were diagnosed. The patient with SBP grew vancomycin-resistant Enterococcus faecium in his ascites. Two cases were CNNA. These patients were admitted to the hospital and treated with IV antibiotics. One case of MNB occurred that grew Escherichia coli. The patient refused to return to the hospital for IV antibiotics and was treated with a 5-day course of oral ciprofloxacin.
Discussion
We describe an academic hospitalist–run outpatient LVP clinic where large volumes of ascites are removed efficiently and safely. The only other description of a hospitalist-run paracentesis clinic was in abstract form.16 Without the clinic, the patients would have been admitted to the hospital to get an LVP. Based on VAPHS data from fiscal year 2021, the average cost per day of a nontelemetry medicine admission was $3394. Over 74 months, 506 admissions were prevented, which averages to 82 admissions prevented per year, an approximate annual cost savings of $278,308 in the last fiscal year alone.
Possible Complications
The complications we report are congruent with those reported in the literature. Runyon reported that the rate of an abdominal wall hematoma requiring blood transfusion was 0.9%, and the rate of an abdominal wall hematoma not requiring blood transfusion was also 0.9%.18 We had 1 patient who developed an abdominal wall hematoma (0.2% of paracenteses). This patient required 4 units of packed red blood cells. The incidence of ascitic fluid leakage after paracentesis has been reported to be between 0.4% and 2.4%.12 We had 3 episodes of leakage (0.6% of paracenteses). The Z-track technique has been purported to decrease postparacentesis leakage.2 This involves creating a pathway that is nonlinear when anesthetizing the soft tissues and inserting the paracentesis needle. The Z-track technique was not used in any of the paracenteses in our clinic.
Postparacentesis hypotension has been reported to be 0.4% to 1.8%.12,14 We report 5 episodes of hypotension (0.1% of paracenteses) of which 3 patients were admitted to the hospital. Interestingly, 4 of the 5 patients were on β-blockers. Serste and colleagues reported in a crossover trial that paracentesis-induced circulatory dysfunction (PICD) decreased from 80 to 10% when propranolol was discontinued.19 PICD is characterized by reduction of effective arterial blood volume with subsequent activation of vasoconstrictor and antinatriuretic factors that can cause rapid ascites recurrence rate, development of dilutional hyponatremia, hepatorenal syndrome, and increased mortality. IV albumin is given during LVP to prevent PICD. Discontinuing unnecessary antihypertensive medications, especially β-blockers, may mitigate postparacentesis hypotension. In a study of 515 paracenteses, De Gottardi and colleagues reported a 0.2% rate of iatrogenic percutaneous infection of ascites.20 We had 1 patient return 3 days after LVP with fever, abdominal pain, and neutrocytic ascites. His blood and ascites cultures were negative. The etiology of his infected ascites could have been either a spontaneously developed CNNA infection or an iatrogenic percutaneous infection of ascites.
Two cases of incarceration and strangulation of umbilical hernias postparacentesis that required emergent surgical intervention were unanticipated complications. Incarceration of an existing umbilical hernia postparacentesis is an uncommon but serious complication of LVP described in the past in numerous case reports but whose incidence is otherwise unknown.21-26 The fluid and pressure shifts before and after LVP are likely responsible for the hernia incarceration. When ascites is present, the umbilical hernia ring is kept patent by the pressure of the ascitic fluid, and the decrease in tension after removal of ascites may lead to decreased size of the hernia ring and trapping of contents in the hernia sac.25-27 In most reported cases, symptoms and recognition of the incarcerated hernia have occurred within 2 days of the index paracentesis procedure. Most cases were in patients who required serial paracenteses for management of ascites and had relatively regular LVPs.
In both cases, the patients had regular visits for paracentesis, and incarceration occurred 0.5 hours postprocedure, in 1 case and 6 hours in the other. Umbilical hernias are common in patients with cirrhosis, with the prevalence approaching 20%.28 The management of umbilical hernias in patients with ascites is complex and optimal guideline-based management involves elective repair when ascites is adequately controlled to prevent recurrence, with consideration of TIPS at the time of repair.3 However, patients enrolled in outpatient paracentesis clinics are unlikely to have adequate ascites control to be considered optimized for an elective repair. In addition, given the number of serial procedures that they require, it is not surprising that they may be at risk for complications that are otherwise thought to be rare. Although incarceration and strangulation of umbilical hernia is thought to be a rare complication of LVP, patients should be informed of this potential complication so that they are aware to seek medical attention should they develop signs or symptoms.
Guidelines
There are no guidelines on how much ascites can be removed and how quickly the ascites can be removed during LVP. The goal of a therapeutic paracentesis is to remove as much fluid as possible, and there are no limits on the amount that can be removed safely.1 Concerning paracentesis flow rates, Elsabaawy and colleagues showed that ascites flow rate does not correlate with PICD. They looked at 3 groups with ascites flow rates of 80 mL/min, 180 mL/min and 270 mL/min.29 We had data on the time in the procedure room in 77% of our procedures. Given our average amount of ascites removed (7.9 L) and average time in the procedure room (33.3 minutes), the average flow rate from our clinic was at least 237 mL/min (although the flow rate was likely higher because the average time from needle inserted to needle removed was < 33.3 minutes). Both the mean duration of LVP and the mean volume of ascites removed in an outpatient paracentesis clinic were reported in only 1 other study. In a study of 1100 patients, Grabau and colleagues reported the mean duration, defined as the time between when the patient entered and exited the procedure room (the same time period we reported) as 97 minutes and the mean volume of ascites removed as 8.7 L.13
The AASLD guidelines state that patients undergoing serial outpatient LVP should be tested only for cell count and differential without sending a bacterial culture. The reason given is that false positives may exceed true positives from ascites bacterial culture results in asymptomatic patients.3 Mohan and Venkataraman reported a 0.4% rate of SBP, 1.4% rate of CNNA, and 0.7% rate of MNB in asymptomatic patients undergoing LVP in an outpatient clinic.30 We had a 0.2% rate of SBP, 0.4% rate of CNNA, and 0.2% rate of MNB. Given the low rates of SBP in outpatient paracenteses clinics, we will adopt the AASLD suggestions to only send an ascites cell count and not a culture in asymptomatic patients. Noteworthy, our patient with asymptomatic SBP grew vancomycin-resistant Enterococcus faecium, which was resistant to standard SBP antibiotic therapy. However, if ascites culture was not sent, he would have been treated with antibiotics for CNNA, and if he developed symptoms, he would have had a repeat paracentesis with cell count and culture sent.
Training
In 2015, faculty at VAPHS and the University of Pittsburgh School of Medicine designed a Mastering Paracentesis for Medical Residents course based on current guidelines on the management of ascites and published procedural guides. The course is mandatory for all postgraduate year-1 internal medicine residents and begins with 2 hours of didactic and simulation-based training with an ultrasound-compatible paracentesis mannequin. In the 3 weeks following simulation-based training, residents rotate through our outpatient paracentesis clinic and perform between 1 and 3 abdominal paracentesis procedures, receiving as-needed coaching and postprocedure feedback from faculty. Since the course’s inception, more than 150 internal medicine residents have been trained in paracentesis through our clinic.
Conclusions
We present a description of a successful outpatient paracentesis clinic at our hospital run by academic hospitalists. The clinic was created to decrease the number of admissions for LVP. We were fortunate to be able to use the GI endoscopy suite and their resources as the clinic setting. To create outpatient LVP clinics at other institutions, administrative support is essential. In conclusion, we have shown that an outpatient paracentesis clinic run by academic hospitalists can safely and quickly remove large volumes of ascites.
1. Ge PS, Runyon BA. Treatment of patients with cirrhosis. N Engl J Med. 2016;375(8):767-777. doi:10.1056/NEJMra1504367
2. Wong F. Management of ascites in cirrhosis. J Gastroenterol Hepatol. 2012;27(1):11-20. doi:10.1111/j.1440-1746.2011.06925.x
3. Runyon BA; AASLD. Introduction to the revised American Association for the Study of Liver Diseases Practice Guideline management of adult patients with ascites due to cirrhosis 2012. Hepatology. 2013;57(4):1651-1653. doi:10.1002/hep.26359
4. Boyer TD, Haskal ZJ; American Association for the Study of Liver Diseases. The role of transjugular intrahepatic portosystemic shunt (TIPS) in the management of portal hypertension: update 2009. Hepatology. 2010;51(1):306. doi:10.1002/hep.23383
5. Harding V, Fenu E, Medani H, et al. Safety, cost-effectiveness and feasibility of daycase paracentesis in the management of malignant ascites with a focus on ovarian cancer. Br J Cancer. 2012;107(6):925-930. doi:10.1038/bjc.2012.343
6. Korpi S, Salminen VV, Piili RP, Paunu N, Luukkaala T, Lehto JT. Therapeutic procedures for malignant ascites in a palliative care outpatient clinic. J Palliat Med. 2018;21(6):836-841. doi:10.1089/jpm.2017.0616
7. Vaughan J. Developing a nurse-led paracentesis service in an ambulatory care unit. Nurs Stand. 2013;28(4):44-50. doi:10.7748/ns2013.09.28.4.44.e7751
8. Menon S, Thompson L-S, Tan M, et al. Development and cost-benefit analysis of a nurse-led paracentesis and infusion service. Gastrointestinal Nursing. 2016;14(9):32-38. doi:10.12968/gasn.2016.14.9.32
9. Hill S, Smalley JR, Laasch H-U. Developing a nurse-led, day-case, abdominal paracentesis service. Cancer Nursing Practice. 2013;12(5):14-20. doi:10.7748/cnp2013.06.12.5.14.e942
10. Tahir F, Hollywood C, Durrant D. PWE-134 Overview of efficacy and cost effectiveness of nurse led day case abdominal paracentesis service at Gloucestershire Hospital NHS Foundation Trust. Gut. 2014;63(suppl 1):A183.2-A183. doi:10.1136/gutjnl-2014-307263.394
11. Gashau W, Samra G, Gasser J, Rolland M, Sambaiah P, Shorrock C. PTH-075 “ascites clinic”: an outpatient service model for patients requiring large volume paracentesis. Gut. 2014;63(suppl 1):A242.2-A242. doi:10.1136/gutjnl-2014-307263.521
12. Gilani N, Patel N, Gerkin RD, Ramirez FC, Tharalson EE, Patel K. The safety and feasibility of large volume paracentesis performed by an experienced nurse practitioner. Ann Hepatol. 2009;8(4):359-363.
13. Grabau CM, Crago SF, Hoff LK, et al. Performance standards for therapeutic abdominal paracentesis. Hepatology. 2004;40(2):484-488. doi:10.1002/hep.20317
14. Cheng YW, Sandrasegaran K, Cheng K, et al. A dedicated paracentesis clinic decreases healthcare utilization for serial paracenteses in decompensated cirrhosis. Abdom Radiol (NY). 2018;43(8):2190-2197. doi:10.1007/s00261-017-1406-y
15. Wang J, Khan S, Wyer P, et al. The role of ultrasound-guided therapeutic paracentesis in an outpatient transitional care program: a case series. Am J Hosp Palliat Care. 2018;35(9):1256-1260. doi:10.1177/1049909118755378
16. Sehgal R, Dickerson J, Holcomb M. Creation of a hospitalist-run paracentesis clinic [abstract]. J Hosp Med. 2015;10(suppl 2).
17. Sheer TA, Runyon BA. Spontaneous bacterial peritonitis. Dig Dis. 2005;23(1):39-46. doi:10.1159/000084724
18. Runyon BA. Paracentesis of ascitic fluid. A safe procedure. Arch Intern Med. 1986;146(11):2259-2261.
19. Sersté T, Francoz C, Durand F, et al. Beta-blockers cause paracentesis-induced circulatory dysfunction in patients with cirrhosis and refractory ascites: a cross-over study. J Hepatol. 2011;55(4):794-799. doi:10.1016/j.jhep.2011.01.034
20. De Gottardi A, Thévenot T, Spahr L, et al. Risk of complications after abdominal paracentesis in cirrhotic patients: a prospective study. Clin Gastroenterol Hepatol. 2009;7(8):906-909. doi:10.1016/j.cgh.2009.05.004
21. Khodarahmi I, Shahid MU, Contractor S. Incarceration of umbilical hernia: a rare complication of large volume paracentesis. J Radiol Case Rep. 2015;9(9):20-25. doi:10.3941/jrcr.v9i9.2614
22. Chu KM, McCaughan GW. Iatrogenic incarceration of umbilical hernia in cirrhotic patients with ascites. Am J Gastroenterol. 1995;90(11):2058-2059.
23. Triantos CK, Kehagias I, Nikolopoulou V, Burroughs AK. Incarcerated umbilical hernia after large volume paracentesis for refractory ascites. J Gastrointestin Liver Dis. 2010;19(3):245.
24. Touze I, Asselah T, Boruchowicz A, Paris JC. Abdominal pain in a cirrhotic patient with ascites. Postgrad Med J. 1997;73(865):751-752. doi:10.1136/pgmj.73.865.751
25. Baron HC. Umbilical hernia secondary to cirrhosis of the liver. Complications of surgical correction. N Engl J Med. 1960;263:824-828. doi:10.1056/NEJM196010272631702
26. Tan HK, Chang PE. Acute abdomen secondary to incarcerated umbilical hernia after treatment of massive cirrhotic ascites. Case Reports Hepatol. 2013;2013:948172. doi:10.1155/2013/948172
27. Lemmer JH, Strodel WE, Eckhauser FE. Umbilical hernia incarceration: a complication of medical therapy of ascites. Am J Gastroenterol. 1983;78(5):295-296.
28. Belghiti J, Durand F. Abdominal wall hernias in the setting of cirrhosis. Semin Liver Dis. 1997;17(3):219-226. doi:10.1055/s-2007-1007199
29. Elsabaawy MM, Abdelhamid SR, Alsebaey A, et al. The impact of paracentesis flow rate in patients with liver cirrhosis on the development of paracentesis induced circulatory dysfunction. Clin Mol Hepatol. 2015;21(4):365-371. doi:10.3350/cmh.2015.21.4.365
30. Mohan P, Venkataraman J. Prevalence and risk factors for unsuspected spontaneous ascitic fluid infection in cirrhotics undergoing therapeutic paracentesis in an outpatient clinic. Indian J Gastroenterol. 2011;30(5):221-224. doi:10.1007/s12664-011-0131-7
Cirrhosis is the most common cause of ascites in the United States. In patients with compensated cirrhosis, the 10-year probability of developing ascites is 47%. Developing ascites portends a poor prognosis. Fifteen percent of patients who receive this diagnosis die within 1 year, and 44% within 5 years.1 First-line treatment of cirrhotic ascites consists of dietary sodium restriction and diuretic therapy. Refractory ascites is defined as ascites that cannot be easily mobilized despite adhering to a dietary sodium intake of ≤ 2 g daily and daily doses of spironolactone 400 mg and furosemide 160 mg.
Patients who cannot tolerate diuretics because of complications are defined as having diuretic intractable ascites. Diuretic-induced complications include hepatic encephalopathy, renal impairment, hyponatremia, and hypo- or hyperkalemia. Because these patients are either unresponsive to or intolerant of diuretics, second-line treatments, such as regular large-volume paracentesis (LVP) or the insertion of a transjugular intrahepatic portosystemic shunt (TIPS) are needed to manage their ascites. These patients also should be considered for liver transplantation unless there is a contraindication.2
Serial LVP has been shown to be safe and effective in controlling refractory ascites.3 TIPS will decrease the need for repeated LVP in patients with refractory LVP. However, given the uncertainty as to the effect of TIPS creation on survival and the increased risk of encephalopathy, the American Association for the Study of Liver Diseases (AASLD) recommends that TIPS should be used only in those patients who cannot tolerate repeated LVP.4 Repeated LVP also has been shown to be safe and effective in controlling malignant ascites.5,6
LVP can be done in different health care settings. These include the emergency department (ED), interventional radiology suite, inpatient bed, or an outpatient paracentesis clinic. There have been various descriptions of outpatient paracentesis clinics. Reports from the United Kingdom have revealed that paracenteses in these outpatient clinics can be performed safely by nurse practitioners or a liver specialist nurse, that these clinics are highly rated by the patients, and are cost effective.7-10 Gashau and colleagues describe a clinic in Great Britain run by gastroenterology (GI) fellows using an endoscopy suite.11 A nurse practitioner outpatient paracentesis clinic in the US has been described as well.12 Grabau and colleagues present a clinic run by GI endoscopy assistants (licensed practical nurses) using a dedicated paracentesis room in the endoscopy suite.13 Cheng and colleagues describe an outpatient paracentesis clinic in a radiology department run by a single advanced practitioner with assistance from an ultrasound technologist.14 Wang and colleagues present outpatient paracenteses in an outpatient transitional care program by a physician or an advanced practitioner supervised by a physician.15 Sehgal and colleagues describe (in abstract) the creation of a hospitalist-run paracentesis clinic.16
Traditionally, at Veterans Affairs Pittsburgh Healthcare System (VAPHS) in Pennsylvania, if a patient needed LVP, they were admitted to a medicine bed. LVP is not done in the ED, and interventional radiology cannot accommodate the number of patients requiring LVP because of their caseload. The procedure was done by an attending hospitalist or medical residents under the supervision of an attending hospitalist. To improve patient flow and decrease the number of patients using inpatients beds, we created an outpatient paracentesis clinic in 2014. Here, we present the logistics of the clinic, patient demographics, the amount of ascites removed, and the time required to remove the ascites. As part of ongoing quality assurance, we keep track of any complications and report these as well.
Methods
The setting of the outpatient paracentesis clinic is a room in the VAPHS endoscopy suite. The clinic operates 1 half-day per week with up to 3 patients receiving a paracentesis. We use the existing logistics in the endoscopy suite. There are 1 or 2 registered nurses (RNs) who assist the physician performing the paracentesis. The proceduralist is an academic hospitalist who at the time is not on service with residents. The patients are referred to the clinic by the ED, hepatology clinic, palliative care, primary care physicians, or at hospital discharge. In the clinic consult, patients are required to have at least an estimated 3 L of ascites and systolic blood pressure (SBP) ≥ 90. The patients can eat and take medications the morning of the procedure except diuretics. Patients are checked in to the endoscopy suite and a peripheral IV is placed. Blood tests, such as a complete blood count and coagulation studies, are not checked routinely since the AASLD guidelines state that routine prophylactic use of fresh frozen plasma or platelets before paracentesis is not recommended because bleeding is uncommon.3 The proceduralist can order blood work at their discretion.
After the procedure, patients are brought to the recovery area of the endoscopy suite and discharged. The patients are discharged usually within 15 to 30 minutes from arriving in the recovery area after it is assured that the SBP is within 10% of their baseline. Patient follow-up in the outpatient paracentesis clinic is determined by the proceduralist. Most patients need regularly scheduled paracenteses depending on how quickly they reaccumulate ascites. If a patient does not need a regularly scheduled paracentesis, the proceduralist ensures that the appropriate outpatient clinic visit has been scheduled or requested.
Procedure
Informed consent is obtained, and a time-out is performed before each paracentesis. The patient is attached to a cardiac monitor and pulse oximetry as per the endoscopy suite protocol. The proceduralist does a point-of-care ultrasound to find the optimal site and marks the site of puncture. The skin around the marked site is prepared with 3 chlorhexidine gluconate 2%/isopropyl alcohol 70% applicators. A fenestrated drape is used to form a sterile field. The Avanos Paracentesis Kit is routinely used for LVP at VAPHS. Local anesthesia with 1% lidocaine is used with a 25-gauge × 1-inch needle. Deeper anesthesia is obtained with 1% lidocaine, using a 22-gauge × 1.5-inch needle, injecting and aspirating while advancing the needle until ascites is aspirated.
A 15-gauge 3.3-inch Caldwell cannula with an inner needle is inserted into the peritoneal cavity and ascites is aspirated into a syringe. The inner needle is then removed, and the Caldwell cannula is left in the peritoneal cavity and tubing with a roller clamp is attached to the cannula. The tubing is then attached to a 1-L vacuum suction bottle by the RN. We use the CareFusion PleurX drainage bottle. The proceduralist maintains sterility and assures the cannula remains in place. The RN changes the drainage bottles after being filled with 1 L of ascites.
We drain as much ascites as possible until drainage stops on its own. The cannula is then removed, and pressure is held with a gauze pad. An adhesive bandage is then placed over the site. Consistent with AASLD guideline, 25 g of IV albumin 25% is infused for every 3 L of albumin removed provided > 5 L of ascites is removed.3 The albumin is infused during the procedure and not after to limit the time of the procedure. A sample of ascites is sent for cell count with differential and culture.
Results
Between March 2014 and May 2020, 506 paracenteses were performed on 82 patients. The mean age was 66.4 years, and 80 of 82 patients were male. The etiology of the ascites is presented in the Table. Twelve percent of the patients had concomitant hepatocellular carcinoma. Data on the amount of ascites removed were available for all patients, but data on the amount of time it took to do the LVP were available for 392 of 506 paracenteses. The mean volume removed was 7.9 L (range, 0.2-22.9 L), and the mean time of the procedure was 33.3 minutes. The time of the procedure was the time difference between entering and leaving the procedure room. This does not include IV placement or the recovery area time.
There were 5 episodes of postprocedure hypotension that required IV fluid or admission. In all these events, the patients had received the appropriate amount of IV albumin. Three patients required admission, and 1 patient required IV fluid postparacentesis on 2 occasions and then was discharged home. One abdominal wall hematoma occurred. Two patients with umbilical hernias developed incarceration after the paracentesis; both required surgical repair. There were 3 episodes of leakage at the paracentesis site; a skin adhesive was used in 2 cases, and sutures were applied in the other. There were no deaths.
Possible Infections
Ascitic fluid infection is a risk for patients needing paracentesis. Spontaneous bacterial peritonitis (SBP) is a bacterial infection of ascites in the absence of a focal contiguous source. The polymorphonuclear leukocyte (PMN) count in the ascites is ≥ 250 cells/mm3 in the presence of a single organism on culture. Culture-negative neutrocytic ascites (CNNA) is an ascitic fluid PMN count ≥ 250 cells/mm3 in the absence of culture growth obtained before the administration of antibiotics. Monomicrobial nonneutrocytic bacterascites (MNB) is an ascitic fluid PMN count < 250 cells/mm3 with growth of a single organism on culture.17 There was one occasion where a patient developed symptomatic CNNA 3 days after having a therapeutic paracentesis in the clinic at which time his ascites had a normal neutrophil count and a negative culture. He presented with abdominal pain and fever 3 days later, and a diagnostic paracentesis was done in the ED. He was treated as though he had SBP and did well.
Ascites cell count and culture are routinely sent in the clinic, and 1 case of asymptomatic SBP and 3 cases of asymptomatic ascitic fluid infection variants were diagnosed. The patient with SBP grew vancomycin-resistant Enterococcus faecium in his ascites. Two cases were CNNA. These patients were admitted to the hospital and treated with IV antibiotics. One case of MNB occurred that grew Escherichia coli. The patient refused to return to the hospital for IV antibiotics and was treated with a 5-day course of oral ciprofloxacin.
Discussion
We describe an academic hospitalist–run outpatient LVP clinic where large volumes of ascites are removed efficiently and safely. The only other description of a hospitalist-run paracentesis clinic was in abstract form.16 Without the clinic, the patients would have been admitted to the hospital to get an LVP. Based on VAPHS data from fiscal year 2021, the average cost per day of a nontelemetry medicine admission was $3394. Over 74 months, 506 admissions were prevented, which averages to 82 admissions prevented per year, an approximate annual cost savings of $278,308 in the last fiscal year alone.
Possible Complications
The complications we report are congruent with those reported in the literature. Runyon reported that the rate of an abdominal wall hematoma requiring blood transfusion was 0.9%, and the rate of an abdominal wall hematoma not requiring blood transfusion was also 0.9%.18 We had 1 patient who developed an abdominal wall hematoma (0.2% of paracenteses). This patient required 4 units of packed red blood cells. The incidence of ascitic fluid leakage after paracentesis has been reported to be between 0.4% and 2.4%.12 We had 3 episodes of leakage (0.6% of paracenteses). The Z-track technique has been purported to decrease postparacentesis leakage.2 This involves creating a pathway that is nonlinear when anesthetizing the soft tissues and inserting the paracentesis needle. The Z-track technique was not used in any of the paracenteses in our clinic.
Postparacentesis hypotension has been reported to be 0.4% to 1.8%.12,14 We report 5 episodes of hypotension (0.1% of paracenteses) of which 3 patients were admitted to the hospital. Interestingly, 4 of the 5 patients were on β-blockers. Serste and colleagues reported in a crossover trial that paracentesis-induced circulatory dysfunction (PICD) decreased from 80 to 10% when propranolol was discontinued.19 PICD is characterized by reduction of effective arterial blood volume with subsequent activation of vasoconstrictor and antinatriuretic factors that can cause rapid ascites recurrence rate, development of dilutional hyponatremia, hepatorenal syndrome, and increased mortality. IV albumin is given during LVP to prevent PICD. Discontinuing unnecessary antihypertensive medications, especially β-blockers, may mitigate postparacentesis hypotension. In a study of 515 paracenteses, De Gottardi and colleagues reported a 0.2% rate of iatrogenic percutaneous infection of ascites.20 We had 1 patient return 3 days after LVP with fever, abdominal pain, and neutrocytic ascites. His blood and ascites cultures were negative. The etiology of his infected ascites could have been either a spontaneously developed CNNA infection or an iatrogenic percutaneous infection of ascites.
Two cases of incarceration and strangulation of umbilical hernias postparacentesis that required emergent surgical intervention were unanticipated complications. Incarceration of an existing umbilical hernia postparacentesis is an uncommon but serious complication of LVP described in the past in numerous case reports but whose incidence is otherwise unknown.21-26 The fluid and pressure shifts before and after LVP are likely responsible for the hernia incarceration. When ascites is present, the umbilical hernia ring is kept patent by the pressure of the ascitic fluid, and the decrease in tension after removal of ascites may lead to decreased size of the hernia ring and trapping of contents in the hernia sac.25-27 In most reported cases, symptoms and recognition of the incarcerated hernia have occurred within 2 days of the index paracentesis procedure. Most cases were in patients who required serial paracenteses for management of ascites and had relatively regular LVPs.
In both cases, the patients had regular visits for paracentesis, and incarceration occurred 0.5 hours postprocedure, in 1 case and 6 hours in the other. Umbilical hernias are common in patients with cirrhosis, with the prevalence approaching 20%.28 The management of umbilical hernias in patients with ascites is complex and optimal guideline-based management involves elective repair when ascites is adequately controlled to prevent recurrence, with consideration of TIPS at the time of repair.3 However, patients enrolled in outpatient paracentesis clinics are unlikely to have adequate ascites control to be considered optimized for an elective repair. In addition, given the number of serial procedures that they require, it is not surprising that they may be at risk for complications that are otherwise thought to be rare. Although incarceration and strangulation of umbilical hernia is thought to be a rare complication of LVP, patients should be informed of this potential complication so that they are aware to seek medical attention should they develop signs or symptoms.
Guidelines
There are no guidelines on how much ascites can be removed and how quickly the ascites can be removed during LVP. The goal of a therapeutic paracentesis is to remove as much fluid as possible, and there are no limits on the amount that can be removed safely.1 Concerning paracentesis flow rates, Elsabaawy and colleagues showed that ascites flow rate does not correlate with PICD. They looked at 3 groups with ascites flow rates of 80 mL/min, 180 mL/min and 270 mL/min.29 We had data on the time in the procedure room in 77% of our procedures. Given our average amount of ascites removed (7.9 L) and average time in the procedure room (33.3 minutes), the average flow rate from our clinic was at least 237 mL/min (although the flow rate was likely higher because the average time from needle inserted to needle removed was < 33.3 minutes). Both the mean duration of LVP and the mean volume of ascites removed in an outpatient paracentesis clinic were reported in only 1 other study. In a study of 1100 patients, Grabau and colleagues reported the mean duration, defined as the time between when the patient entered and exited the procedure room (the same time period we reported) as 97 minutes and the mean volume of ascites removed as 8.7 L.13
The AASLD guidelines state that patients undergoing serial outpatient LVP should be tested only for cell count and differential without sending a bacterial culture. The reason given is that false positives may exceed true positives from ascites bacterial culture results in asymptomatic patients.3 Mohan and Venkataraman reported a 0.4% rate of SBP, 1.4% rate of CNNA, and 0.7% rate of MNB in asymptomatic patients undergoing LVP in an outpatient clinic.30 We had a 0.2% rate of SBP, 0.4% rate of CNNA, and 0.2% rate of MNB. Given the low rates of SBP in outpatient paracenteses clinics, we will adopt the AASLD suggestions to only send an ascites cell count and not a culture in asymptomatic patients. Noteworthy, our patient with asymptomatic SBP grew vancomycin-resistant Enterococcus faecium, which was resistant to standard SBP antibiotic therapy. However, if ascites culture was not sent, he would have been treated with antibiotics for CNNA, and if he developed symptoms, he would have had a repeat paracentesis with cell count and culture sent.
Training
In 2015, faculty at VAPHS and the University of Pittsburgh School of Medicine designed a Mastering Paracentesis for Medical Residents course based on current guidelines on the management of ascites and published procedural guides. The course is mandatory for all postgraduate year-1 internal medicine residents and begins with 2 hours of didactic and simulation-based training with an ultrasound-compatible paracentesis mannequin. In the 3 weeks following simulation-based training, residents rotate through our outpatient paracentesis clinic and perform between 1 and 3 abdominal paracentesis procedures, receiving as-needed coaching and postprocedure feedback from faculty. Since the course’s inception, more than 150 internal medicine residents have been trained in paracentesis through our clinic.
Conclusions
We present a description of a successful outpatient paracentesis clinic at our hospital run by academic hospitalists. The clinic was created to decrease the number of admissions for LVP. We were fortunate to be able to use the GI endoscopy suite and their resources as the clinic setting. To create outpatient LVP clinics at other institutions, administrative support is essential. In conclusion, we have shown that an outpatient paracentesis clinic run by academic hospitalists can safely and quickly remove large volumes of ascites.
1. Ge PS, Runyon BA. Treatment of patients with cirrhosis. N Engl J Med. 2016;375(8):767-777. doi:10.1056/NEJMra1504367
2. Wong F. Management of ascites in cirrhosis. J Gastroenterol Hepatol. 2012;27(1):11-20. doi:10.1111/j.1440-1746.2011.06925.x
3. Runyon BA; AASLD. Introduction to the revised American Association for the Study of Liver Diseases Practice Guideline management of adult patients with ascites due to cirrhosis 2012. Hepatology. 2013;57(4):1651-1653. doi:10.1002/hep.26359
4. Boyer TD, Haskal ZJ; American Association for the Study of Liver Diseases. The role of transjugular intrahepatic portosystemic shunt (TIPS) in the management of portal hypertension: update 2009. Hepatology. 2010;51(1):306. doi:10.1002/hep.23383
5. Harding V, Fenu E, Medani H, et al. Safety, cost-effectiveness and feasibility of daycase paracentesis in the management of malignant ascites with a focus on ovarian cancer. Br J Cancer. 2012;107(6):925-930. doi:10.1038/bjc.2012.343
6. Korpi S, Salminen VV, Piili RP, Paunu N, Luukkaala T, Lehto JT. Therapeutic procedures for malignant ascites in a palliative care outpatient clinic. J Palliat Med. 2018;21(6):836-841. doi:10.1089/jpm.2017.0616
7. Vaughan J. Developing a nurse-led paracentesis service in an ambulatory care unit. Nurs Stand. 2013;28(4):44-50. doi:10.7748/ns2013.09.28.4.44.e7751
8. Menon S, Thompson L-S, Tan M, et al. Development and cost-benefit analysis of a nurse-led paracentesis and infusion service. Gastrointestinal Nursing. 2016;14(9):32-38. doi:10.12968/gasn.2016.14.9.32
9. Hill S, Smalley JR, Laasch H-U. Developing a nurse-led, day-case, abdominal paracentesis service. Cancer Nursing Practice. 2013;12(5):14-20. doi:10.7748/cnp2013.06.12.5.14.e942
10. Tahir F, Hollywood C, Durrant D. PWE-134 Overview of efficacy and cost effectiveness of nurse led day case abdominal paracentesis service at Gloucestershire Hospital NHS Foundation Trust. Gut. 2014;63(suppl 1):A183.2-A183. doi:10.1136/gutjnl-2014-307263.394
11. Gashau W, Samra G, Gasser J, Rolland M, Sambaiah P, Shorrock C. PTH-075 “ascites clinic”: an outpatient service model for patients requiring large volume paracentesis. Gut. 2014;63(suppl 1):A242.2-A242. doi:10.1136/gutjnl-2014-307263.521
12. Gilani N, Patel N, Gerkin RD, Ramirez FC, Tharalson EE, Patel K. The safety and feasibility of large volume paracentesis performed by an experienced nurse practitioner. Ann Hepatol. 2009;8(4):359-363.
13. Grabau CM, Crago SF, Hoff LK, et al. Performance standards for therapeutic abdominal paracentesis. Hepatology. 2004;40(2):484-488. doi:10.1002/hep.20317
14. Cheng YW, Sandrasegaran K, Cheng K, et al. A dedicated paracentesis clinic decreases healthcare utilization for serial paracenteses in decompensated cirrhosis. Abdom Radiol (NY). 2018;43(8):2190-2197. doi:10.1007/s00261-017-1406-y
15. Wang J, Khan S, Wyer P, et al. The role of ultrasound-guided therapeutic paracentesis in an outpatient transitional care program: a case series. Am J Hosp Palliat Care. 2018;35(9):1256-1260. doi:10.1177/1049909118755378
16. Sehgal R, Dickerson J, Holcomb M. Creation of a hospitalist-run paracentesis clinic [abstract]. J Hosp Med. 2015;10(suppl 2).
17. Sheer TA, Runyon BA. Spontaneous bacterial peritonitis. Dig Dis. 2005;23(1):39-46. doi:10.1159/000084724
18. Runyon BA. Paracentesis of ascitic fluid. A safe procedure. Arch Intern Med. 1986;146(11):2259-2261.
19. Sersté T, Francoz C, Durand F, et al. Beta-blockers cause paracentesis-induced circulatory dysfunction in patients with cirrhosis and refractory ascites: a cross-over study. J Hepatol. 2011;55(4):794-799. doi:10.1016/j.jhep.2011.01.034
20. De Gottardi A, Thévenot T, Spahr L, et al. Risk of complications after abdominal paracentesis in cirrhotic patients: a prospective study. Clin Gastroenterol Hepatol. 2009;7(8):906-909. doi:10.1016/j.cgh.2009.05.004
21. Khodarahmi I, Shahid MU, Contractor S. Incarceration of umbilical hernia: a rare complication of large volume paracentesis. J Radiol Case Rep. 2015;9(9):20-25. doi:10.3941/jrcr.v9i9.2614
22. Chu KM, McCaughan GW. Iatrogenic incarceration of umbilical hernia in cirrhotic patients with ascites. Am J Gastroenterol. 1995;90(11):2058-2059.
23. Triantos CK, Kehagias I, Nikolopoulou V, Burroughs AK. Incarcerated umbilical hernia after large volume paracentesis for refractory ascites. J Gastrointestin Liver Dis. 2010;19(3):245.
24. Touze I, Asselah T, Boruchowicz A, Paris JC. Abdominal pain in a cirrhotic patient with ascites. Postgrad Med J. 1997;73(865):751-752. doi:10.1136/pgmj.73.865.751
25. Baron HC. Umbilical hernia secondary to cirrhosis of the liver. Complications of surgical correction. N Engl J Med. 1960;263:824-828. doi:10.1056/NEJM196010272631702
26. Tan HK, Chang PE. Acute abdomen secondary to incarcerated umbilical hernia after treatment of massive cirrhotic ascites. Case Reports Hepatol. 2013;2013:948172. doi:10.1155/2013/948172
27. Lemmer JH, Strodel WE, Eckhauser FE. Umbilical hernia incarceration: a complication of medical therapy of ascites. Am J Gastroenterol. 1983;78(5):295-296.
28. Belghiti J, Durand F. Abdominal wall hernias in the setting of cirrhosis. Semin Liver Dis. 1997;17(3):219-226. doi:10.1055/s-2007-1007199
29. Elsabaawy MM, Abdelhamid SR, Alsebaey A, et al. The impact of paracentesis flow rate in patients with liver cirrhosis on the development of paracentesis induced circulatory dysfunction. Clin Mol Hepatol. 2015;21(4):365-371. doi:10.3350/cmh.2015.21.4.365
30. Mohan P, Venkataraman J. Prevalence and risk factors for unsuspected spontaneous ascitic fluid infection in cirrhotics undergoing therapeutic paracentesis in an outpatient clinic. Indian J Gastroenterol. 2011;30(5):221-224. doi:10.1007/s12664-011-0131-7
Evaluating the Impact of a Urinalysis to Reflex Culture Process Change in the Emergency Department at a Veterans Affairs Hospital
Automated urine cultures (UCs) following urinalysis (UA) are often used in emergency departments (EDs) to identify urinary tract infections (UTIs). The fast-paced environment of the ED makes this method of proactive collection and facilitation of UC favorable. However, results are often reported as no organism growth or the growth of clinically insignificant organisms, leading to the overdetection and overtreatment of asymptomatic bacteriuria (ASB).1-3 An estimated 30 to 60% of patients with ASB receive unwarranted antibiotic treatment, which is associated with an increased risk of developing Clostridioides difficile infection and contributes to the development of antimicrobial resistance.4-10 The costs associated with UC are an important consideration given the use of resources, the time and effort required to collect and process large numbers of negative cultures, and further efforts devoted to the follow-up of ED culture results.
Changes in traditional testing involving testing of both a UA and UC to reflex testing where urine specimens undergo culture only if they meet certain criteria have been described.11-14 This change in traditional testing aims to reduce the number of potentially unnecessary cultures performed without compromising clinical care. Leukocyte quantity in the UA has been shown to be a reliable predictor of true infection.11,15 Fok and colleagues demonstrated that reflex urine testing in ambulatory male urology patients in which cultures were done on only urine specimens with > 5 white blood cells per high-power field (WBC/HPF) would have missed only 7% of positive UCs, while avoiding 69% of cultures.11
At the Edward Hines, Jr Veterans Affairs Hospital (Hines VA), inappropriate UC ordering and treatment for ASB has been identified as an area needing improvement. An evaluation was conducted at the facility to determine the population of inpatient veterans with a positive UC who were appropriately managed. Of the 113 study patients with a positive UC included in this review, 77 (68%) had a diagnosis of ASB, with > 80% of patients with ASB (and no other suspected infections) receiving antimicrobial therapy.8 A subsequent evaluation was conducted at the Hines VA ED to evaluate UTI treatment and follow-up. Of the 173 ED patients included, 23% received antibiotic therapy for an ASB and 60% had a UA and UC collected but did not report symptoms.9 Finally, a review by the Hines VA laboratory showed that in May 2017, of 359 UCs sent from various locations of the hospital, 38% were obtained in the setting of a negative UA.
A multidisciplinary group with representation from primary care, infectious diseases, pharmacy, nursing, laboratory, and informatics was created with a goal to improve the workup and management of UTIs. In addition to periodic education for the clinicians regarding appropriate use and interpretation of UA and UC along with judicious use of antimicrobials especially in the setting of ASB, a UA to reflex culture process change was implemented. This allowed for automatic cancellation of a UC in the setting of a negative UA, which was designed to help facilitate appropriate UC ordering.
Methods
The primary objective of this study was to compare the frequency of inappropriate UC use and inappropriate antibiotic prescribing pre- and postimplementation of this UA to reflex culture process change. An inappropriate UC was defined as a UC ordered despite a negative UA in asymptomatic patients. Inappropriate antibiotic prescribing was defined as treatment of patients with ASB. The secondary objective evaluated postintervention data to assess the frequency of outpatient, ED, and hospital visits for UTI-related symptoms in the group of patients that had a UC cancelled as a result of the new process change (within a 7-day period of the initial UA) to determine whether patients with true infections were missed due to the process change.
Study Design and Setting
This pre-post quality improvement (QI) study analyzed the UC-ordering practices for UTIs sent from the ED at the Hines VA. This VA is a 483-bed tertiary care hospital in Chicago, Illinois, and serves > 57,000 veterans and about 23,000 ED visits annually. This study was approved by the Edward Hines, Jr VA Institutional Review Board as a quality assurance/QI proposal prior to data collection.
Patient Selection
All patients who
When comparing postintervention data with preintervention data for the primary study objective, the same exclusion criteria from the 2015 study were applied to the present study, which excluded ED patients who were admitted for inpatient care, concurrent antibiotic therapy for a non-UTI indication, duplicate cultures, and use of chronic bladder management devices. All patients identified as receiving a UA during the specified postintervention study period were included for evaluation of the secondary study objective.
Interventions
After physician education, an ED process change was implemented on October 3, 2017. This process change involved the creation of new order sets in the EHR that allowed clinicians to order a UA only, a UA with culture that would be cancelled by laboratory personnel if the UA did not result in > 5 WBC/HPF, and a UA with culture designated as do not cancel, where the UC was processed regardless of the UA results. The scenarios in which the latter option was considered appropriate were listed on the ordering screen and included pregnancy, a genitourinary procedure with necessary preoperative culture, and neutropenia.
Measurements
Postimplementation, all UAs were reviewed and grouped as follows: (1) positive UA with subsequent UC; (2) negative UA, culture cancelled; (3) only UA ordered (no culture); or (4) do not cancel UC ordered. Of the UAs that were analyzed, the following data were collected: demographics, comorbidities, concurrent medications for benign prostatic hyperplasia (BPH) and/or overactive bladder (OAB), documented allergies/adverse drug reactions to antibiotics, date of ED visit, documented UTI signs/symptoms (defined as frequency, urgency, dysuria, fever, suprapubic pain, or altered mental status in patients unable to verbalize urinary symptoms), UC results and susceptibilities, number of UCs repeated within 7 days after initial UA, requirement of antibiotic for UTI within 7 days of initial UA, antibiotic prescribed, duration of antibiotic therapy, and outpatient visits, ED visits, or need for hospital admission within 7 days of the initial UA for UTI-related symptoms. Other relevant UA and UC data that could not be obtained from the EHR were collected by generating a report using the Veterans Information Systems and Technology Architecture (VistA).
Analysis
Statistical analysis was performed using SAS v9.4. Independent t tests and Fisher exact tests were used to describe difference pre- and postintervention. Statistical significance was considered for P < .05. Based on results from the previous study conducted at this facility in addition to a literature review, it was determined that 92 patients in each group (pre- and postintervention) would be necessary to detect a 15% increase in percentage of patients appropriately treated for a UTI.
Results
There were 684 UAs evaluated from ED visits, 429 preintervention and 255 postintervention. The 255 patients were evaluated for the secondary objective of the study. Of the 255 patients with UAs identified postintervention, 150 were excluded based on the predefined exclusion criteria, and the remaining 105 were compared with the 173 patients from the preintervention group and were included in the analysis for the primary objective (Figure 1).
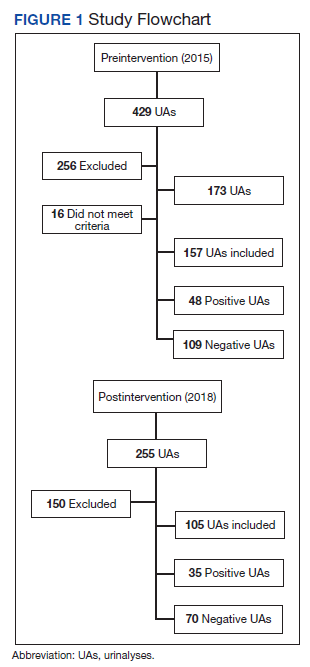
Patients in the postintervention group were younger than those in the preintervention group (P < .02): otherwise the groups were similar (Table 1). Inappropriate antibiotics for ASB decreased from 10.2% preintervention to 1.9% postintervention (odds ratio, 0.17; P = .01) (Table 2). UC processing despite a negative UA significantly decreased from 100% preintervention to 38.6% postintervention (P < .001) (Table 3). In patients with a negative UA, antibiotic prescribing decreased by 25.3% postintervention, but this difference was not statistically significant.
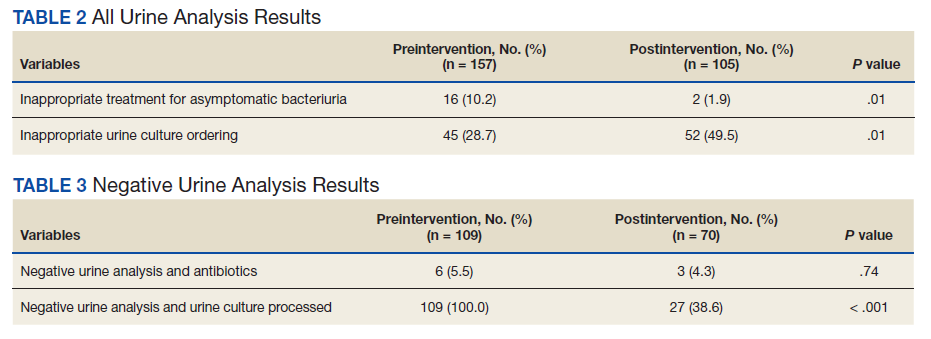
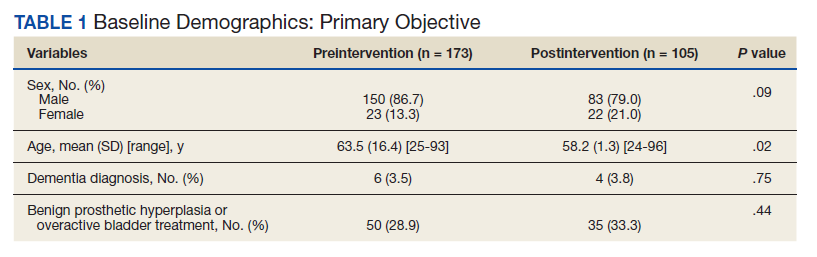
Postintervention, of 255 UAs evaluated, 95 (37.3%) were positive with a processed UC and 95 (37.3%) were negative with UC cancelled, 43 (16.9%) were ordered as DNC, and 22 (8.6%) were ordered without a UC (Figure 2). Twenty-eight of the 95 (29.5%) UAs with processed UCs did not meet the criteria for a positive UA and were not designated as DNC. When the UCs of this subgroup of patients were further analyzed, we found that 2 of the cultures were positive of which 1 patient was symptomatic and required antibiotic therapy.
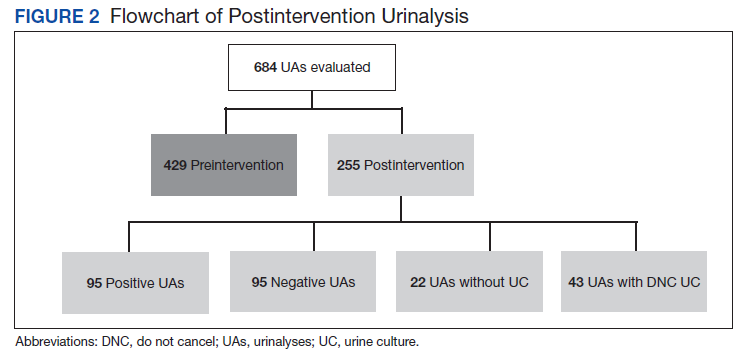
Of the 95 patients with a negative UA, 69 (72.6%) presented without any UTI-related symptoms. In this group, there were no reports of outpatient visits, ED visits, or hospital admissions within 7 days of initial UA for UTI-related symptoms. None of the UCs ordered as DNC had a supporting reason identified. Nonetheless, the UC results from this patient subgroup also were analyzed further and resulted in 4 patients with negative UA and positive subsequent UC, 1 was symptomatic and required antibiotic therapy.
Discussion
A simple process change at the Hines VA resulted in benefits related to antimicrobial stewardship without conferring adverse outcomes on patient safety. Both UC processing despite a negative UA and inappropriate antibiotic prescribing for ASB were reduced significantly postintervention. This process change was piloted in the ED where UCs are often included as part of the initial diagnostic testing in patients who may not report UTI-related symptoms but for whom a UC is often bundled with other infectious workup, depending on the patient presentation.
Reflex testing of urine specimens has been described in the literature, both in an exploratory nature where impact of a reflex UC cancellation protocol based on certain UA criteria is measured by percent reduction of UCs processed as well as results of such interventions implemented into clinical practice.11-13 A retrospective study performed at the University of North Carolina Medical Center evaluated patients who presented to the ED during a 6-month period and had both an automated UA and UC collected. UC processing was restricted to UA that was positive for nitrites, leukocyte esterase, bacteria, or > 10 WBC/HPF. Use of this reflex culture cancellation protocol could have eliminated 604 of the 1546 (39.1%) cultures processed. However, 11 of the 314 (3.5%) positive cultures could have been missed.13 This same protocol was externally validated at another large academic ED setting, where similar results were found.14
In clinical practice, there is a natural tendency to reflexively prescribe antibiotics based on the results of a positive UC due to the hesitancy in ignoring these results, despite lack of a suspicion for a true infection. Leis and colleagues explored this in a proof-of-concept study evaluating the impact of discontinuing the routine reporting of positive UC results from noncatheterized inpatients and requesting clinicians to call the laboratory for results if a UTI was suspected.16 This intervention resulted in a statistically significant reduction in treatment of ASB in noncatheterized patients from 48 to 12% pre- and postintervention. Clinicians requested culture results only 14% of the time, and there were no adverse outcomes among untreated noncatheterized patients. More recently, a QI study conducted at a large community hospital in Toronto, Ontario, Canada, implemented a 2-step model of care for urine collection.17 UC was collected but only processed by the microbiology laboratory if the ED physicians deemed it necessary after clinical assessment.
After implementation, there was a decrease in the proportion of ED visits associated with processed UC (from 6.0% to 4.7% of visits per week; P < .001), ED visits associated with callbacks for processing UC (1.8% to 1.1% of visits per month; P < .001), and antimicrobial prescriptions for urinary symptoms among hospitalized patients (from 20.6% to 10.9%; P < .001). Equally important, despite the 937 cases in which urine was collected but cultures were not processed, no evidence of untreated UTIs was identified.17
The results from the present study similarly demonstrate minimal concern for potentially undertreating these patients. As seen in the subgroup of patients included in the positive UA group, which did not meet criteria for positive UA per protocol (n = 29), only 2 of the subsequent cultures were positive, of which only 1 patient required antibiotic therapy based on the clinical presentation. In addition, in the group of negative UAs with subsequent cancellation of the UC, there were no found reports of outpatient visits, ED visits, or hospital admissions within 7 days of the initial UA for UTI-related symptoms.
Limitations
This single-center, pre-post QI study was not without limitations. Manual chart reviews were required, and accuracy of information was dependent on clinician documentation and assessment of UTI-related symptoms. The population studied was predominately older males; thus, results may not be applicable to females or young adults. Additionally, recognition of a negative UA and subsequent cancellation of the UC was dependent on laboratory personnel. As noted in the patient group with a positive UA, some of these UAs were negative and may have been overlooked; therefore, subsequent UCs were inappropriately processed. However, this occurred infrequently and confirmed the low probability of true UTI in the setting of a negative UA. Follow-up for UTI-related symptoms may not have been captured if a patient had presented to an outside facility. Last, definitions of a positive UA differed slightly between the pre- and postintervention groups. The preintervention study defined a positive UA as a WBC count > 5 WBC/HPF and positive leukocyte esterase, whereas the present study defined a positive UA with a WBC count > 5. This may have resulted in an overestimation of positive UA in the postintervention group.
Conclusions
Better selective use of UC testing may improve stewardship resources and reduce costs impacting both ED and clinical laboratories. Furthermore, benefits can include a reduction in the use of time and resources required to collect samples for culture, use of test supplies, the time and effort required to process the large number of negative cultures, and resources devoted to the follow-up of these ED culture results. The described UA to reflex culture process change demonstrated a significant reduction in the processing of inappropriate UC and unnecessary antibiotics for ASB. There were no missed UTIs or other adverse patient outcomes noted. This process change has been implemented in all departments at the Hines VA and additional data will be collected to ensure consistent outcomes.
1. Chironda B, Clancy S, Powis JE. Optimizing urine culture collection in the emergency department using frontline ownership interventions. Clin Infect Dis. 2014;59(7):1038-1039. doi:10.1093/cid/ciu412
2. Nagurney JT, Brown DF, Chang Y, Sane S, Wang AC, Weiner JB. Use of diagnostic testing in the emergency department for patients presenting with non-traumatic abdominal pain. J Emerg Med. 2003;25(4):363-371. doi:10.1016/s0736-4679(03)00237-3
3. Lammers RL, Gibson S, Kovacs D, Sears W, Strachan G. Comparison of test characteristics of urine dipstick and urinalysis at various test cutoff points. Ann Emerg Med. 2001;38(5):505-512. doi:10.1067/mem.2001.119427
4. Nicolle LE, Gupta K, Bradley SF, et al. Clinical practice guideline for the management of asymptomatic bacteriuria: 2019 update by the Infectious Diseases Society of America. Clin Infect Dis. 2019;68(10):1611-1615. doi:10.1093/cid/ciy1121
5. Trautner BW, Grigoryan L, Petersen NJ, et al. Effectiveness of an antimicrobial stewardship approach for urinary catheter-associated asymptomatic bacteriuria. JAMA Intern Med. 2015;175(7):1120-1127. doi:10.1001/jamainternmed.2015.1878
6. Hartley S, Valley S, Kuhn L, et al. Overtreatment of asymptomatic bacteriuria: identifying targets for improvement. Infect Control Hosp Epidemiol. 2015;36(4):470-473. doi:10.1017/ice.2014.73
7. Bader MS, Loeb M, Brooks AA. An update on the management of urinary tract infections in the era of antimicrobial resistance. Postgrad Med. 2017;129(2):242-258. doi:10.1080/00325481.2017.1246055
8. Spivak ES, Burk M, Zhang R, et al. Management of bacteriuria in Veterans Affairs hospitals. Clin Infect Dis. 2017;65(6):910-917. doi:10.1093/cid/cix474
9. Kim EY, Patel U, Patel B, Suda KJ. Evaluation of bacteriuria treatment and follow-up initiated in the emergency department at a Veterans Affairs hospital. J Pharm Technol. 2017;33(5):183-188. doi:10.1177/8755122517718214
10. Brown E, Talbot GH, Axelrod P, Provencher M, Hoegg C. Risk factors for Clostridium difficile toxin-associated diarrhea. Infect Control Hosp Epidemiol. 1990;11(6):283-290. doi:10.1086/646173
11. Fok C, Fitzgerald MP, Turk T, Mueller E, Dalaza L, Schreckenberger P. Reflex testing of male urine specimens misses few positive cultures may reduce unnecessary testing of normal specimens. Urology. 2010;75(1):74-76. doi:10.1016/j.urology.2009.08.071
12. Munigala S, Jackups RR Jr, Poirier RF, et al. Impact of order set design on urine culturing practices at an academic medical centre emergency department. BMJ Qual Saf. 2018;27(8):587-592. doi:10.1136/bmjqs-2017-006899
13. Jones CW, Culbreath KD, Mehrotra A, Gilligan PH. Reflect urine culture cancellation in the emergency department. J Emerg Med. 2014;46(1):71-76. doi:10.1016/j.jemermed.2013.08.042
14. Hertz JT, Lescallette RD, Barrett TW, Ward MJ, Self WH. External validation of an ED protocol for reflex urine culture cancelation. Am J Emerg Med. 2015;33(12):1838-1839. doi:10.1016/j.ajem.2015.09.026
15. Stamm WE. Measurement of pyuria and its relation to bacteriuria. Am J Med. 1983;75(1B):53-58. doi:10.1016/0002-9343(83)90073-6
16. Leis JA, Rebick GW, Daneman N, et al. Reducing antimicrobial therapy for asymptomatic bacteriuria among noncatheterized inpatients: a proof-of-concept study. Clin Infect Dis. 2014;58(7):980-983. doi:10.1093/cid/ciu010
17. Stagg A, Lutz H, Kirpalaney S, et al. Impact of two-step urine culture ordering in the emergency department: a time series analysis. BMJ Qual Saf. 2017;27:140-147. doi:10.1136/bmjqs-2016-006250
Automated urine cultures (UCs) following urinalysis (UA) are often used in emergency departments (EDs) to identify urinary tract infections (UTIs). The fast-paced environment of the ED makes this method of proactive collection and facilitation of UC favorable. However, results are often reported as no organism growth or the growth of clinically insignificant organisms, leading to the overdetection and overtreatment of asymptomatic bacteriuria (ASB).1-3 An estimated 30 to 60% of patients with ASB receive unwarranted antibiotic treatment, which is associated with an increased risk of developing Clostridioides difficile infection and contributes to the development of antimicrobial resistance.4-10 The costs associated with UC are an important consideration given the use of resources, the time and effort required to collect and process large numbers of negative cultures, and further efforts devoted to the follow-up of ED culture results.
Changes in traditional testing involving testing of both a UA and UC to reflex testing where urine specimens undergo culture only if they meet certain criteria have been described.11-14 This change in traditional testing aims to reduce the number of potentially unnecessary cultures performed without compromising clinical care. Leukocyte quantity in the UA has been shown to be a reliable predictor of true infection.11,15 Fok and colleagues demonstrated that reflex urine testing in ambulatory male urology patients in which cultures were done on only urine specimens with > 5 white blood cells per high-power field (WBC/HPF) would have missed only 7% of positive UCs, while avoiding 69% of cultures.11
At the Edward Hines, Jr Veterans Affairs Hospital (Hines VA), inappropriate UC ordering and treatment for ASB has been identified as an area needing improvement. An evaluation was conducted at the facility to determine the population of inpatient veterans with a positive UC who were appropriately managed. Of the 113 study patients with a positive UC included in this review, 77 (68%) had a diagnosis of ASB, with > 80% of patients with ASB (and no other suspected infections) receiving antimicrobial therapy.8 A subsequent evaluation was conducted at the Hines VA ED to evaluate UTI treatment and follow-up. Of the 173 ED patients included, 23% received antibiotic therapy for an ASB and 60% had a UA and UC collected but did not report symptoms.9 Finally, a review by the Hines VA laboratory showed that in May 2017, of 359 UCs sent from various locations of the hospital, 38% were obtained in the setting of a negative UA.
A multidisciplinary group with representation from primary care, infectious diseases, pharmacy, nursing, laboratory, and informatics was created with a goal to improve the workup and management of UTIs. In addition to periodic education for the clinicians regarding appropriate use and interpretation of UA and UC along with judicious use of antimicrobials especially in the setting of ASB, a UA to reflex culture process change was implemented. This allowed for automatic cancellation of a UC in the setting of a negative UA, which was designed to help facilitate appropriate UC ordering.
Methods
The primary objective of this study was to compare the frequency of inappropriate UC use and inappropriate antibiotic prescribing pre- and postimplementation of this UA to reflex culture process change. An inappropriate UC was defined as a UC ordered despite a negative UA in asymptomatic patients. Inappropriate antibiotic prescribing was defined as treatment of patients with ASB. The secondary objective evaluated postintervention data to assess the frequency of outpatient, ED, and hospital visits for UTI-related symptoms in the group of patients that had a UC cancelled as a result of the new process change (within a 7-day period of the initial UA) to determine whether patients with true infections were missed due to the process change.
Study Design and Setting
This pre-post quality improvement (QI) study analyzed the UC-ordering practices for UTIs sent from the ED at the Hines VA. This VA is a 483-bed tertiary care hospital in Chicago, Illinois, and serves > 57,000 veterans and about 23,000 ED visits annually. This study was approved by the Edward Hines, Jr VA Institutional Review Board as a quality assurance/QI proposal prior to data collection.
Patient Selection
All patients who
When comparing postintervention data with preintervention data for the primary study objective, the same exclusion criteria from the 2015 study were applied to the present study, which excluded ED patients who were admitted for inpatient care, concurrent antibiotic therapy for a non-UTI indication, duplicate cultures, and use of chronic bladder management devices. All patients identified as receiving a UA during the specified postintervention study period were included for evaluation of the secondary study objective.
Interventions
After physician education, an ED process change was implemented on October 3, 2017. This process change involved the creation of new order sets in the EHR that allowed clinicians to order a UA only, a UA with culture that would be cancelled by laboratory personnel if the UA did not result in > 5 WBC/HPF, and a UA with culture designated as do not cancel, where the UC was processed regardless of the UA results. The scenarios in which the latter option was considered appropriate were listed on the ordering screen and included pregnancy, a genitourinary procedure with necessary preoperative culture, and neutropenia.
Measurements
Postimplementation, all UAs were reviewed and grouped as follows: (1) positive UA with subsequent UC; (2) negative UA, culture cancelled; (3) only UA ordered (no culture); or (4) do not cancel UC ordered. Of the UAs that were analyzed, the following data were collected: demographics, comorbidities, concurrent medications for benign prostatic hyperplasia (BPH) and/or overactive bladder (OAB), documented allergies/adverse drug reactions to antibiotics, date of ED visit, documented UTI signs/symptoms (defined as frequency, urgency, dysuria, fever, suprapubic pain, or altered mental status in patients unable to verbalize urinary symptoms), UC results and susceptibilities, number of UCs repeated within 7 days after initial UA, requirement of antibiotic for UTI within 7 days of initial UA, antibiotic prescribed, duration of antibiotic therapy, and outpatient visits, ED visits, or need for hospital admission within 7 days of the initial UA for UTI-related symptoms. Other relevant UA and UC data that could not be obtained from the EHR were collected by generating a report using the Veterans Information Systems and Technology Architecture (VistA).
Analysis
Statistical analysis was performed using SAS v9.4. Independent t tests and Fisher exact tests were used to describe difference pre- and postintervention. Statistical significance was considered for P < .05. Based on results from the previous study conducted at this facility in addition to a literature review, it was determined that 92 patients in each group (pre- and postintervention) would be necessary to detect a 15% increase in percentage of patients appropriately treated for a UTI.
Results
There were 684 UAs evaluated from ED visits, 429 preintervention and 255 postintervention. The 255 patients were evaluated for the secondary objective of the study. Of the 255 patients with UAs identified postintervention, 150 were excluded based on the predefined exclusion criteria, and the remaining 105 were compared with the 173 patients from the preintervention group and were included in the analysis for the primary objective (Figure 1).
Patients in the postintervention group were younger than those in the preintervention group (P < .02): otherwise the groups were similar (Table 1). Inappropriate antibiotics for ASB decreased from 10.2% preintervention to 1.9% postintervention (odds ratio, 0.17; P = .01) (Table 2). UC processing despite a negative UA significantly decreased from 100% preintervention to 38.6% postintervention (P < .001) (Table 3). In patients with a negative UA, antibiotic prescribing decreased by 25.3% postintervention, but this difference was not statistically significant.
Postintervention, of 255 UAs evaluated, 95 (37.3%) were positive with a processed UC and 95 (37.3%) were negative with UC cancelled, 43 (16.9%) were ordered as DNC, and 22 (8.6%) were ordered without a UC (Figure 2). Twenty-eight of the 95 (29.5%) UAs with processed UCs did not meet the criteria for a positive UA and were not designated as DNC. When the UCs of this subgroup of patients were further analyzed, we found that 2 of the cultures were positive of which 1 patient was symptomatic and required antibiotic therapy.
Of the 95 patients with a negative UA, 69 (72.6%) presented without any UTI-related symptoms. In this group, there were no reports of outpatient visits, ED visits, or hospital admissions within 7 days of initial UA for UTI-related symptoms. None of the UCs ordered as DNC had a supporting reason identified. Nonetheless, the UC results from this patient subgroup also were analyzed further and resulted in 4 patients with negative UA and positive subsequent UC, 1 was symptomatic and required antibiotic therapy.
Discussion
A simple process change at the Hines VA resulted in benefits related to antimicrobial stewardship without conferring adverse outcomes on patient safety. Both UC processing despite a negative UA and inappropriate antibiotic prescribing for ASB were reduced significantly postintervention. This process change was piloted in the ED where UCs are often included as part of the initial diagnostic testing in patients who may not report UTI-related symptoms but for whom a UC is often bundled with other infectious workup, depending on the patient presentation.
Reflex testing of urine specimens has been described in the literature, both in an exploratory nature where impact of a reflex UC cancellation protocol based on certain UA criteria is measured by percent reduction of UCs processed as well as results of such interventions implemented into clinical practice.11-13 A retrospective study performed at the University of North Carolina Medical Center evaluated patients who presented to the ED during a 6-month period and had both an automated UA and UC collected. UC processing was restricted to UA that was positive for nitrites, leukocyte esterase, bacteria, or > 10 WBC/HPF. Use of this reflex culture cancellation protocol could have eliminated 604 of the 1546 (39.1%) cultures processed. However, 11 of the 314 (3.5%) positive cultures could have been missed.13 This same protocol was externally validated at another large academic ED setting, where similar results were found.14
In clinical practice, there is a natural tendency to reflexively prescribe antibiotics based on the results of a positive UC due to the hesitancy in ignoring these results, despite lack of a suspicion for a true infection. Leis and colleagues explored this in a proof-of-concept study evaluating the impact of discontinuing the routine reporting of positive UC results from noncatheterized inpatients and requesting clinicians to call the laboratory for results if a UTI was suspected.16 This intervention resulted in a statistically significant reduction in treatment of ASB in noncatheterized patients from 48 to 12% pre- and postintervention. Clinicians requested culture results only 14% of the time, and there were no adverse outcomes among untreated noncatheterized patients. More recently, a QI study conducted at a large community hospital in Toronto, Ontario, Canada, implemented a 2-step model of care for urine collection.17 UC was collected but only processed by the microbiology laboratory if the ED physicians deemed it necessary after clinical assessment.
After implementation, there was a decrease in the proportion of ED visits associated with processed UC (from 6.0% to 4.7% of visits per week; P < .001), ED visits associated with callbacks for processing UC (1.8% to 1.1% of visits per month; P < .001), and antimicrobial prescriptions for urinary symptoms among hospitalized patients (from 20.6% to 10.9%; P < .001). Equally important, despite the 937 cases in which urine was collected but cultures were not processed, no evidence of untreated UTIs was identified.17
The results from the present study similarly demonstrate minimal concern for potentially undertreating these patients. As seen in the subgroup of patients included in the positive UA group, which did not meet criteria for positive UA per protocol (n = 29), only 2 of the subsequent cultures were positive, of which only 1 patient required antibiotic therapy based on the clinical presentation. In addition, in the group of negative UAs with subsequent cancellation of the UC, there were no found reports of outpatient visits, ED visits, or hospital admissions within 7 days of the initial UA for UTI-related symptoms.
Limitations
This single-center, pre-post QI study was not without limitations. Manual chart reviews were required, and accuracy of information was dependent on clinician documentation and assessment of UTI-related symptoms. The population studied was predominately older males; thus, results may not be applicable to females or young adults. Additionally, recognition of a negative UA and subsequent cancellation of the UC was dependent on laboratory personnel. As noted in the patient group with a positive UA, some of these UAs were negative and may have been overlooked; therefore, subsequent UCs were inappropriately processed. However, this occurred infrequently and confirmed the low probability of true UTI in the setting of a negative UA. Follow-up for UTI-related symptoms may not have been captured if a patient had presented to an outside facility. Last, definitions of a positive UA differed slightly between the pre- and postintervention groups. The preintervention study defined a positive UA as a WBC count > 5 WBC/HPF and positive leukocyte esterase, whereas the present study defined a positive UA with a WBC count > 5. This may have resulted in an overestimation of positive UA in the postintervention group.
Conclusions
Better selective use of UC testing may improve stewardship resources and reduce costs impacting both ED and clinical laboratories. Furthermore, benefits can include a reduction in the use of time and resources required to collect samples for culture, use of test supplies, the time and effort required to process the large number of negative cultures, and resources devoted to the follow-up of these ED culture results. The described UA to reflex culture process change demonstrated a significant reduction in the processing of inappropriate UC and unnecessary antibiotics for ASB. There were no missed UTIs or other adverse patient outcomes noted. This process change has been implemented in all departments at the Hines VA and additional data will be collected to ensure consistent outcomes.
1. Chironda B, Clancy S, Powis JE. Optimizing urine culture collection in the emergency department using frontline ownership interventions. Clin Infect Dis. 2014;59(7):1038-1039. doi:10.1093/cid/ciu412
2. Nagurney JT, Brown DF, Chang Y, Sane S, Wang AC, Weiner JB. Use of diagnostic testing in the emergency department for patients presenting with non-traumatic abdominal pain. J Emerg Med. 2003;25(4):363-371. doi:10.1016/s0736-4679(03)00237-3
3. Lammers RL, Gibson S, Kovacs D, Sears W, Strachan G. Comparison of test characteristics of urine dipstick and urinalysis at various test cutoff points. Ann Emerg Med. 2001;38(5):505-512. doi:10.1067/mem.2001.119427
4. Nicolle LE, Gupta K, Bradley SF, et al. Clinical practice guideline for the management of asymptomatic bacteriuria: 2019 update by the Infectious Diseases Society of America. Clin Infect Dis. 2019;68(10):1611-1615. doi:10.1093/cid/ciy1121
5. Trautner BW, Grigoryan L, Petersen NJ, et al. Effectiveness of an antimicrobial stewardship approach for urinary catheter-associated asymptomatic bacteriuria. JAMA Intern Med. 2015;175(7):1120-1127. doi:10.1001/jamainternmed.2015.1878
6. Hartley S, Valley S, Kuhn L, et al. Overtreatment of asymptomatic bacteriuria: identifying targets for improvement. Infect Control Hosp Epidemiol. 2015;36(4):470-473. doi:10.1017/ice.2014.73
7. Bader MS, Loeb M, Brooks AA. An update on the management of urinary tract infections in the era of antimicrobial resistance. Postgrad Med. 2017;129(2):242-258. doi:10.1080/00325481.2017.1246055
8. Spivak ES, Burk M, Zhang R, et al. Management of bacteriuria in Veterans Affairs hospitals. Clin Infect Dis. 2017;65(6):910-917. doi:10.1093/cid/cix474
9. Kim EY, Patel U, Patel B, Suda KJ. Evaluation of bacteriuria treatment and follow-up initiated in the emergency department at a Veterans Affairs hospital. J Pharm Technol. 2017;33(5):183-188. doi:10.1177/8755122517718214
10. Brown E, Talbot GH, Axelrod P, Provencher M, Hoegg C. Risk factors for Clostridium difficile toxin-associated diarrhea. Infect Control Hosp Epidemiol. 1990;11(6):283-290. doi:10.1086/646173
11. Fok C, Fitzgerald MP, Turk T, Mueller E, Dalaza L, Schreckenberger P. Reflex testing of male urine specimens misses few positive cultures may reduce unnecessary testing of normal specimens. Urology. 2010;75(1):74-76. doi:10.1016/j.urology.2009.08.071
12. Munigala S, Jackups RR Jr, Poirier RF, et al. Impact of order set design on urine culturing practices at an academic medical centre emergency department. BMJ Qual Saf. 2018;27(8):587-592. doi:10.1136/bmjqs-2017-006899
13. Jones CW, Culbreath KD, Mehrotra A, Gilligan PH. Reflect urine culture cancellation in the emergency department. J Emerg Med. 2014;46(1):71-76. doi:10.1016/j.jemermed.2013.08.042
14. Hertz JT, Lescallette RD, Barrett TW, Ward MJ, Self WH. External validation of an ED protocol for reflex urine culture cancelation. Am J Emerg Med. 2015;33(12):1838-1839. doi:10.1016/j.ajem.2015.09.026
15. Stamm WE. Measurement of pyuria and its relation to bacteriuria. Am J Med. 1983;75(1B):53-58. doi:10.1016/0002-9343(83)90073-6
16. Leis JA, Rebick GW, Daneman N, et al. Reducing antimicrobial therapy for asymptomatic bacteriuria among noncatheterized inpatients: a proof-of-concept study. Clin Infect Dis. 2014;58(7):980-983. doi:10.1093/cid/ciu010
17. Stagg A, Lutz H, Kirpalaney S, et al. Impact of two-step urine culture ordering in the emergency department: a time series analysis. BMJ Qual Saf. 2017;27:140-147. doi:10.1136/bmjqs-2016-006250